
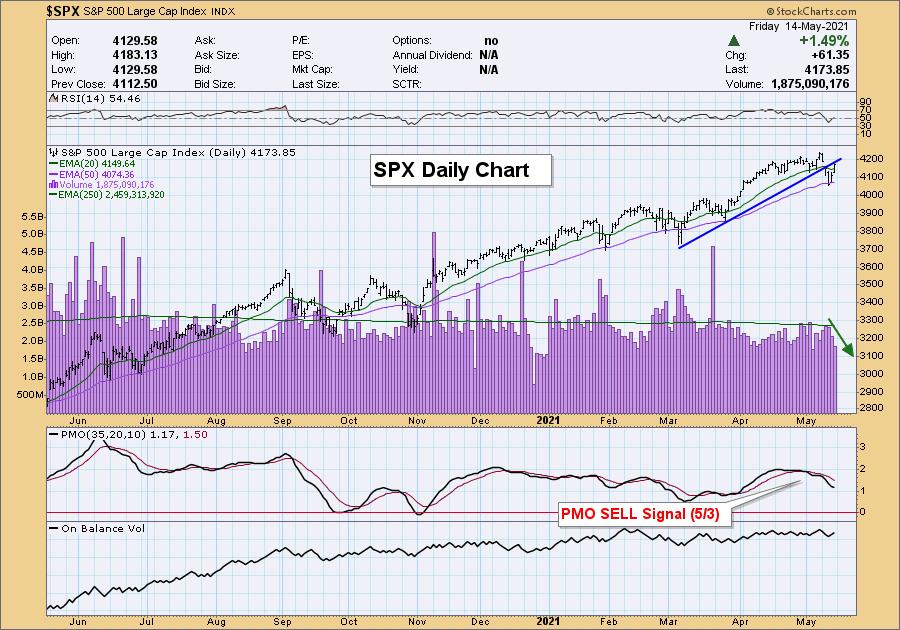
When the market rallied yesterday and Total Volume fell below its 200-EMA. Today the SPX rallied +1.49% and Total Volume fell further. While this isn't a formal negative divergence, it does tell us that confirmation and the exuberance of the rally is missing as far as volume is concerned. We had a mild climax day that does suggest an upside exhaustion. The short-term rising trend has not been recaptured.
The DecisionPoint Alert Weekly Wrap presents an end-of-week assessment of the trend and condition of the Stock Market, the U.S. Dollar, Gold, Crude Oil, and Bonds. The DecisionPoint Alert daily report (Monday through Thursday) is abbreviated and gives updates on the Weekly Wrap assessments.
Watch the latest episode of DecisionPoint on StockCharts TV's YouTube channel here!
MAJOR MARKET INDEXES
For Friday: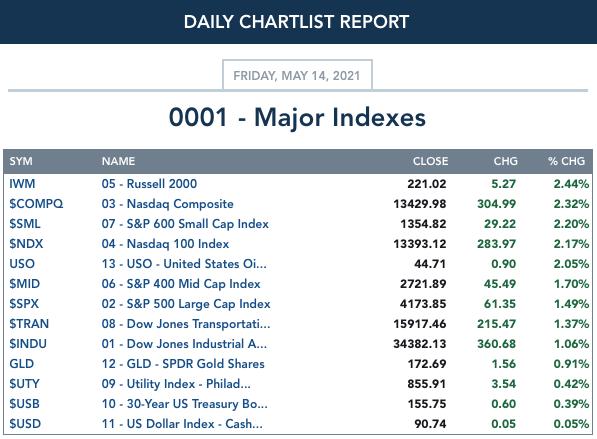
For the week: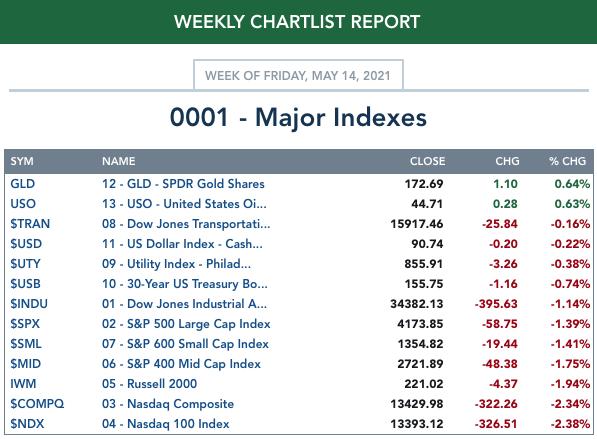
SECTORS
Each S&P 500 Index component stock is assigned to one, and only one, of 11 major sectors. This is a snapshot of the Intermediate-Term (Silver Cross) and Long-Term (Golden Cross) Trend Model signal status for those sectors.

For Today: 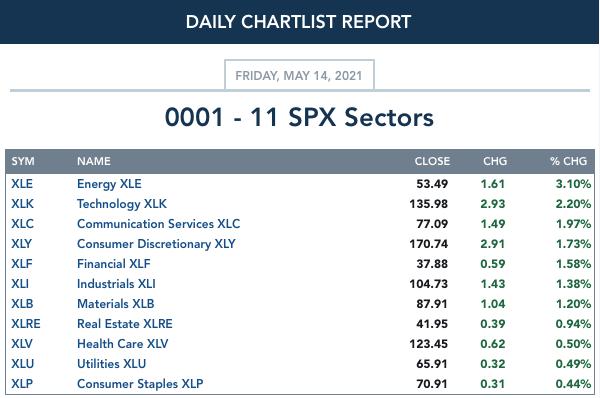
For the Week: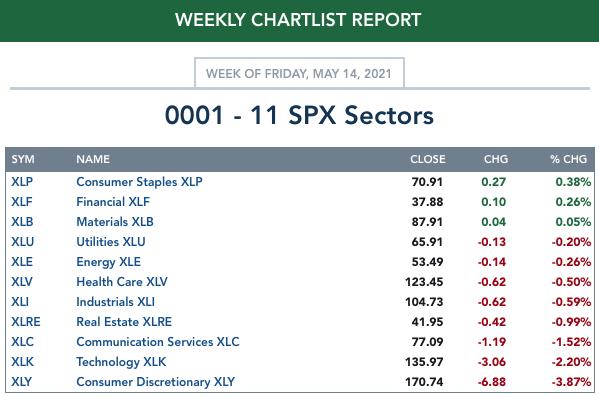
CLICK HERE for Carl's annotated Sector charts.
THE MARKET (S&P 500)
IT Trend Model: BUY as of 5/8/2020
LT Trend Model: BUY as of 6/8/2020
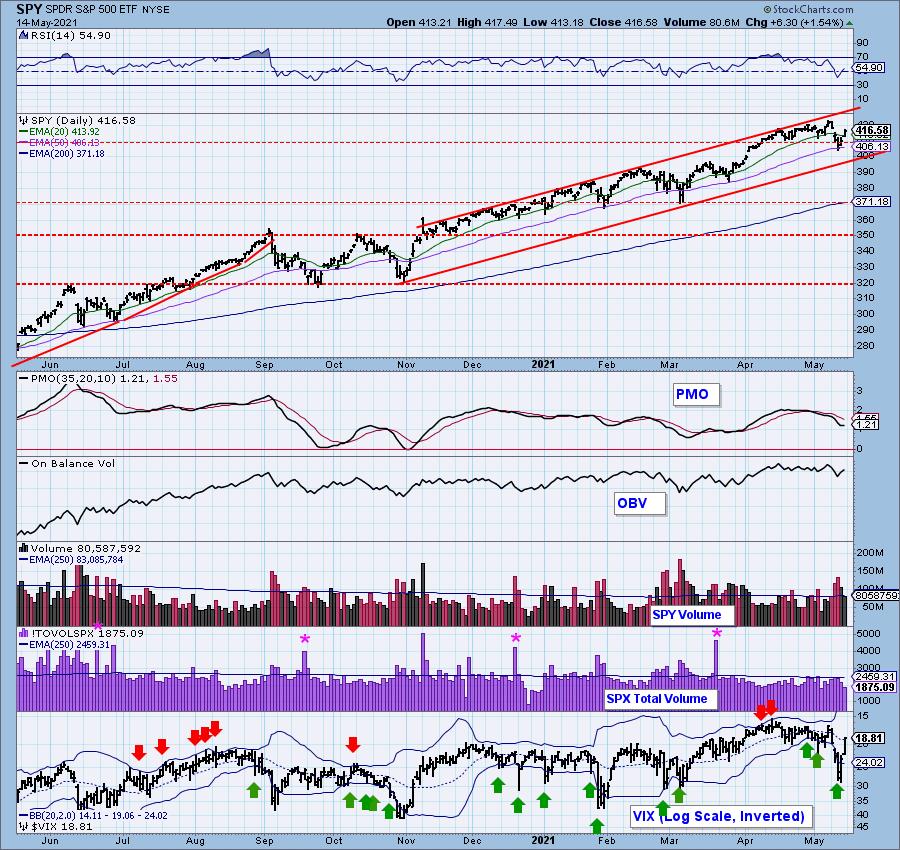
SPY Daily Chart: Today's rally brought price above the 20-EMA, but the short-term rising trend hasn't been recaptured. The RSI did make back into positive territory, but the PMO is still declining.
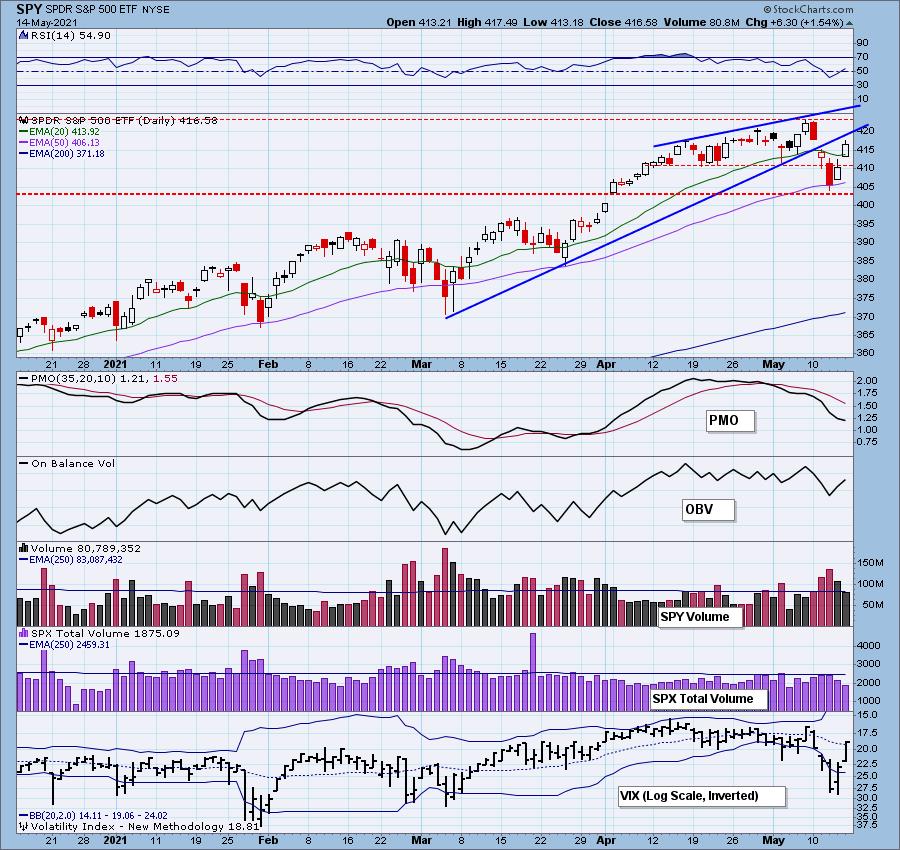
The longer-term rising trend remains intact.

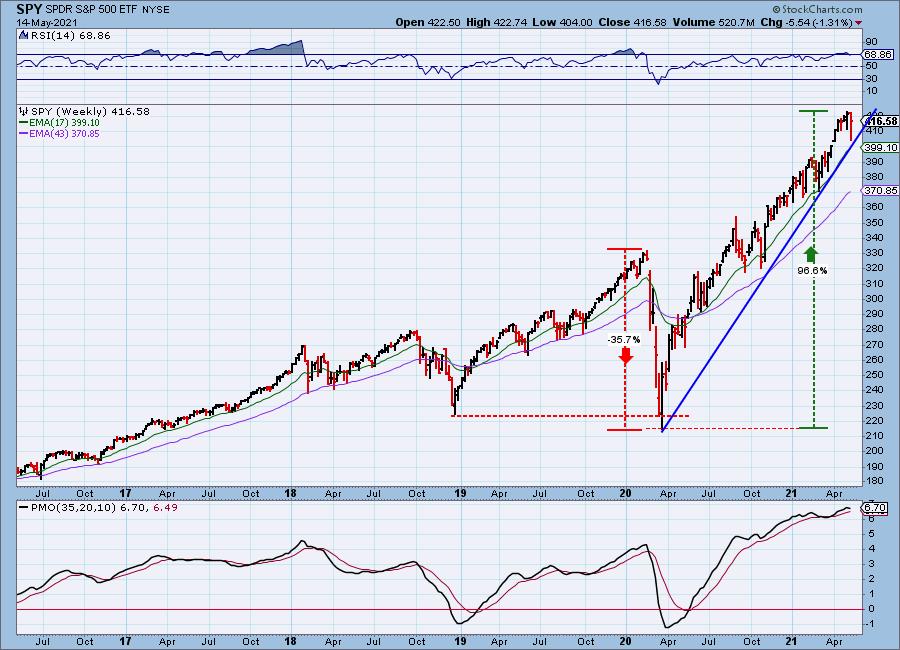
SPY Weekly Chart: This week's decline successfully tested the long-term rising trend. The weekly RSI is finally retreating out of overbought territory. However, we note that the weekly PMO has now turned down.
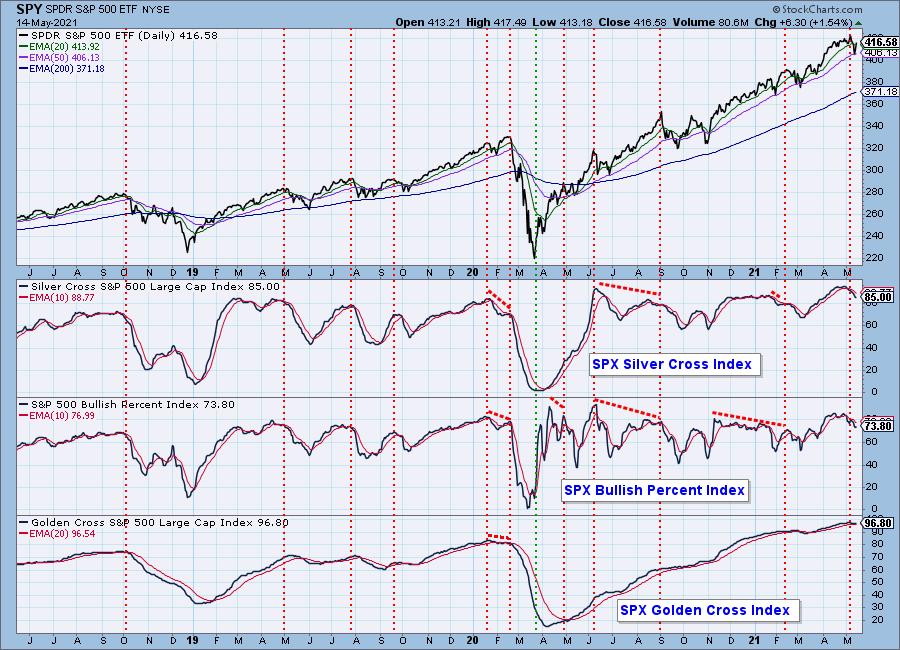
PARTICIPATION: The following chart uses different methodologies for objectively showing the depth and trend of participation for intermediate- and long-term time frames.
- The Silver Cross Index (SCI) shows the percentage of SPX stocks on IT Trend Model BUY signals (20-EMA > 50-EMA).
- The Golden Cross Index (GCI) shows the percentage of SPX stocks on LT Trend Model BUY signals (50-EMA > 200-EMA).
- The Bullish Percent Index (BPI) shows the percentage of SPX stocks on Point & Figure BUY signals.
The SCI continues its decline from overbought extremes. The BPI did tick up slightly today, but it remains overbought and in a declining trend. The GCI turned back down this week, but didn't drop much. It is still holding above its signal line, but is very overbought.
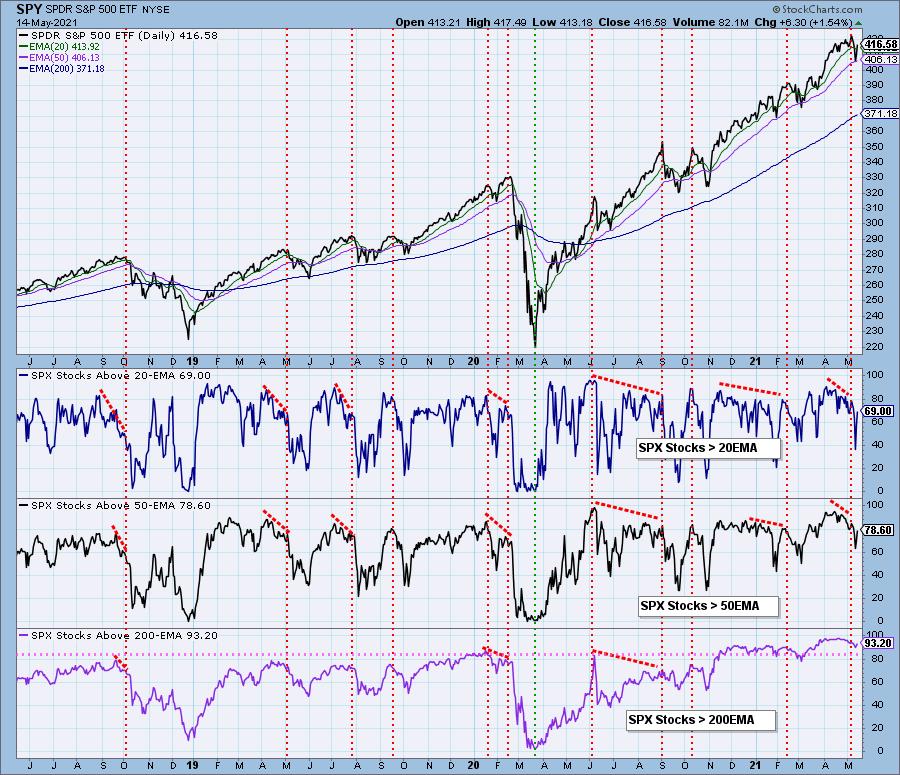
Short-term participation (%Stocks > 20-EMA) has quickly moved out of oversold territory. %Stocks > 50-EMA never quite reached oversold territory, but has reversed. Both of these readings are in mostly neutral territory. However, long-term participation (%Stocks > 200-EMA) trended lower this week and remains highly overbought.
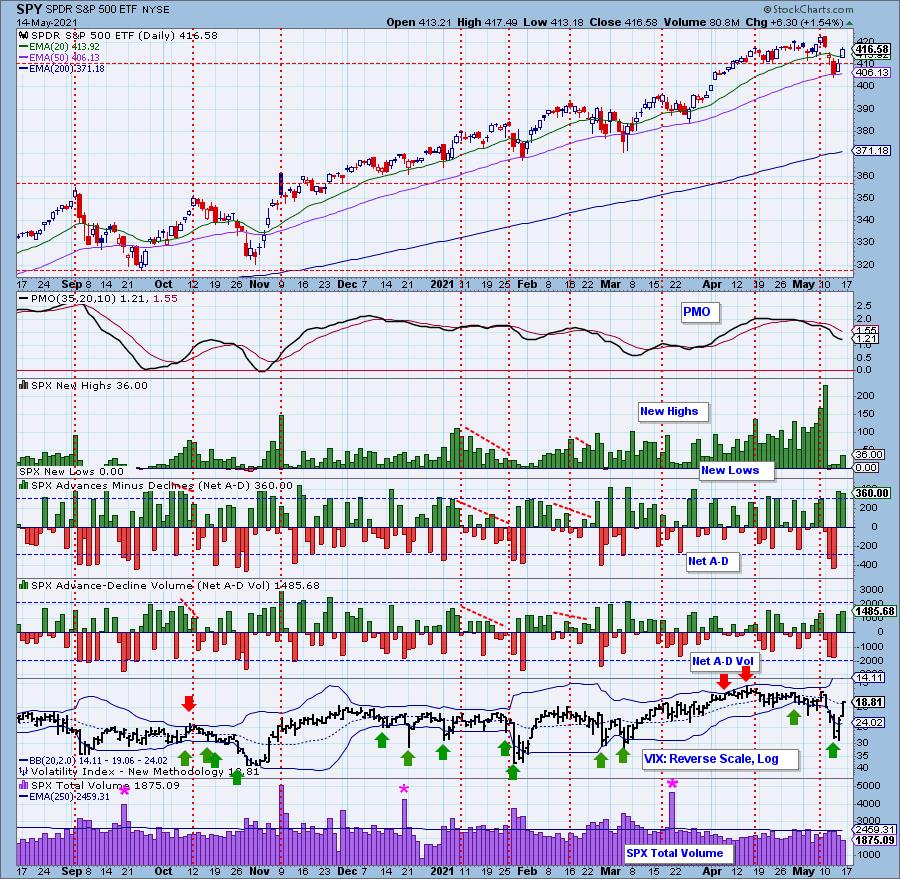
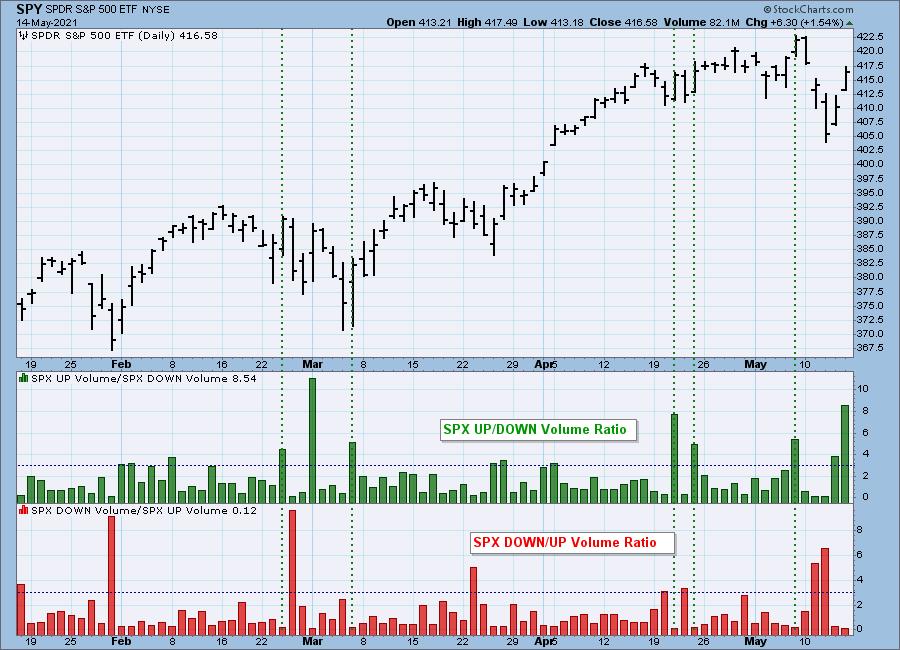
Climax Analysis: We would hesitate to call this a climax day, because of the notable contraction of SPX Total Volume; however, there are climactic readings on the Net A-D chart, as well as the volume ratio charts. If we were to stretch a point, we could call this an upside exhaustion climax with its attendant potential for churn or reversal next week. The contraction in SPX Total Volume might also contribute to that outcome.
NYSE Up/Down and Down/Up volume ratios are also climax detectors. The 9:1 ratio suggested by the late Dr. Martin Zweig in his book, Winning on Wall Street, is especially significant, but we primarily look for spikes outside the normal range to clarify a particular event. We have an NYSE and S&P 500 version of the ratios, and normally they will only be published when there is a notable reading.
Today's volume ratio on the NYSE is the highest positive reading in the last four months. Many times these readings are "initiations" (price continues higher). The current environment seems most like the early March reading that arrived after downside climaxes that resulted in lower prices.
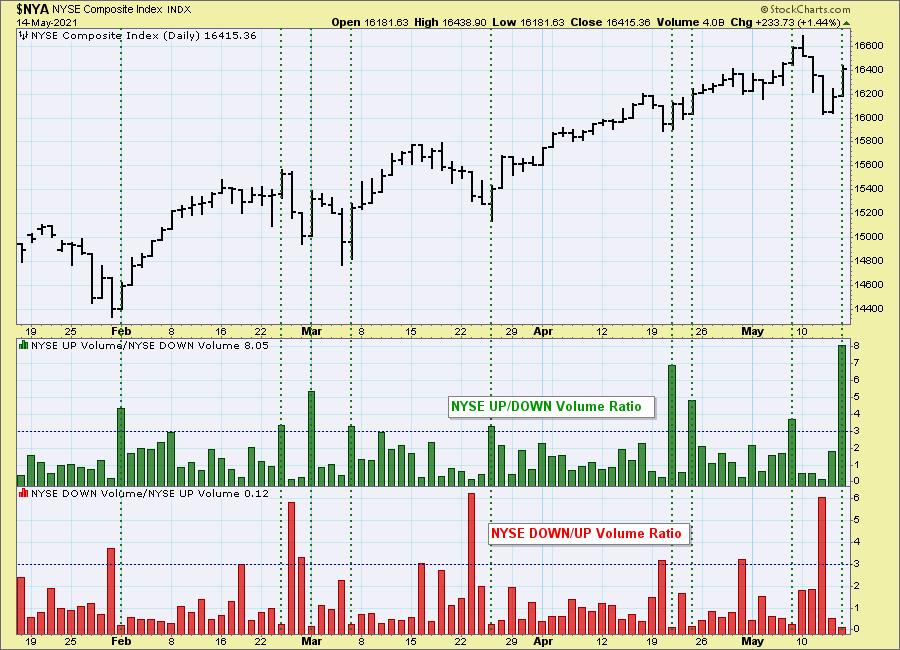
The S&P 500 version can get different results than the NYSE version because: (a) there are only 500 stocks versus a few thousand; and (b) those 500 stocks are all large-cap stocks that tend to move with more uniformity.
Days like today demonstrate the homogeneity of the S&P 500 and how the majority of those stocks can lean in one direction or the other, and today the more than 8:1 ratio of up volume to down volume gave us a clearly climactic reading. Note the highest reading from Apr/Mar was an upside exhaustion climax.
Short-Term Market Indicators: The short-term market trend is DOWN and the condition is NEUTRAL.
We are finally seeing negative readings on the STOs. While these readings appear oversold, history shows us that it isn't always the case. The STOs support an exhaustion as they have declined on both rally days. %PMOs rising was oversold, but readings have risen and sit in neutral territory right now. As mentioned earlier, we have the same condition on %Stocks > 20-EMA.
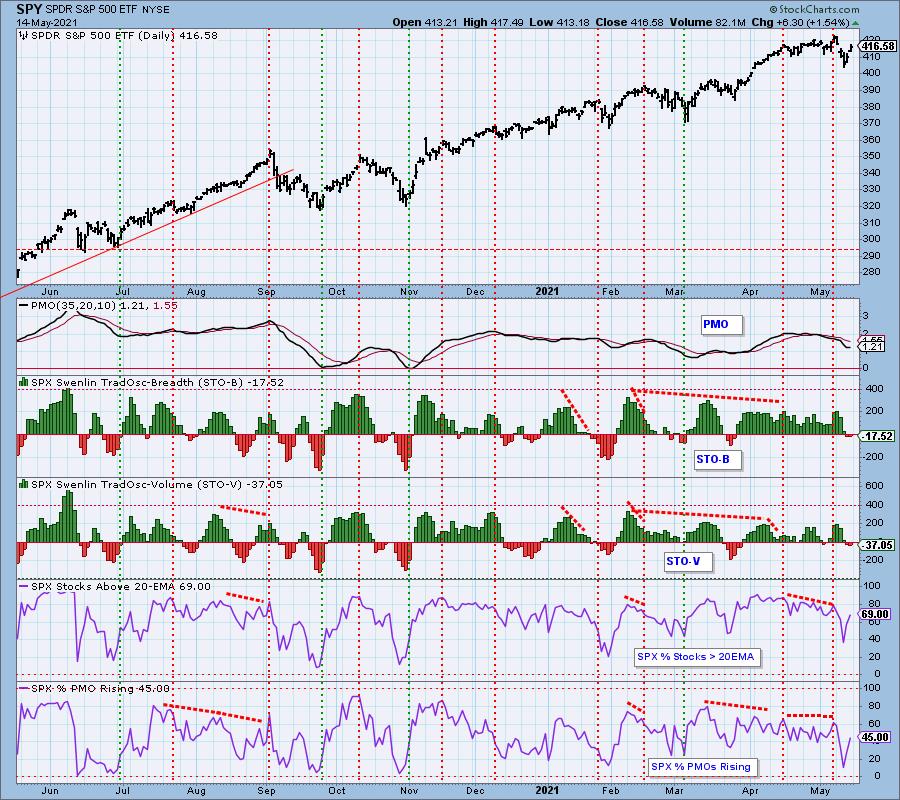
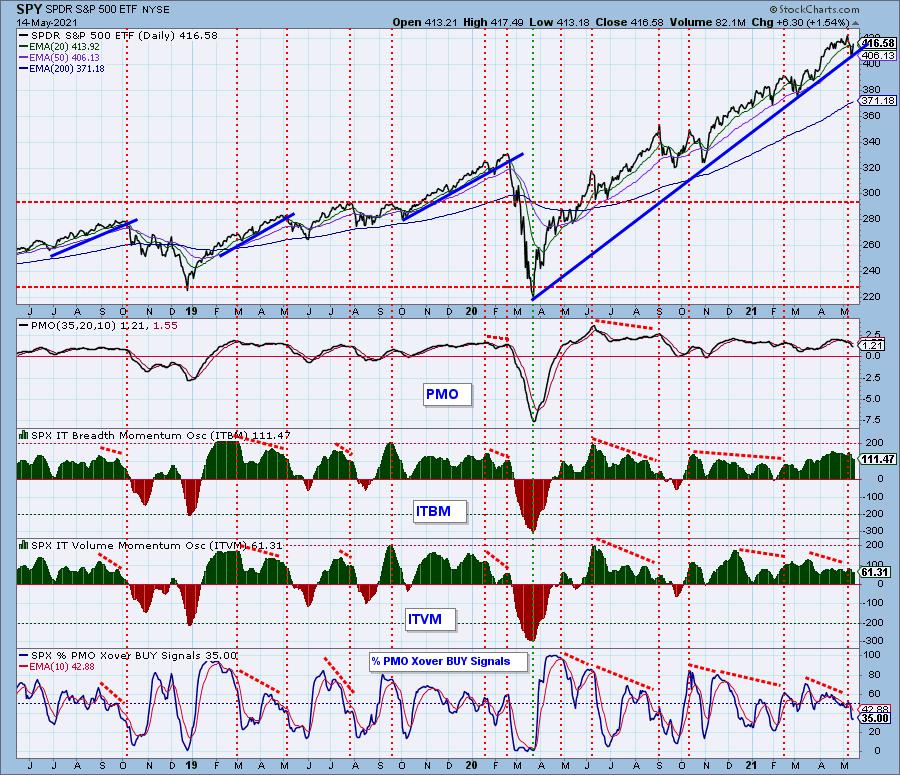
Intermediate-Term Market Indicators: The intermediate-term market trend is UP and the condition is OVERBOUGHT. The market bias is BULLISH.
The ITBM and ITVM both moved slightly higher today as price bounced off the intermediate-term rising trend. Regardless, they are both overbought. %PMO Crossover BUY signals continued lower even after yesterday and today's rallies.
CONCLUSION: Despite two days of rally, the STOs continue lower and volume has retreated. Other short-term indicators did rise, but this has taken them out of oversold territory and moved them into precarious neutral territory. Price is sitting on top of the longer-term rising trendline from the bear market low. Given intermediate-term overbought conditions need to be relieved, we believe this rising trend is in jeopardy. Also keep in mind that trading today had the earmarks of an upside exhaustion and that suggests, at best, a week of choppy trading ahead.
Calendar: Next week is options expiration, and we should expect low volatility toward the end of the week.
Have you subscribed the DecisionPoint Diamonds yet? DP does the work for you by providing handpicked stocks/ETFs from exclusive DP scans! Add it with a discount! Contact support@decisionpoint.com for more information!
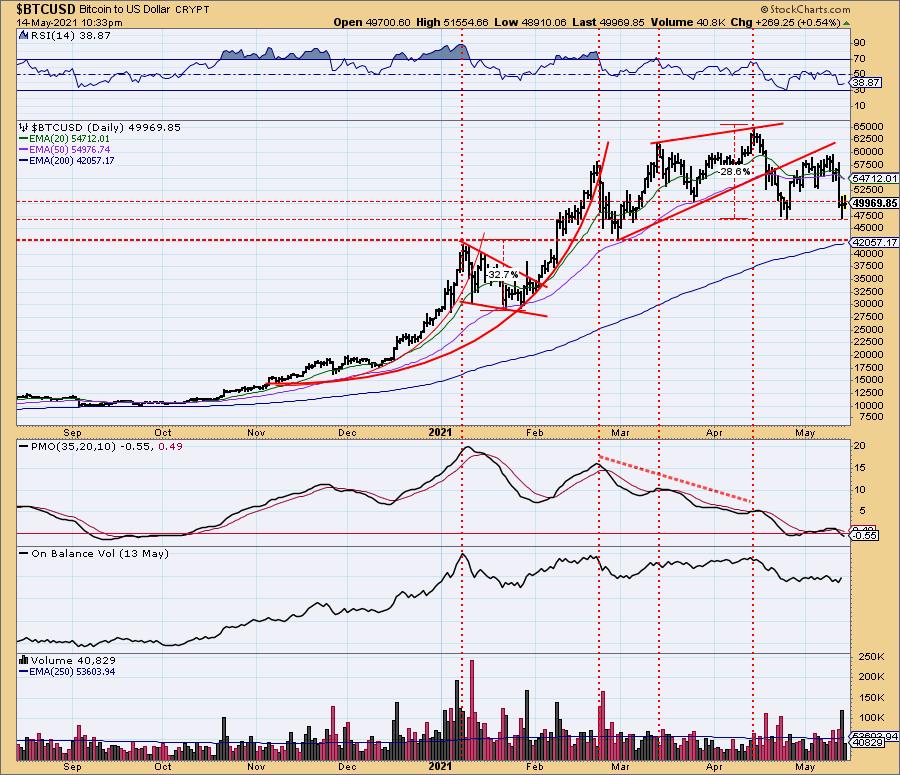
BITCOIN
Bitcoin had a bad week but it is finding support on the April low. However, a new IT Trend Model Neutral signal was triggered as the 20-EMA crossed below the 50-EMA. Add to that a negative RSI and a falling PMO that is sitting below the zero line and it seems most likely that Bitcoin will test support at the 200-EMA.
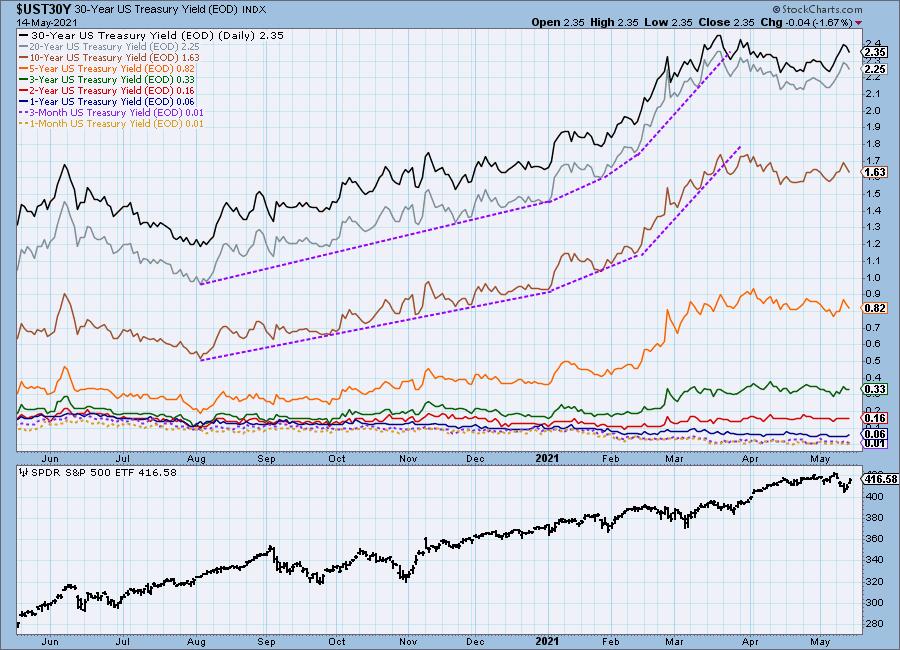
INTEREST RATES
Yields spent much of the week rising after bouncing off support at April lows. We believe yields will continue in their current rising trends.
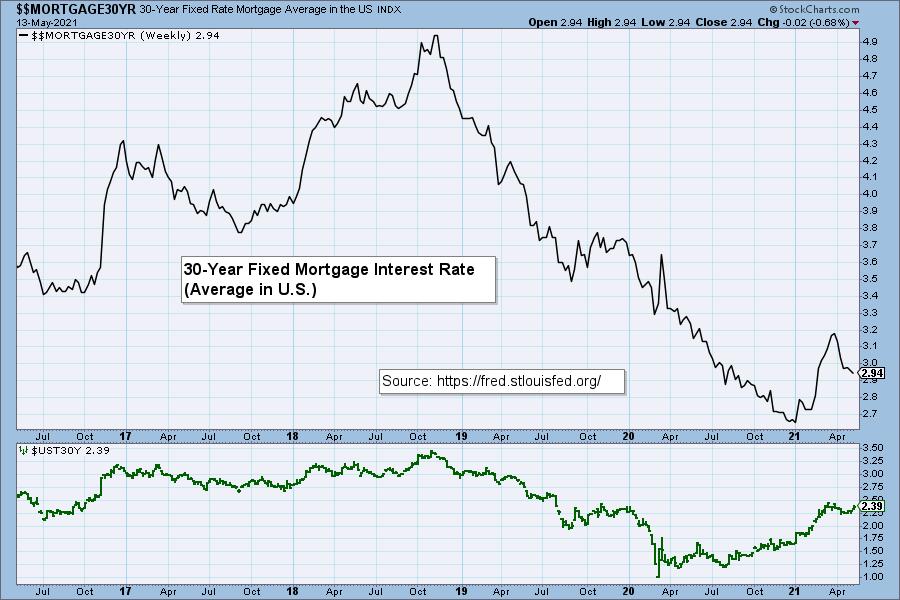
MORTGAGE INTEREST RATES (30-Yr)
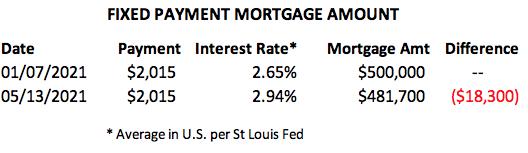
We want to watch the 30-Year Fixed Mortgage Interest Rate, because, for the most part, people buy homes based upon the maximum monthly payment they can afford. As rates rise, a fixed monthly payment will carry a smaller mortgage amount. (See table.) As mortgages are forced to shrink, real estate prices will have to fall, and many sellers will increasingly find that they are upside down with their mortgage.
Mortgage currently are falling after spending most of the year in a rising trend. The trend has been broken so we expect rates to continue lower for now.
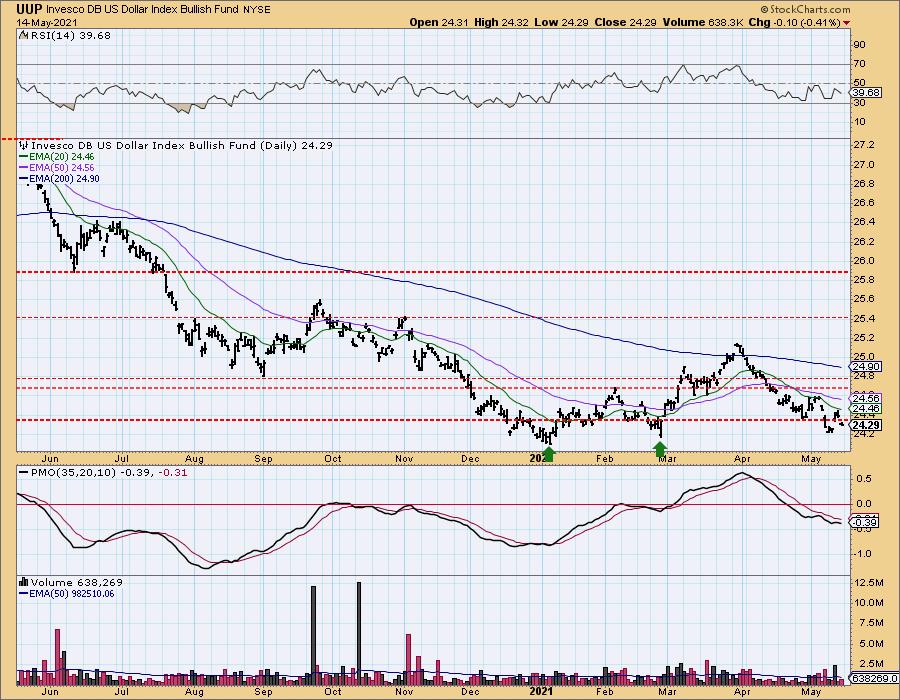
DOLLAR (UUP)
IT Trend Model: SELL as of 4/26/2021
LT Trend Model: SELL as of 7/10/2020
UUP Daily Chart: The Dollar was a mess this week. Ultimately it finished retesting the rising trendline. The 20-EMA continues to be a pivot point.
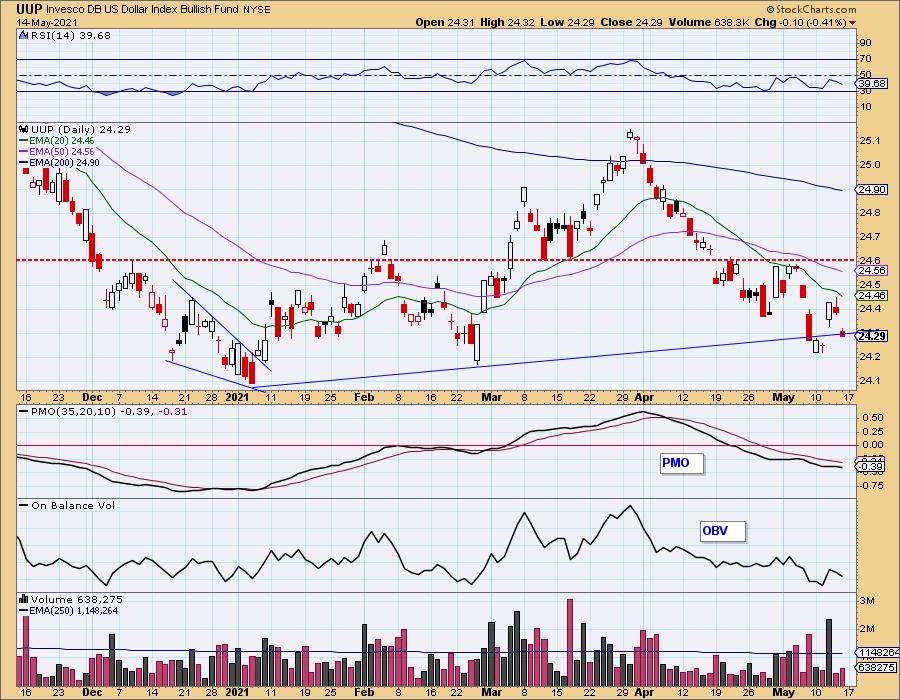
The PMO had attempted to turn it around, but resumed its decline. The RSI remains in negative territory.
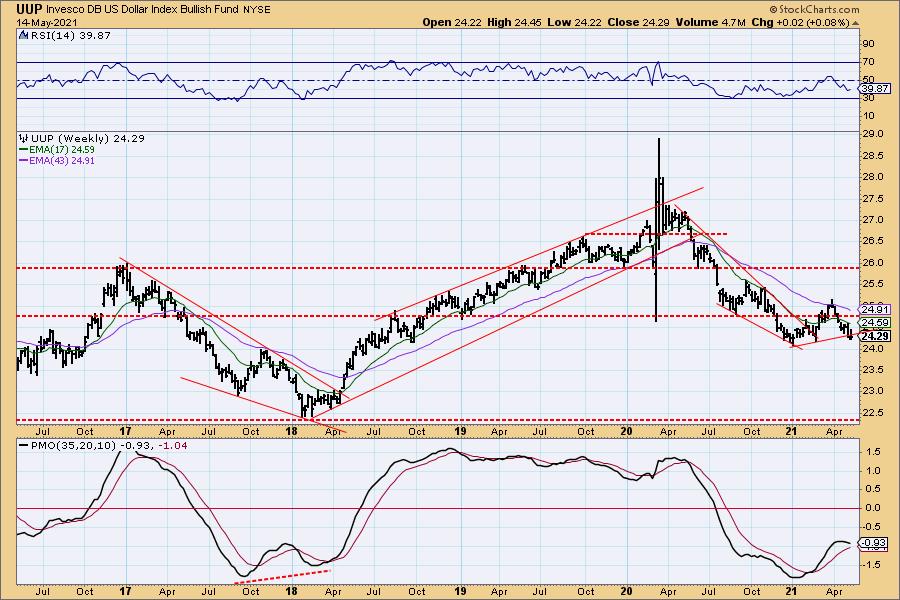
UUP Weekly Chart: The rising trend on the weekly chart has been breached. The weekly PMO continues to decline and the weekly RSI is negative. $24.00 is the strongest support level, but given the negative configuration on the PMO and RSI, it isn't likely to hold.
GOLD
IT Trend Model: BUY as of 5/3/2021
LT Trend Model: SELL as of 3/4/2021
GOLD Daily Chart: Gold still looks bullish. We did see a pullback this week, but it rebounded right off support at $170 for GLD.
(Full Disclosure: Erin owns GLD)
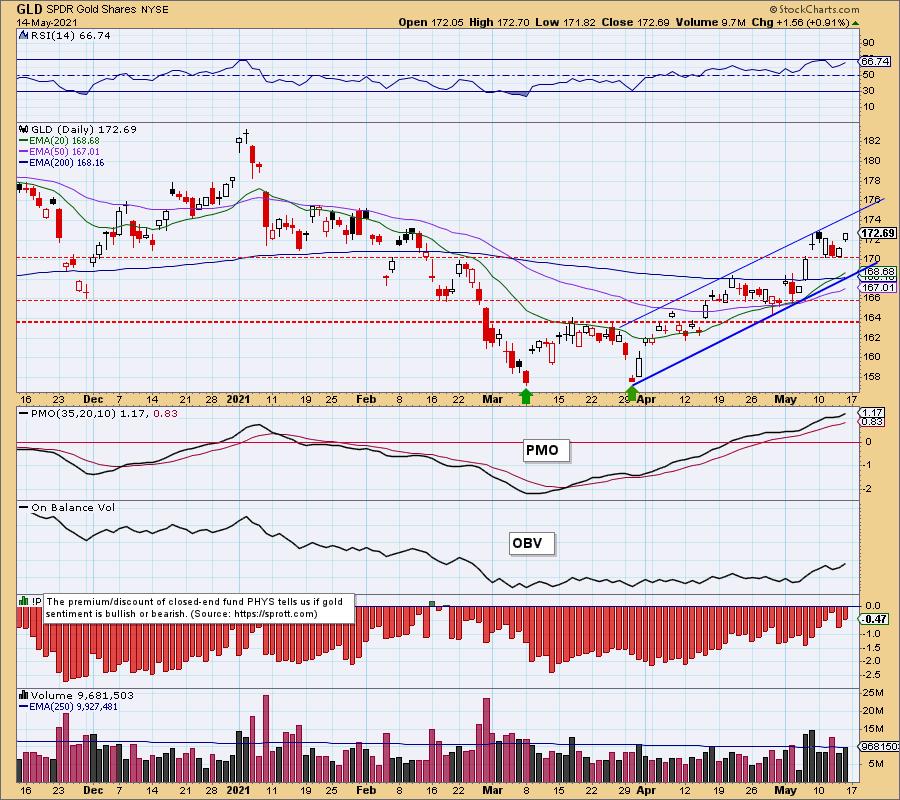
The RSI is positive and not overbought and the PMO is rising and definitely not overbought. We do note that overhead resistance is coming soon at $1875 for $GOLD.
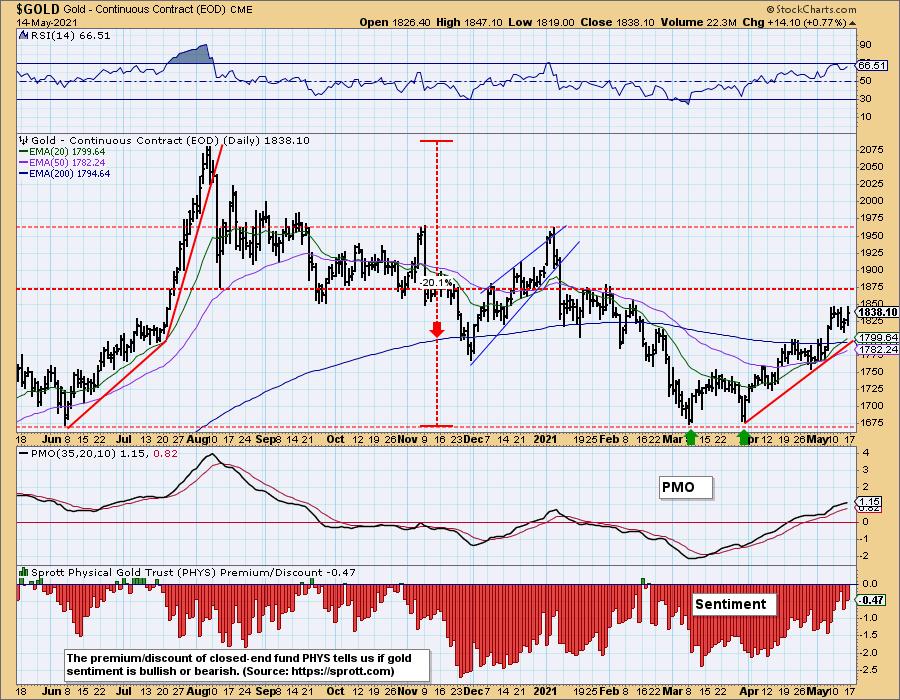
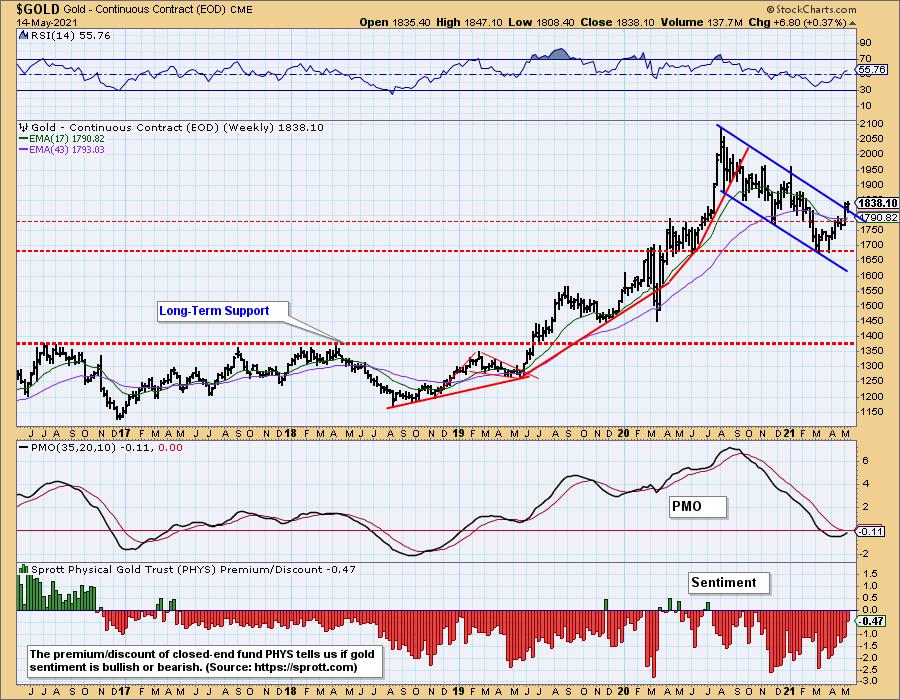
GOLD Weekly Chart: We can see a long-term breakout from the declining trend on the weekly chart. The weekly RSI and PMO are quite positive with the weekly PMO nearing a crossover BUY signal. Discounts contracted this week suggesting that participants are less bearish and likely to buy more.
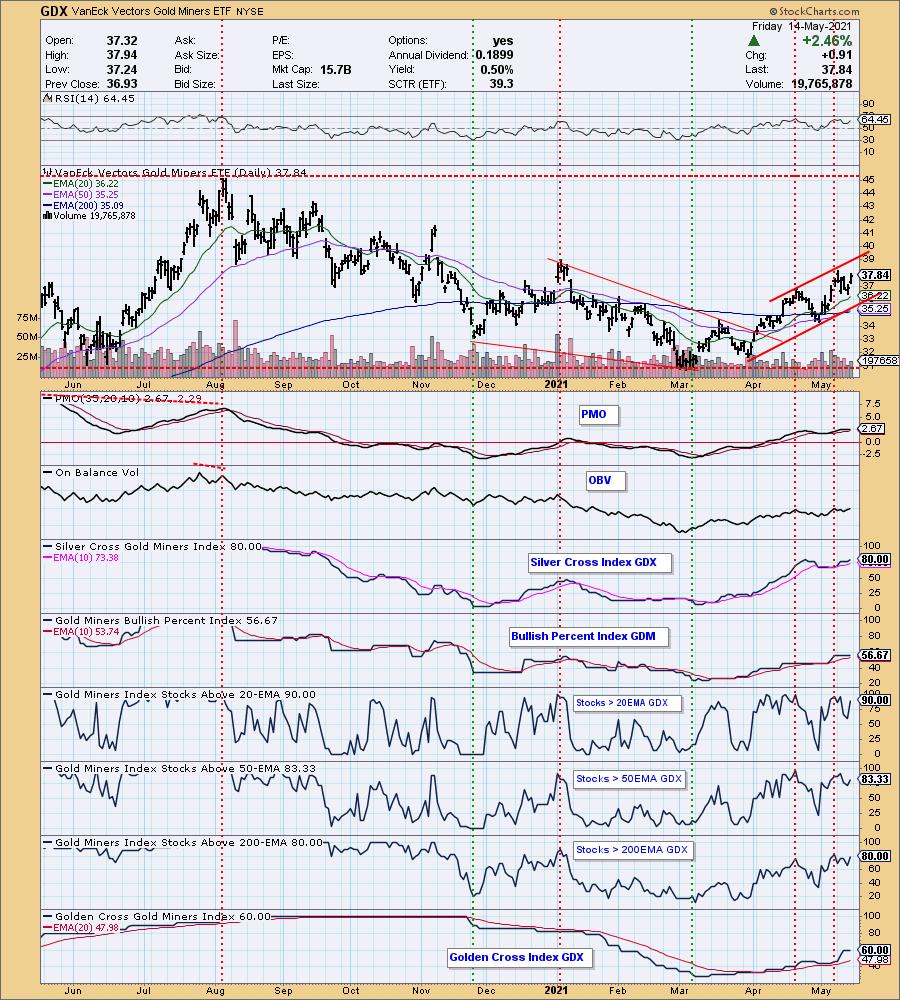
GOLD MINERS Golden and Silver Cross Indexes: Miners rebounded alongside Gold today. The PMO BUY signal was in jeopardy, but it held strong above its signal line. The RSI is positive and participation is improving beneath the surface.
CRUDE OIL (USO)
IT Trend Model: BUY as of 11/23/2020
LT Trend Model: BUY as of 3/9/2021
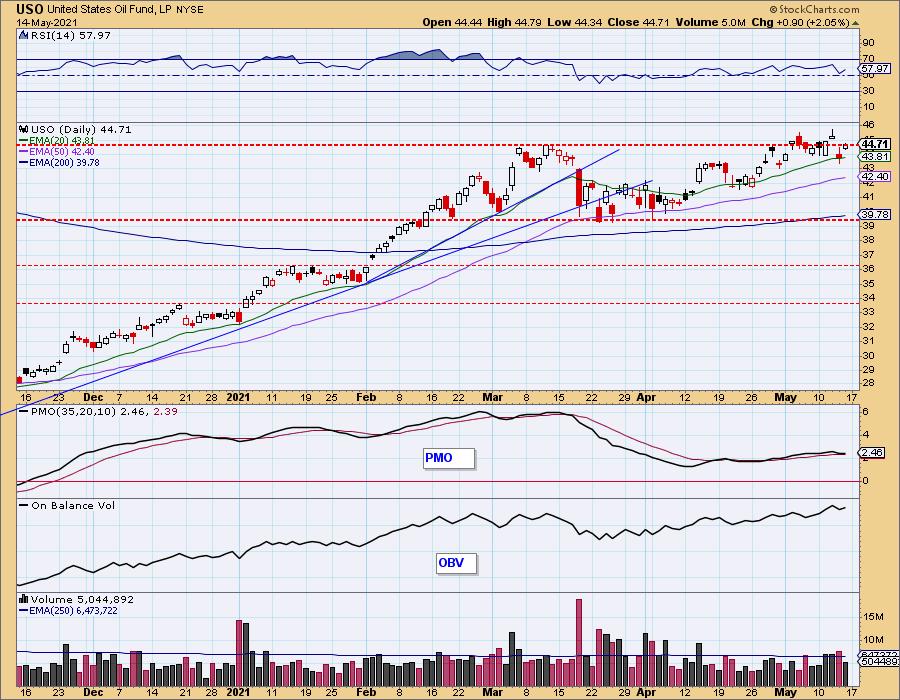
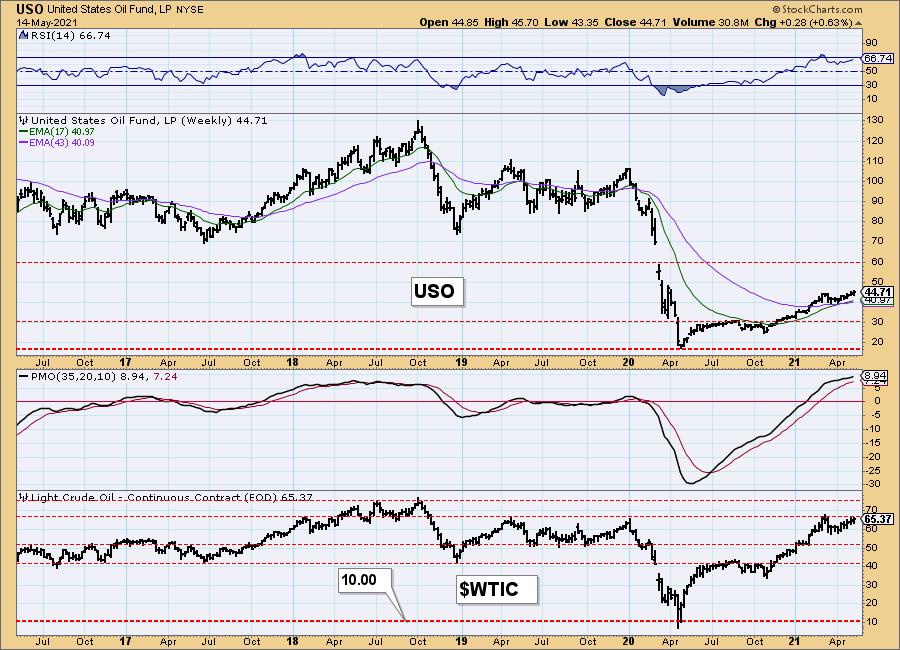
USO Daily Chart: USO continues to muck around resistance/support at the March top. The RSI remains positive and the PMO has so far avoided a crossover SELL signal.
On the one-year chart we can see that despite the choppy trading, it is moving within a rising trend channel.
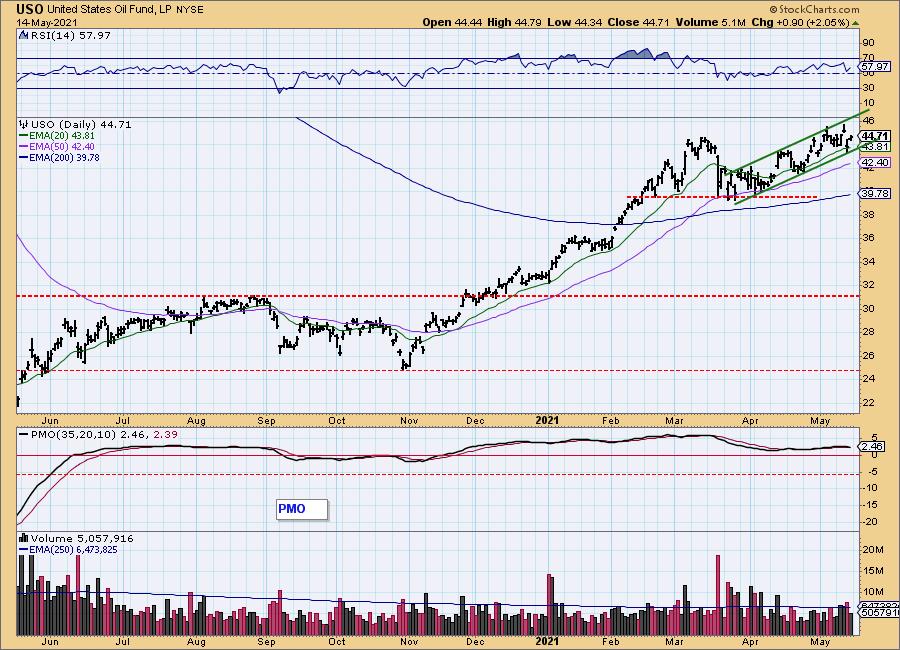
USO/$WTIC Weekly Chart: USO and Gold were the only two on our Market Summary to finish the week in positive territory. Right now $WTIC is struggling to get above overhead resistance. Given USO has broken above it and we have both a positive RSI and weekly PMO, we expect $WTIC to breakout too.
BONDS (TLT)
IT Trend Model: NEUTRAL as of 8/27/2020
LT Trend Model: SELL as of 1/8/2021
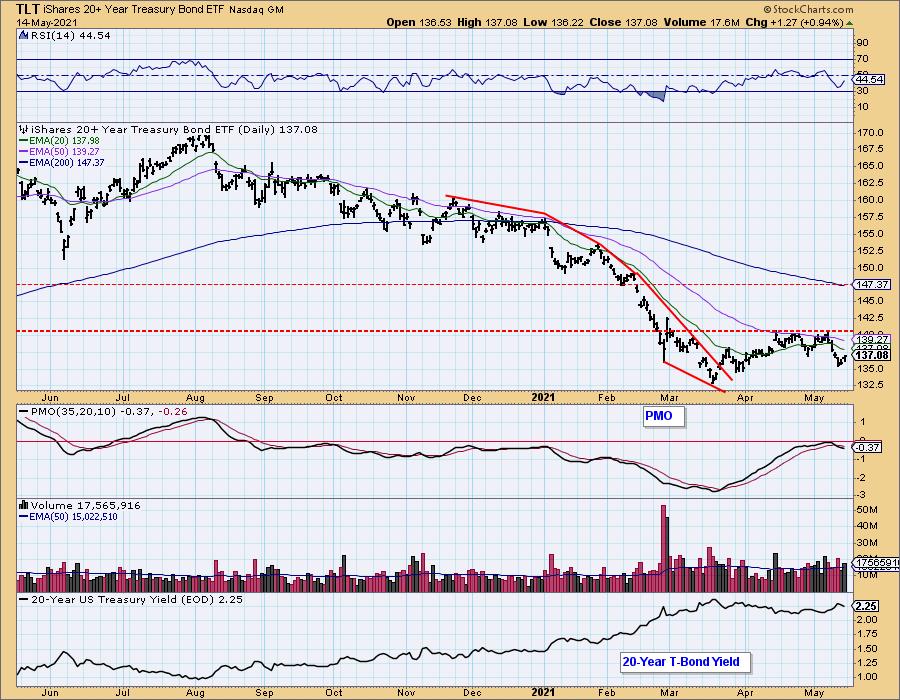
TLT Daily Chart: This week price executed the bearish triple-top pattern. The minimum downside target is right at the March low. Although we did see TLT rally yesterday and today, price was held up at the confirmation line.
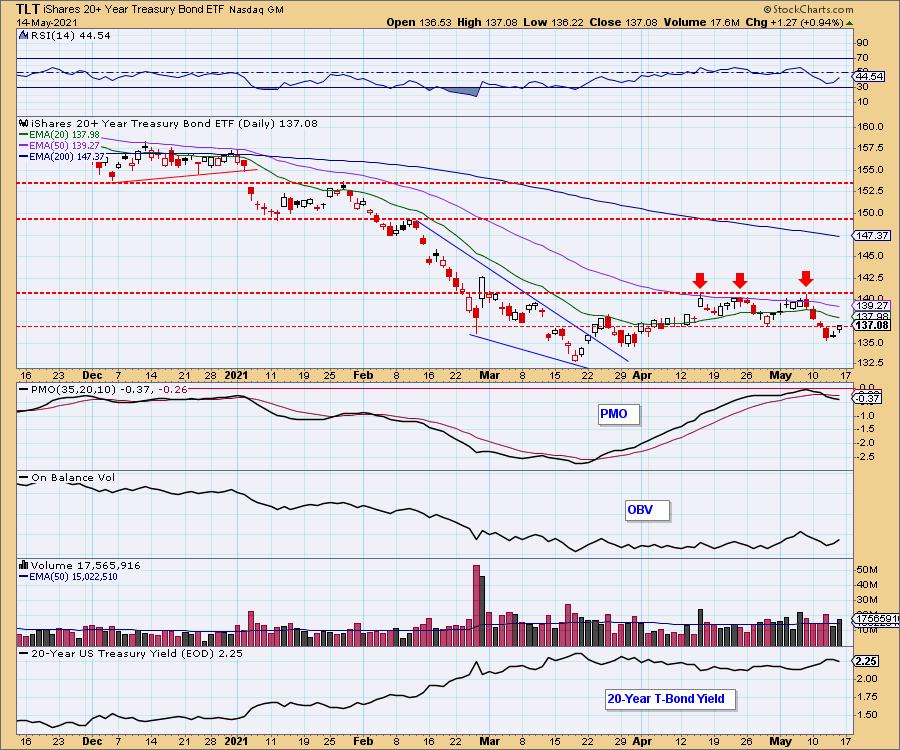
The RSI is rising, but is still firmly ensconced in negative territory. The PMO is still declining on a crossover SELL signal that was generated below the zero line. It isn't likely we will see a break back above the April low.
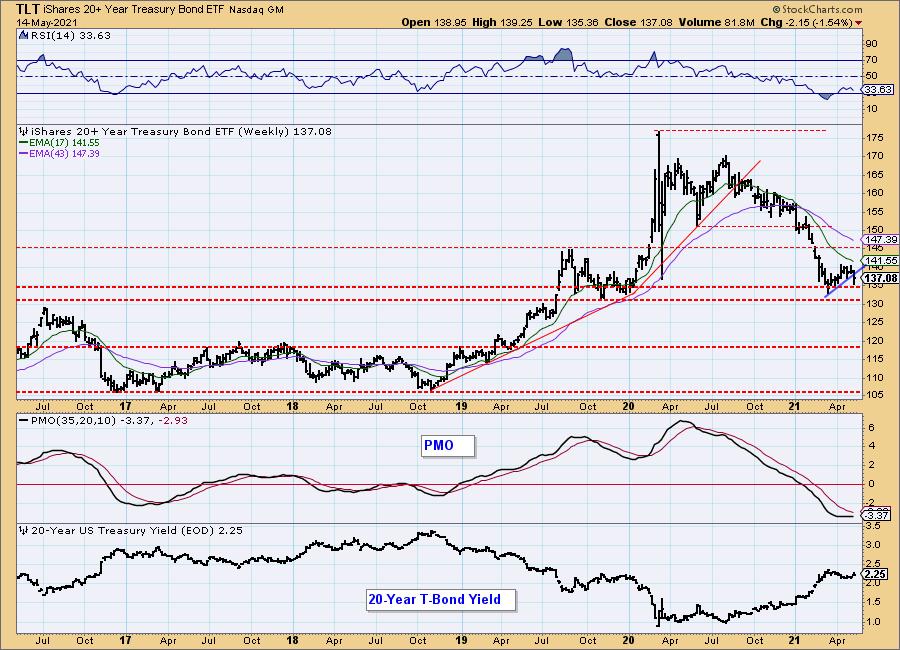
TLT Weekly Chart: The weekly chart is somewhat bearish. The PMO has flattened and price is sitting on top of a strong support zone. However, the weekly RSI has turned down in negative territory and is not oversold yet. This could turn out to be a reversal point, but this week's destruction of the rising trend makes it doubtful.
Technical Analysis is a windsock, not a crystal ball.
-- Carl & Erin Swenlin
Disclaimer: This blog is for educational purposes only and should not be construed as financial advice. The ideas and strategies should never be used without first assessing your own personal and financial situation, or without consulting a financial professional. Any opinions expressed herein are solely those of the author, and do not in any way represent the views or opinions of any other person or entity.
NOTE: The signal status reported herein is based upon mechanical trading model signals, specifically, the DecisionPoint Trend Model. They define the implied bias of the price index based upon moving average relationships, but they do not necessarily call for a specific action. They are information flags that should prompt chart review. Further, they do not call for continuous buying or selling during the life of the signal. For example, a BUY signal will probably (but not necessarily) return the best results if action is taken soon after the signal is generated. Additional opportunities for buying may be found as price zigzags higher, but the trader must look for optimum entry points. Conversely, exit points to preserve gains (or minimize losses) may be evident before the model mechanically closes the signal.
Helpful DecisionPoint Links:
DecisionPoint Alert Chart List
DecisionPoint Golden Cross/Silver Cross Index Chart List
DecisionPoint Sector Chart List
Price Momentum Oscillator (PMO)
Swenlin Trading Oscillators (STO-B and STO-V)
DecisionPoint is not a registered investment advisor. Investment and trading decisions are solely your responsibility. DecisionPoint newsletters, blogs or website materials should NOT be interpreted as a recommendation or solicitation to buy or sell any security or to take any specific action.