
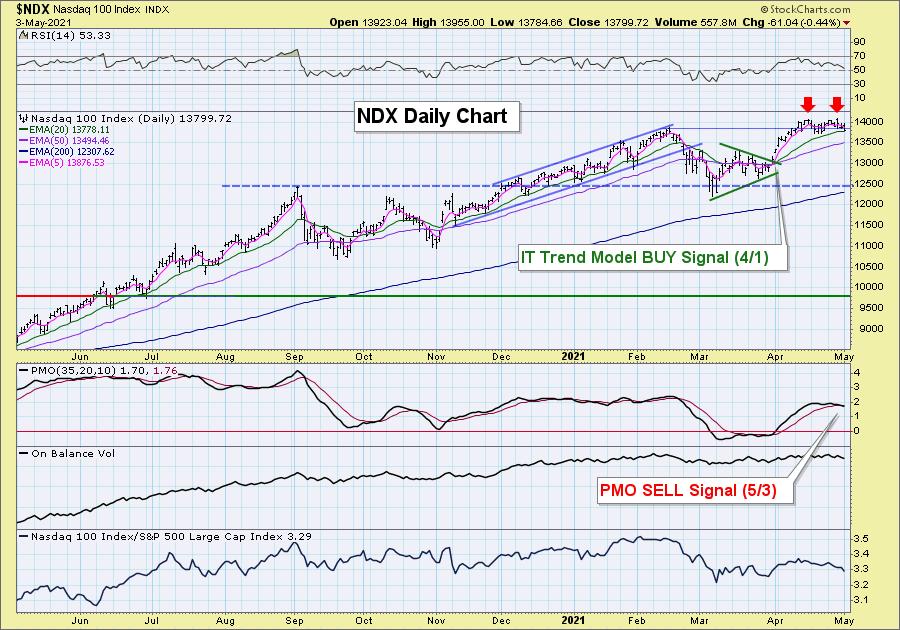
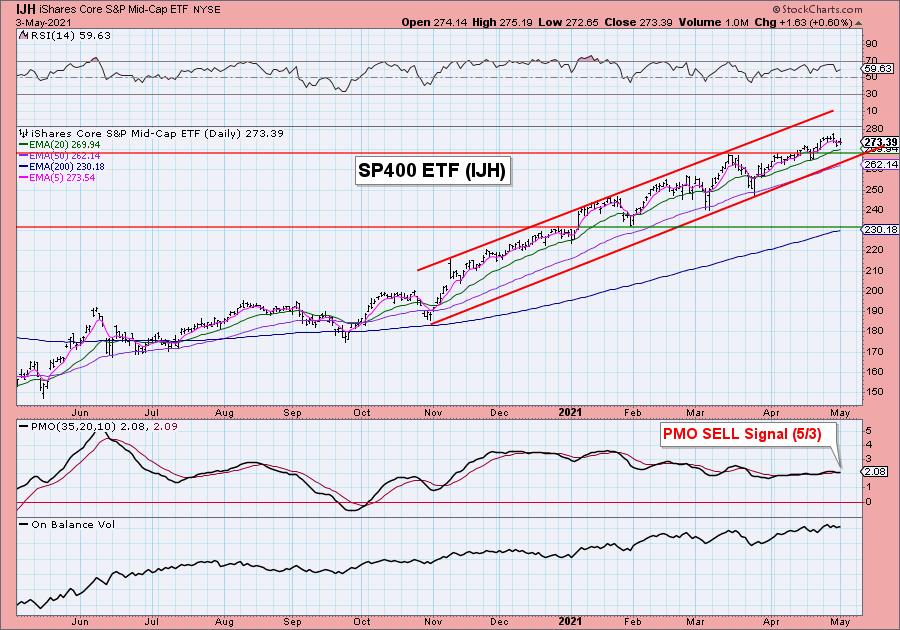
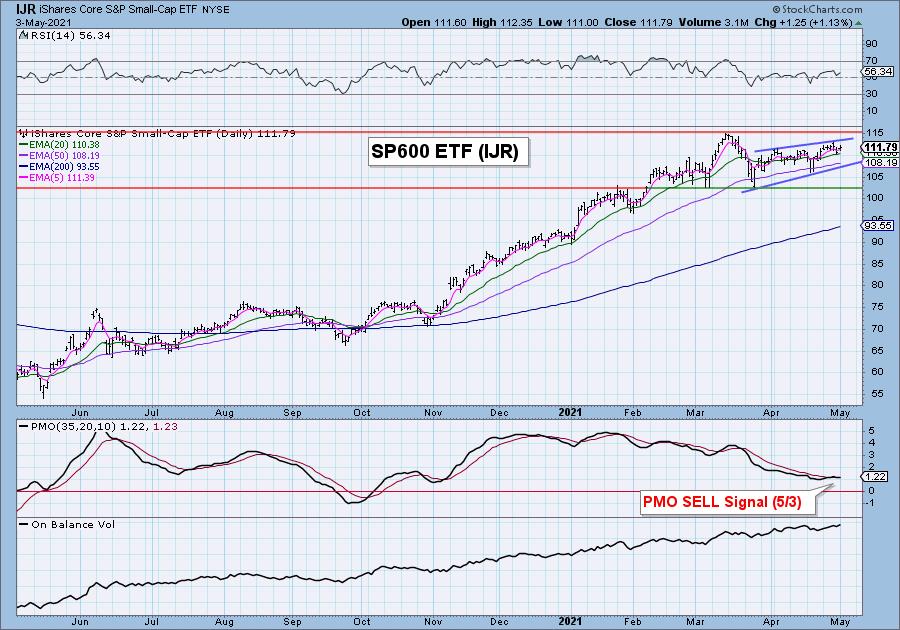
The broad markets finished the day higher, but that didn't prevent the Price Momentum Oscillator (PMO) from triggering new crossover SELL signals. Below is a look at the NDX, OEX, SP400 (IJH) and SP600 (IJR).
The NDX is now sporting a double-top formation. A drop below the 20-EMA and the confirmation line and we should expect at least a pullback.
Like the SPX, the OEX is traveling in a rising trend channel. Even though all-time highs were hit, price was unable to test the top of the rising trend channel.

IJH is getting ready to test support at the 20-EMA and March top.
IJR is inside a short-term bearish rising wedge. The expectation is a breakdown.
The DecisionPoint Alert Weekly Wrap presents an end-of-week assessment of the trend and condition of the Stock Market, the U.S. Dollar, Gold, Crude Oil, and Bonds. The DecisionPoint Alert daily report (Monday through Thursday) is abbreviated and gives updates on the Weekly Wrap assessments.
Watch the latest episode of DecisionPoint on StockChartsTV.com and YouTube here!
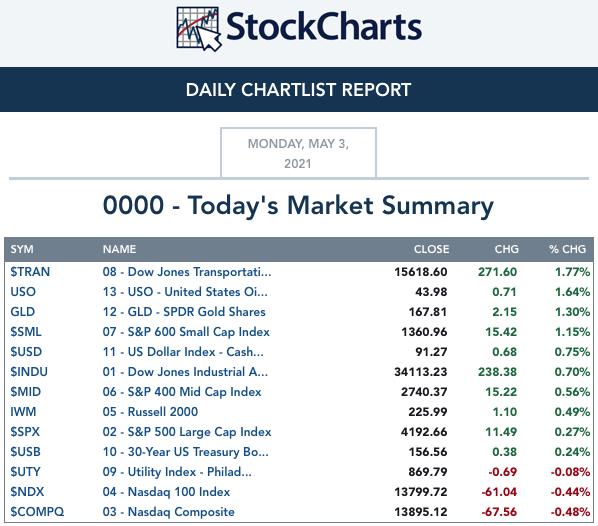
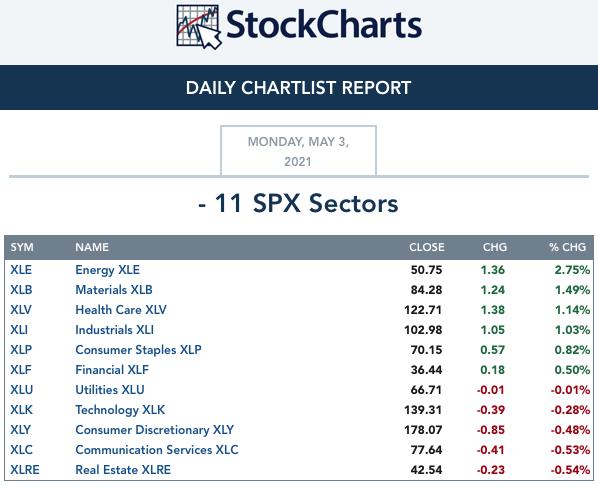
MAJOR MARKET INDEXES
SECTORS
Each S&P 500 Index component stock is assigned to one, and only one, of 11 major sectors. This is a snapshot of the Intermediate-Term (Silver Cross) and Long-Term (Golden Cross) Trend Model signal status for those sectors.
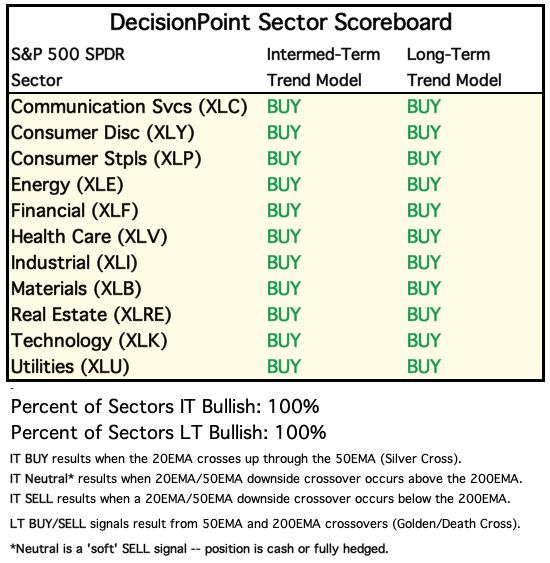
CLICK HERE for Carl's annotated Sector charts.
THE MARKET (S&P 500)
IT Trend Model: BUY as of 5/8/2020
LT Trend Model: BUY as of 6/8/2020
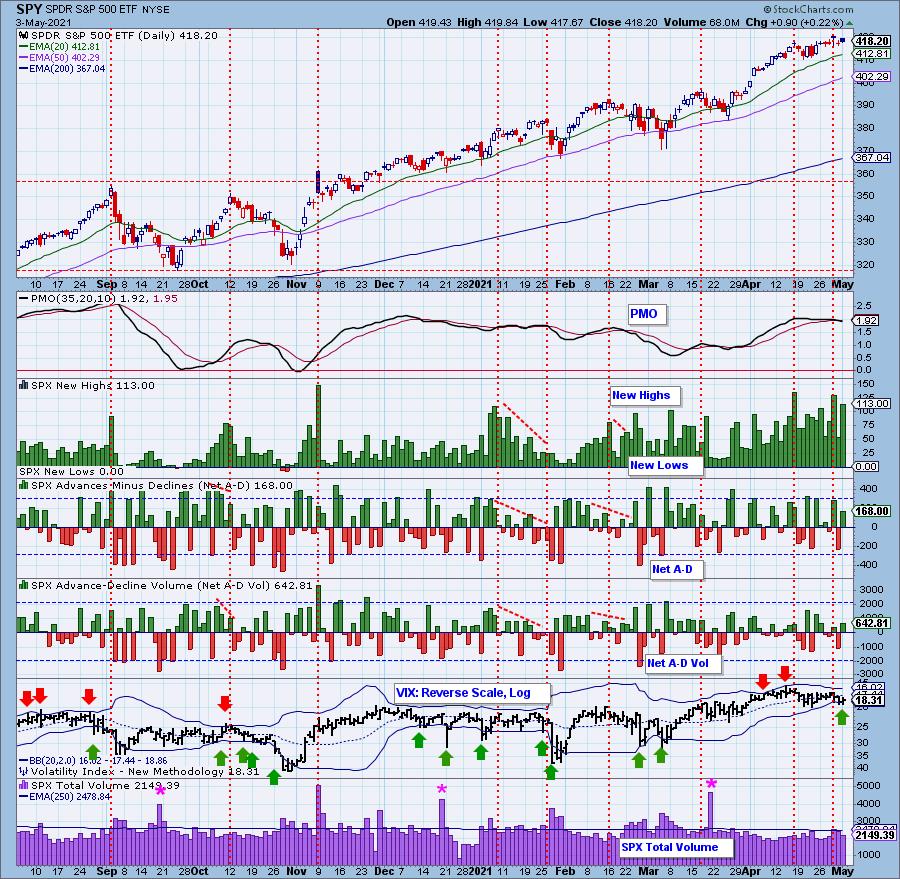
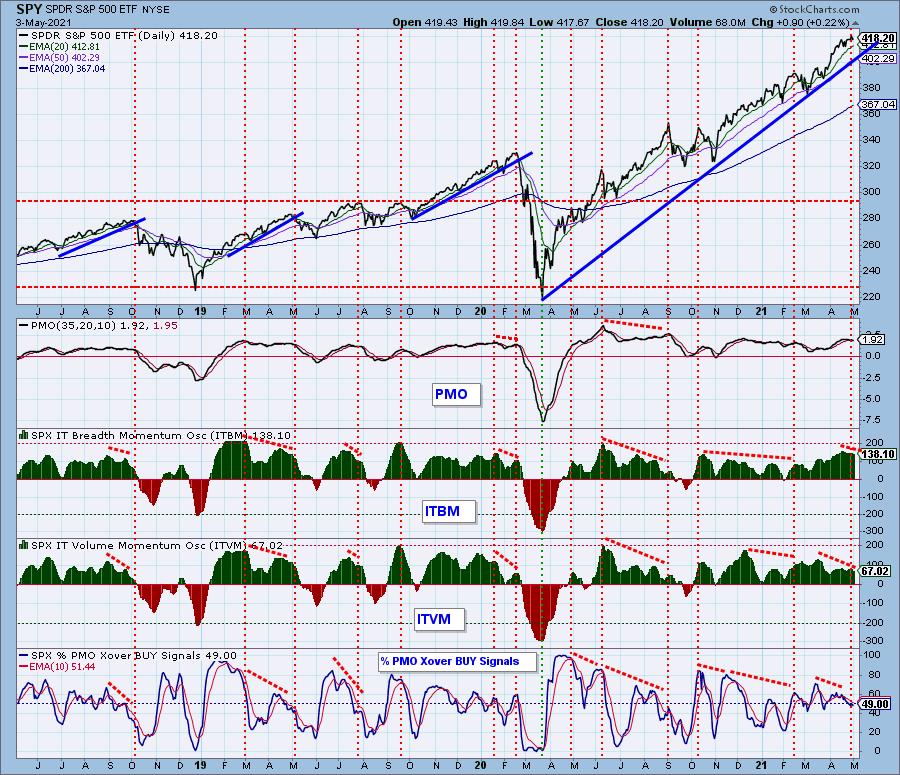
SPY Daily Chart: No new all-time highs today and like the indexes above, the SPX also triggered a PMO crossover SELL signal. The OBV is still showing a declining trend. Total volume contracted on today's rally, but not enough to be especially meaningful. The VIX punctured the lower Bollinger Band on the inverted scale again. I'll talk more about that in the climax indicator section.
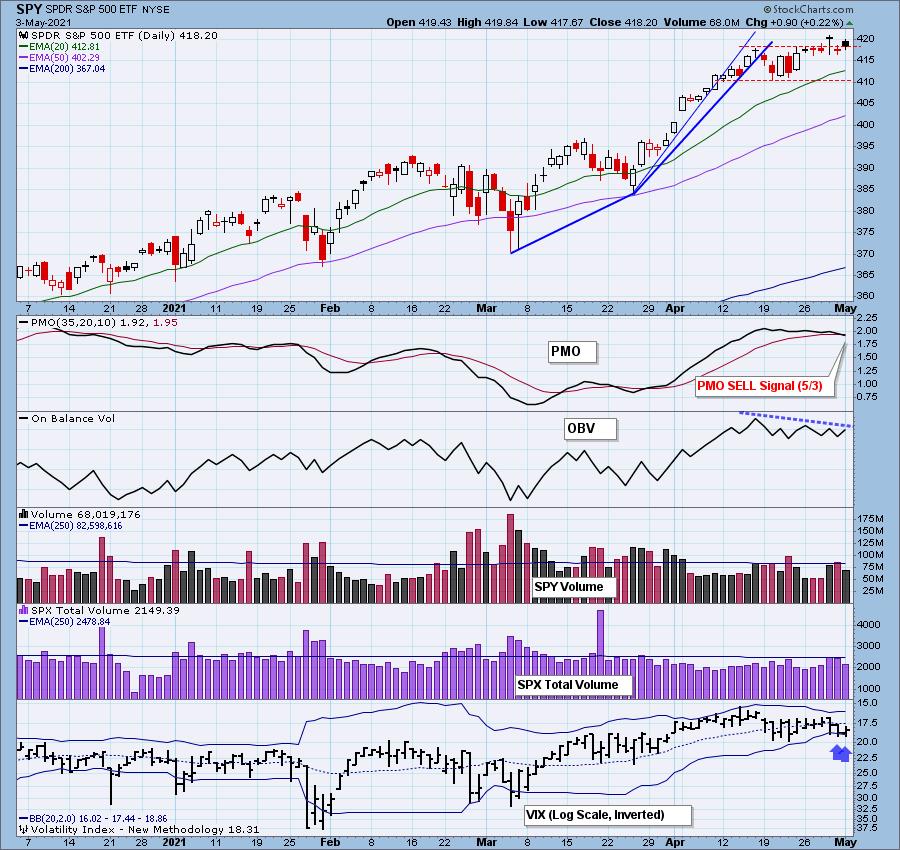
The SPY is now moving away from the top of the rising trend channel. The RSI is still positive, but with little price movement the past week, that is to be expected.
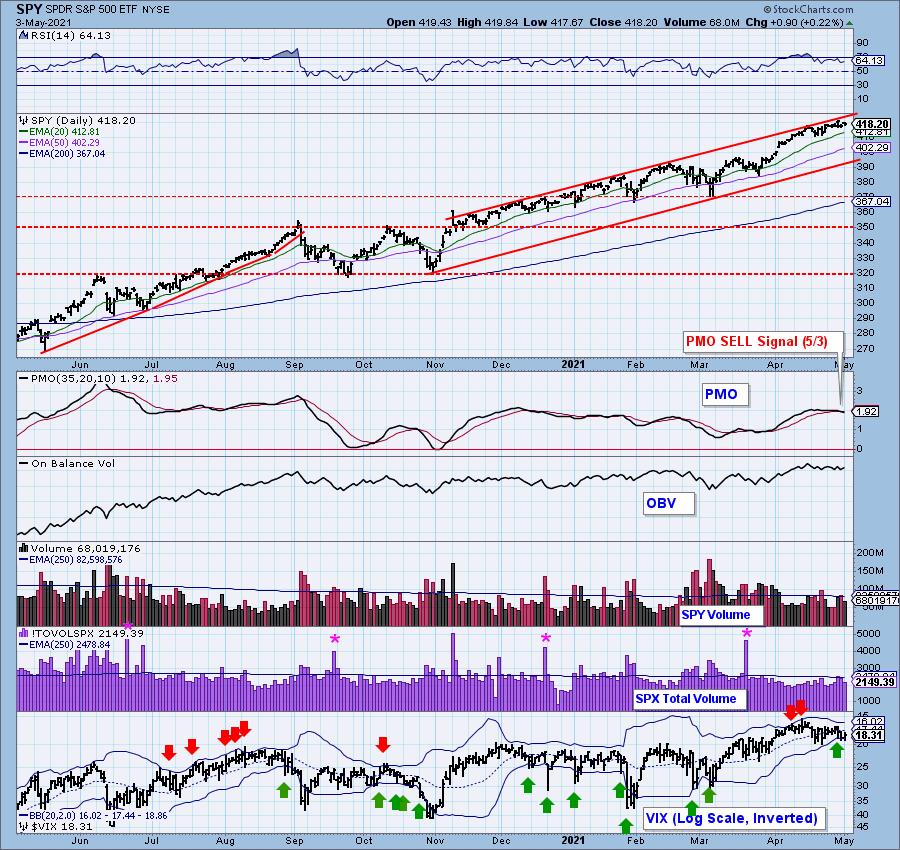

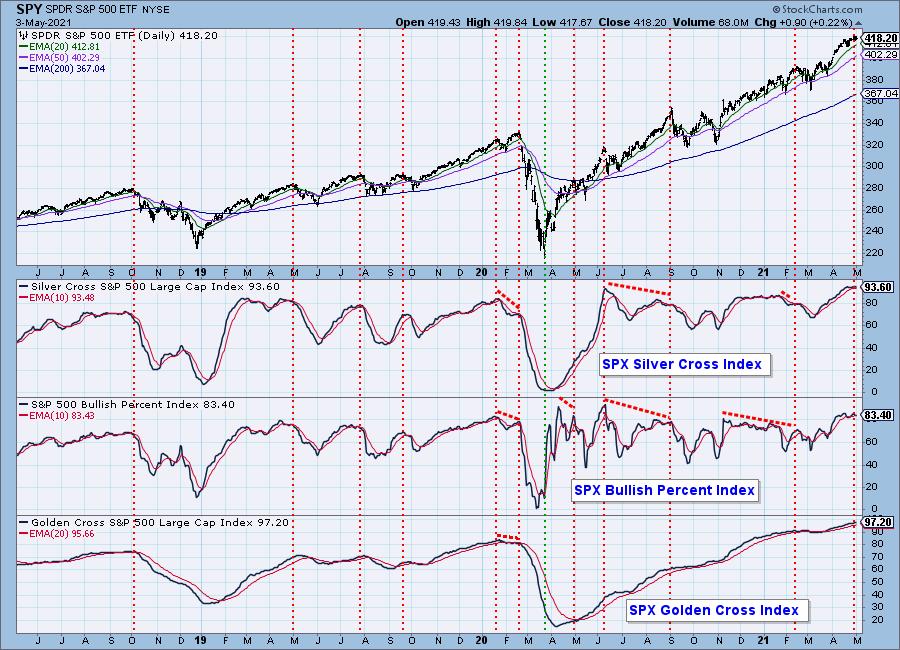
Participation: The following chart uses different methodologies for objectively showing the depth and trend of participation for intermediate- and long-term time frames.
- The Silver Cross Index (SCI) shows the percentage of SPX stocks on IT Trend Model BUY signals (20-EMA > 50-EMA).
- The Golden Cross Index (GCI) shows the percentage of SPX stocks on LT Trend Model BUY signals (50-EMA > 200-EMA).
- The Bullish Percent Index (BPI) shows the percentage of SPX stocks on Point & Figure BUY signals.
The GCI was unchanged from Friday. That 97% reading tells us that only about 12 - 15 stocks do NOT have their 50-EMA above the 200-EMA. Of 500 stocks...only 12-15? If this isn't an overbought reading, what is? The BPI turned down and had a negative crossover. The SCI is headed lower but avoided a negative crossover.
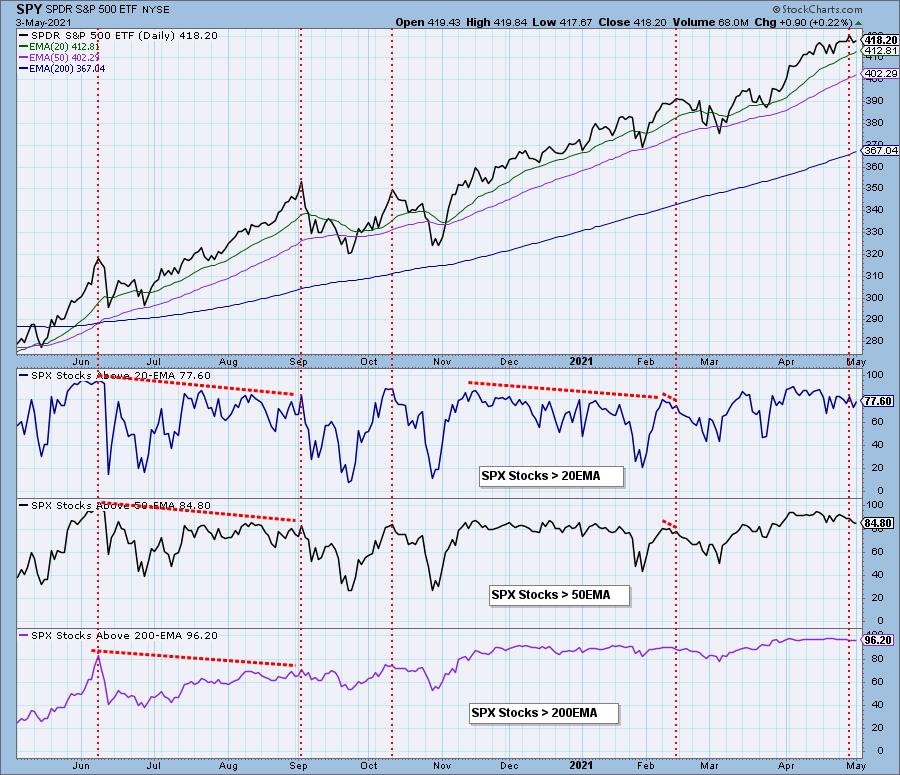
A few more stocks managed to get above their 20-EMA, but we saw a handful of stocks lose support at the 50-EMA. Nearly all stocks have price above their 200-EMA which isn't surprising given the GCI is at 97.4.
Climax Analysis: We did see an expansion of New Highs today which is to be expected. No climactic readings.
The VIX penetrated the lower Bollinger Band on the inverted scale and that typically leads to a day or two of upside movement. However, the squeeze continues on the VIX so these downside penetrations of the lower Bollinger Band on the inverted scale isn't that meaningful.
Keep in mind: When the Bands squeeze it makes any penetration of the Bollinger Bands less useful since it is easy for them to punch through the upper Band one day and immediately puncture the bottom of the Band the next.
A Bollinger Band squeeze also signals that volatility is ahead. The Bands can't remain squeezed together forever and the only way to have them expand is on high volatility. I've never seen a VIX squeeze finish with a powerful thrust to the upside. High volatility is almost always bad.
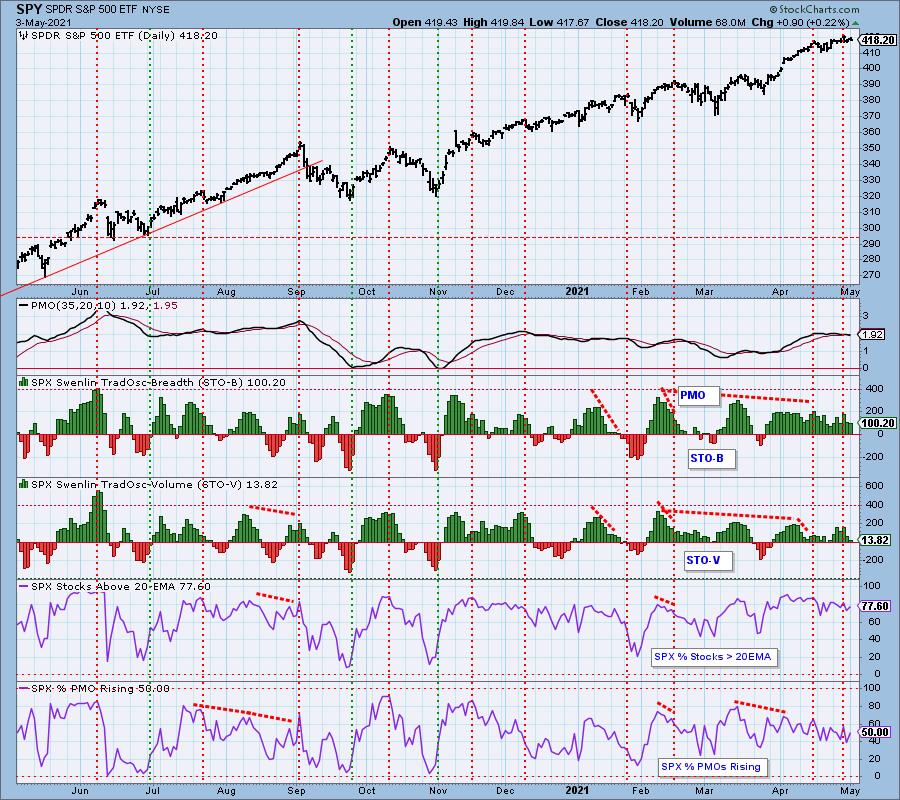
Short-Term Market Indicators: The short-term market trend is UP and the condition is NEUTRAL.
Given the mostly sideways price movement over the past few weeks, the STOs have been twitchy and not as helpful as they usually are. In general, they are in decline and that tells us we should expect a decline soon. Notice that only half of the SPX has positive momentum. It's hard to imagine more all-time highs when only half are moving in the right direction.
Intermediate-Term Market Indicators: The intermediate-term market trend is UP and the condition is OVERBOUGHT. The market bias is BULLISH.
These indicators continue to trend lower even as price moves higher and we have only 49% of stocks that have PMO crossover BUY signals.
CONCLUSION: New PMO SELL signals have hit nearly all of the major indexes today despite higher closes. The SPX is beyond overbought, but then what's new? The indicators are falling and participation is thin. Even though the VIX popped below its lower Bollinger Band on the inverted scale (a usually bullish condition), we can't count on it due to the squeeze of the Bands. For DP Diamonds I track how many bullish scan results I get with my Diamond PMO scan and how many bearish scan results with my Diamond Dog scan. I'm starting to see an expansion in the Dog results and a big contraction in bullish results. The top isn't far away so keep your stops in play!
Have you subscribed the DecisionPoint Diamonds yet? DP does the work for you by providing handpicked stocks/ETFs from exclusive DP scans! Add it with a discount! Contact support@decisionpoint.com for more information!
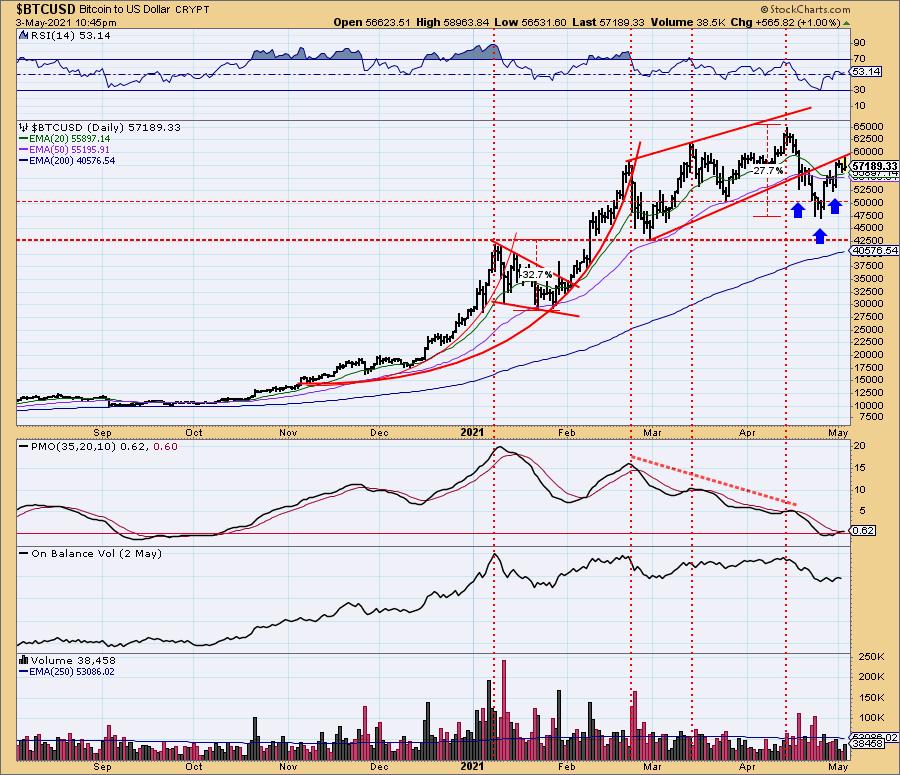
BITCOIN
Just when you thought Bitcoin was out of the game, it formed a reverse head and shoulders and is sitting above the confirmation line. The pattern would suggest we will see new all-time highs. The PMO is in agreement.
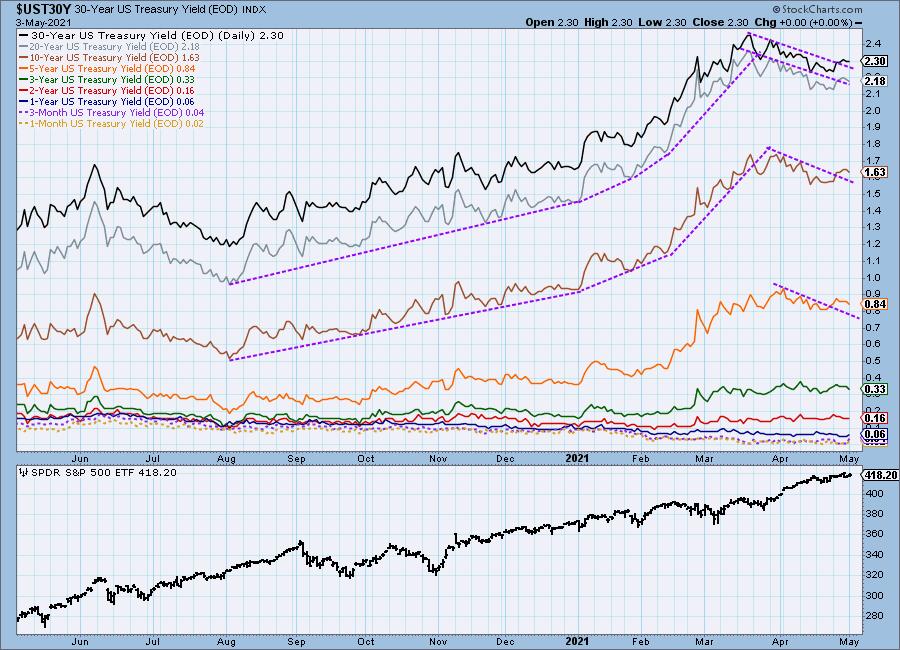
INTEREST RATES
Long-term rates had begun to break their declining trends. We're seeing them pullback again, but we don't think this will continue.
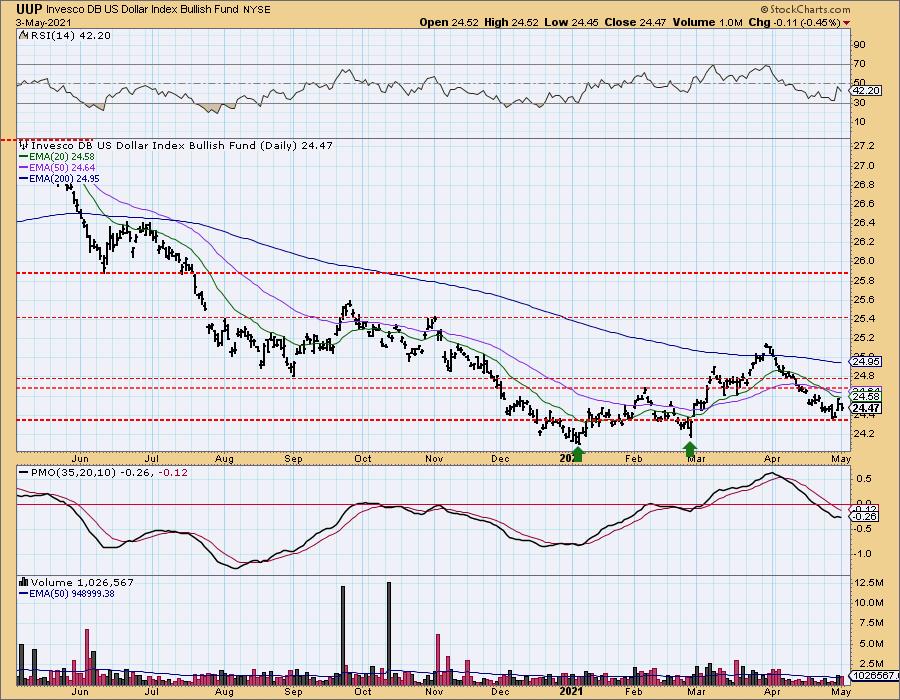
DOLLAR (UUP)
IT Trend Model: SELL as of 4/26/2021
LT Trend Model: SELL as of 7/10/2020
UUP Daily Chart: UUP declined after unsuccessfully testing overhead resistance at the 20-EMA and March lows. The RSI turned down in negative territory and the PMO actually ticked down slightly today. We suspect that this was a bit of a dead cat bounce.
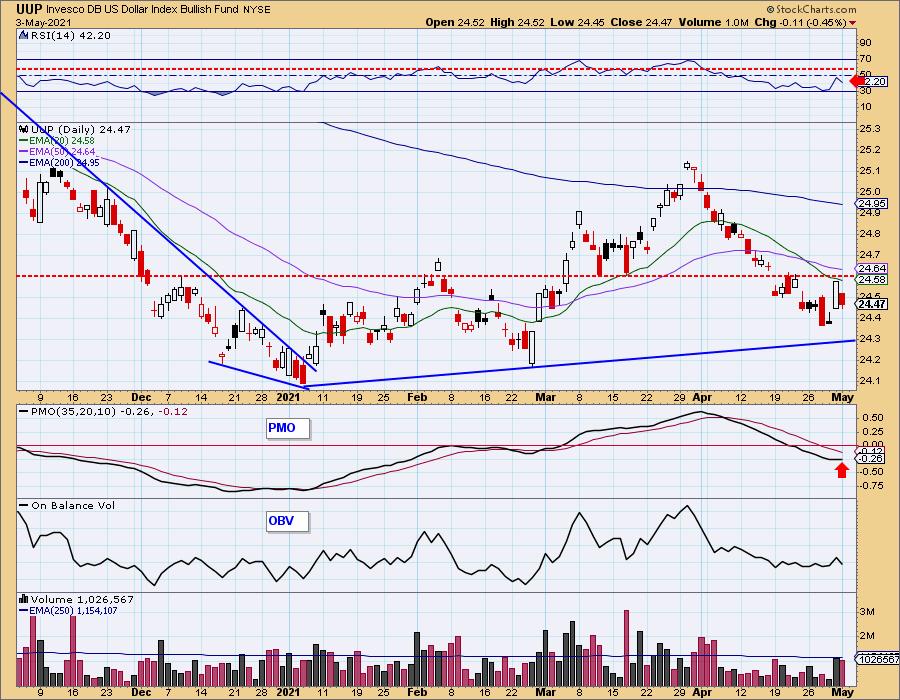
$24.40 will likely be tested again soon.
GOLD
IT Trend Model: BUY as of 5/3/2021
LT Trend Model: SELL as of 3/4/2021
GLD Daily Chart: After breaking down out of the bearish rising wedge, Gold bounced strongly. Today we had a new IT Trend Model "Silver Cross" BUY signal. The 200-EMA is the next test.
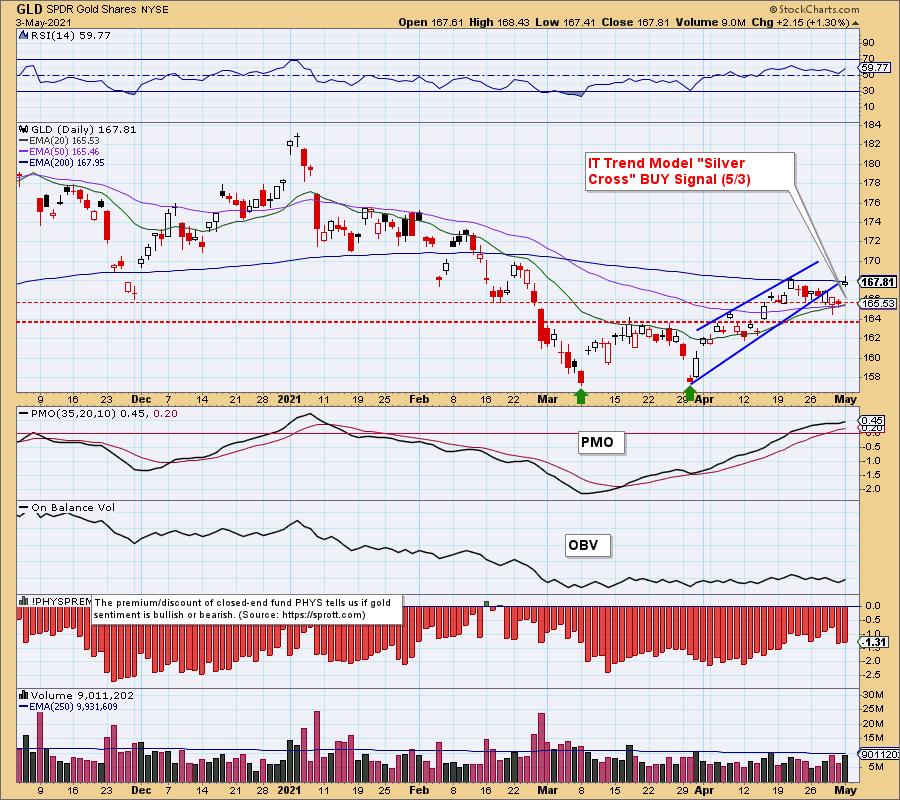
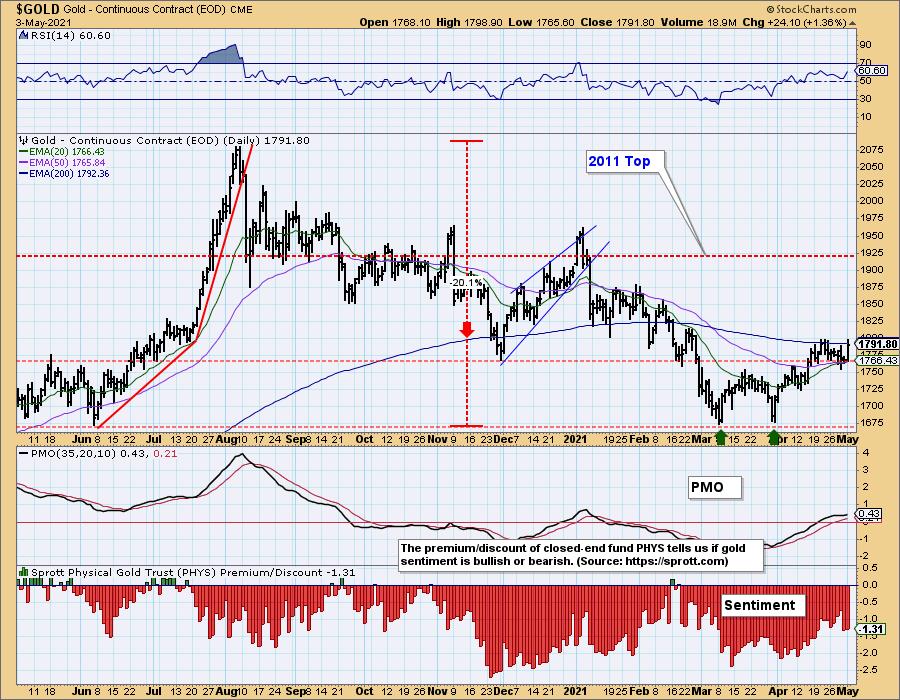
The PMO has bottomed above its signal line which is especially bullish. However, Gold has failed here before and the spike in the PHYS Discount does tell us that participants are bearish. Usually this is a good thing since sentiment is contrarian, but as you can see these discounts are really climactic. Given the RSI is positive, the PMO is rising on a BUY signal and the "Silver Cross", we do expect Gold to push past the 200-EMA.
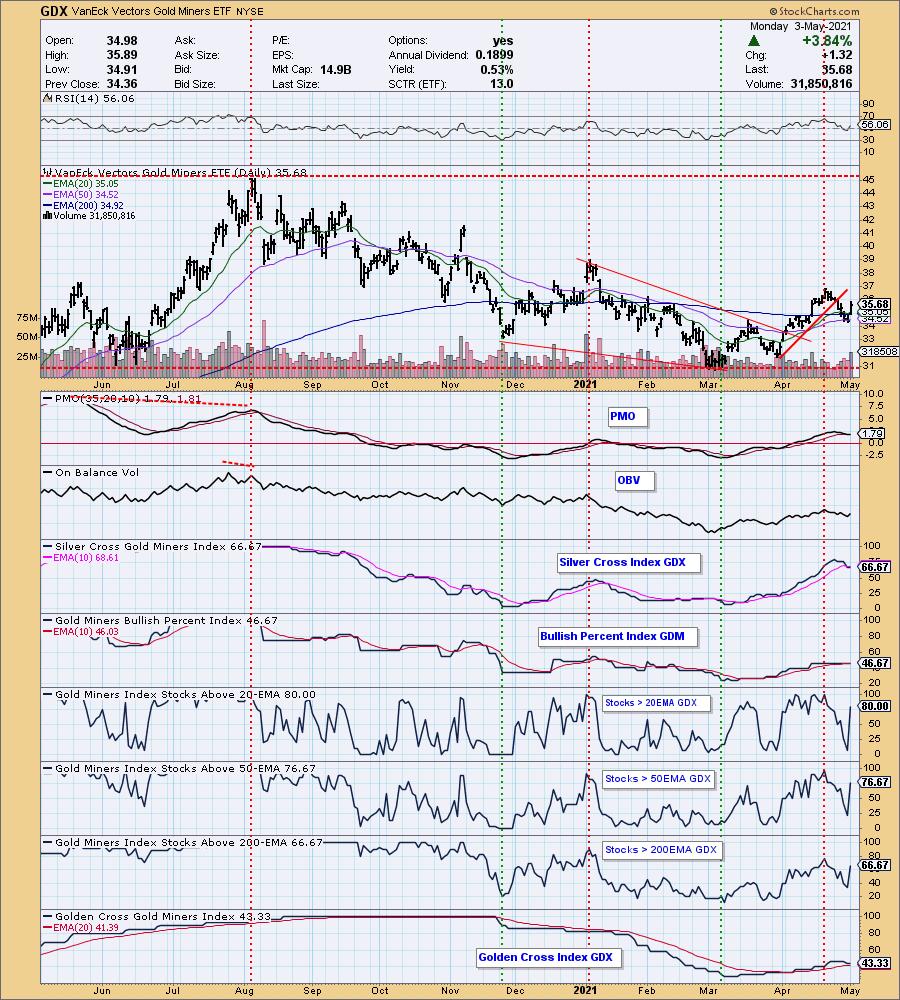
GOLD MINERS Golden and Silver Cross Indexes: A rally in Gold certainly helped the Gold Miners. I really like this bounce off the 20/50/200-EMAs. The PMO did give us a crossover SELL signal, so I have to temper my enthusiasm a bit. However, the marked improvement in participation keeps me bullish on GDX. (Full Disclosure: I own GDXJ)
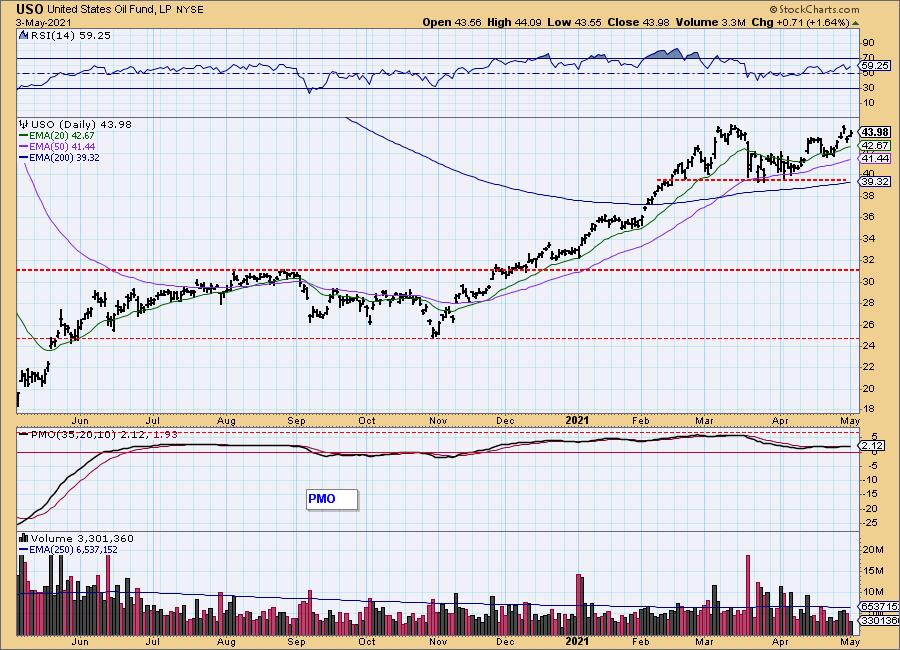
CRUDE OIL (USO)
IT Trend Model: BUY as of 11/23/2020
LT Trend Model: BUY as of 3/9/2021
USO Daily Chart: Crude Oil seems very uninterested in breaking from the trading channel. However, the PMO is on a BUY signal, the RSI is positive and the OBV is confirming the rally with rising bottoms.
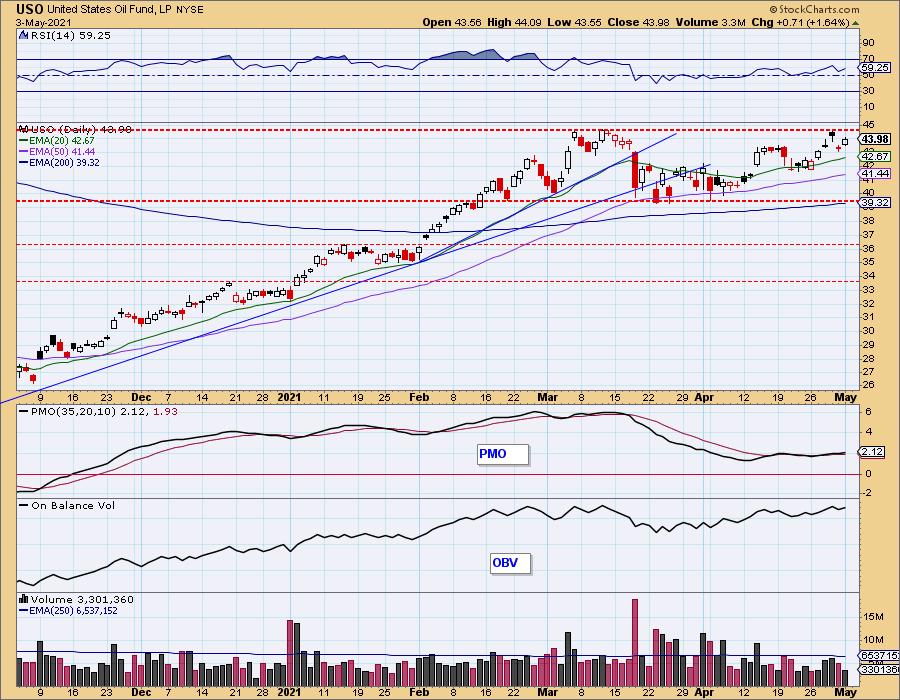
I'm expect to see a breakout soon.
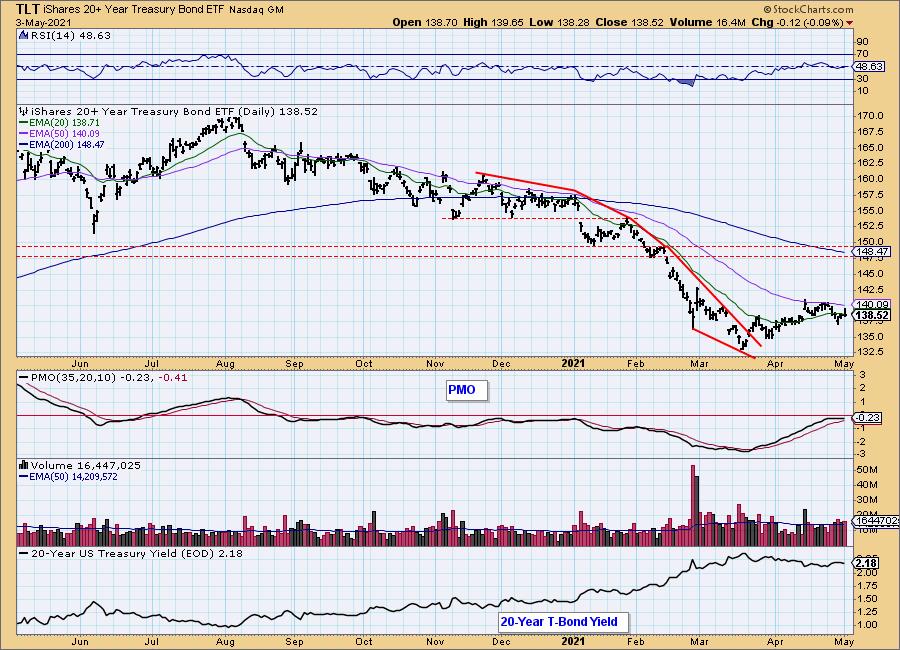
BONDS (TLT)
IT Trend Model: NEUTRAL as of 8/27/2020
LT Trend Model: SELL as of 1/8/2021
TLT Daily Chart: Carl and I believe that yields are going to start back up again and that will put more pressure on TLT. The PMO may look overbought at first glance, but it is actually underneath the zero line still. The PMO is topping and the RSI is floating into negative territory. Price closed below the 20-EMA.
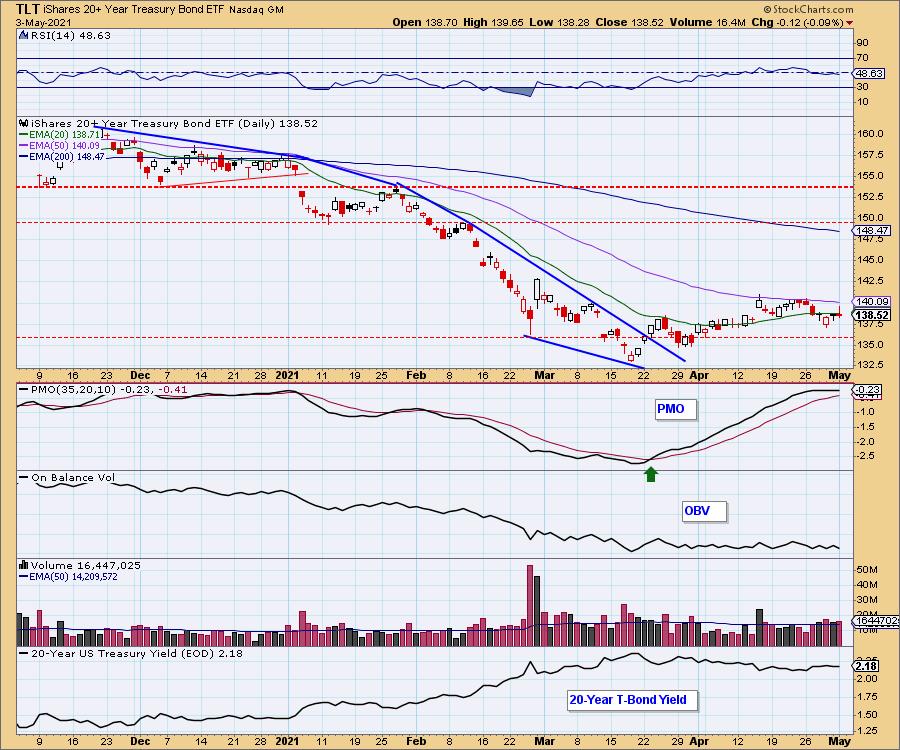
Bonds rallied but the 50-EMA posed difficult resistance. I don't see anything on this chart to suggest price will successfully break above the 50-EMA.
Happy Charting!
Erin Swenlin
Technical Analysis is a windsock, not a crystal ball.
Disclaimer: This blog is for educational purposes only and should not be construed as financial advice. The ideas and strategies should never be used without first assessing your own personal and financial situation, or without consulting a financial professional. Any opinions expressed herein are solely those of the author, and do not in any way represent the views or opinions of any other person or entity.
NOTE: The signal status reported herein is based upon mechanical trading model signals, specifically, the DecisionPoint Trend Model. They define the implied bias of the price index based upon moving average relationships, but they do not necessarily call for a specific action. They are information flags that should prompt chart review. Further, they do not call for continuous buying or selling during the life of the signal. For example, a BUY signal will probably (but not necessarily) return the best results if action is taken soon after the signal is generated. Additional opportunities for buying may be found as price zigzags higher, but the trader must look for optimum entry points. Conversely, exit points to preserve gains (or minimize losses) may be evident before the model mechanically closes the signal.
Helpful DecisionPoint Links:
DecisionPoint Alert Chart List
DecisionPoint Golden Cross/Silver Cross Index Chart List
DecisionPoint Sector Chart List
Price Momentum Oscillator (PMO)
Swenlin Trading Oscillators (STO-B and STO-V)
DecisionPoint is not a registered investment advisor. Investment and trading decisions are solely your responsibility. DecisionPoint newsletters, blogs or website materials should NOT be interpreted as a recommendation or solicitation to buy or sell any security or to take any specific action.