
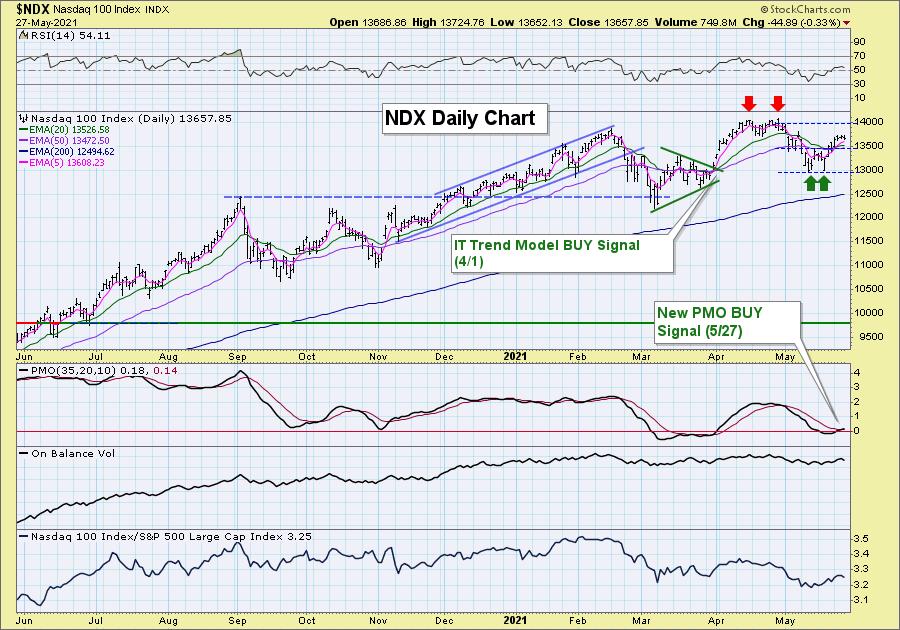
Today the Price Momentum Oscillator (PMO) crossed above its signal line on the Nasdaq 100 ($NDX). The tech heavy NDX is seeing plenty of strength, particularly in Software and Semiconductors. However, we can see it is beginning to consolidate. Given the positive RSI and improved performance against the SPX, I expect to see the NDX test all-time highs right alongside the SPX after it consolidates here.
The DecisionPoint Alert Weekly Wrap presents an end-of-week assessment of the trend and condition of the Stock Market, the U.S. Dollar, Gold, Crude Oil, and Bonds. The DecisionPoint Alert daily report (Monday through Thursday) is abbreviated and gives updates on the Weekly Wrap assessments.
Watch the latest episode of DecisionPoint on StockChartsTV.com and YouTube here!
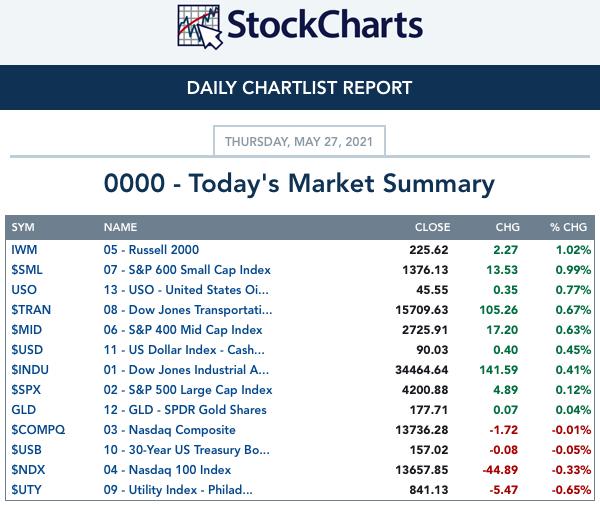
MAJOR MARKET INDEXES
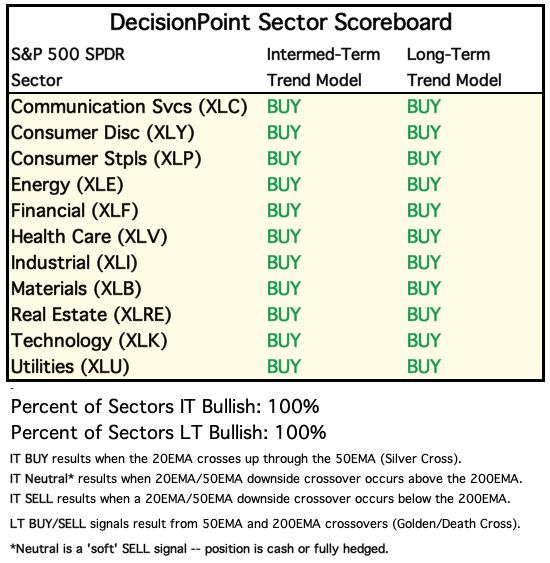
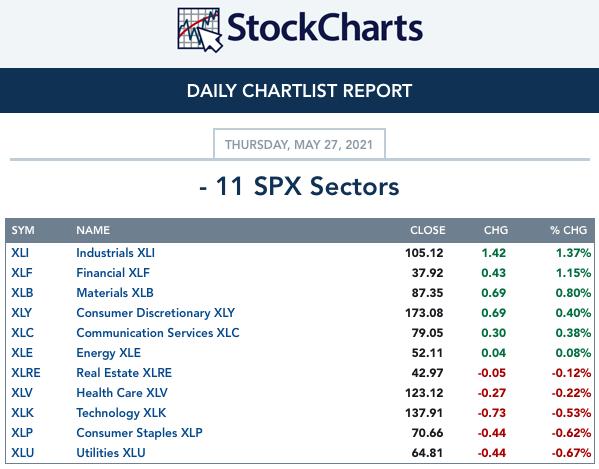
SECTORS
Each S&P 500 Index component stock is assigned to one, and only one, of 11 major sectors. This is a snapshot of the Intermediate-Term (Silver Cross) and Long-Term (Golden Cross) Trend Model signal status for those sectors.
CLICK HERE for Carl's annotated Sector charts.
THE MARKET (S&P 500)
IT Trend Model: BUY as of 5/8/2020
LT Trend Model: BUY as of 6/8/2020
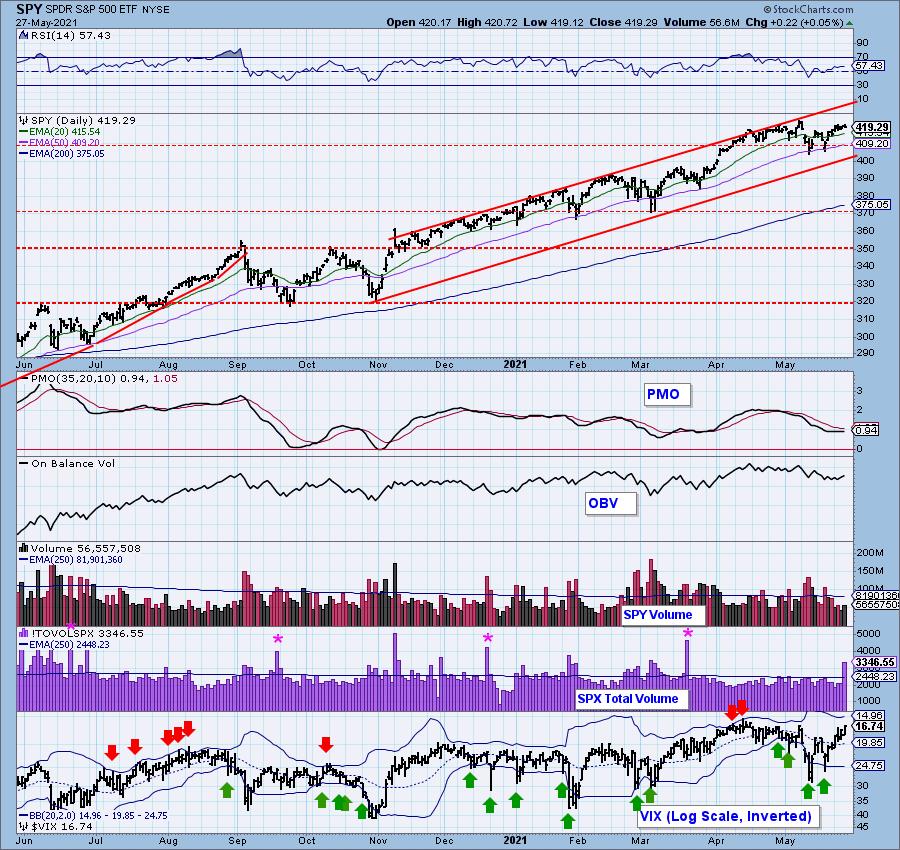
SPY Daily Chart: Price maintained above the confirmation line of the bullish double-bottom. The minimum upside target would take price to new all-time highs and beyond. The PMO has not gotten on board since turning up. It has been flat all week.
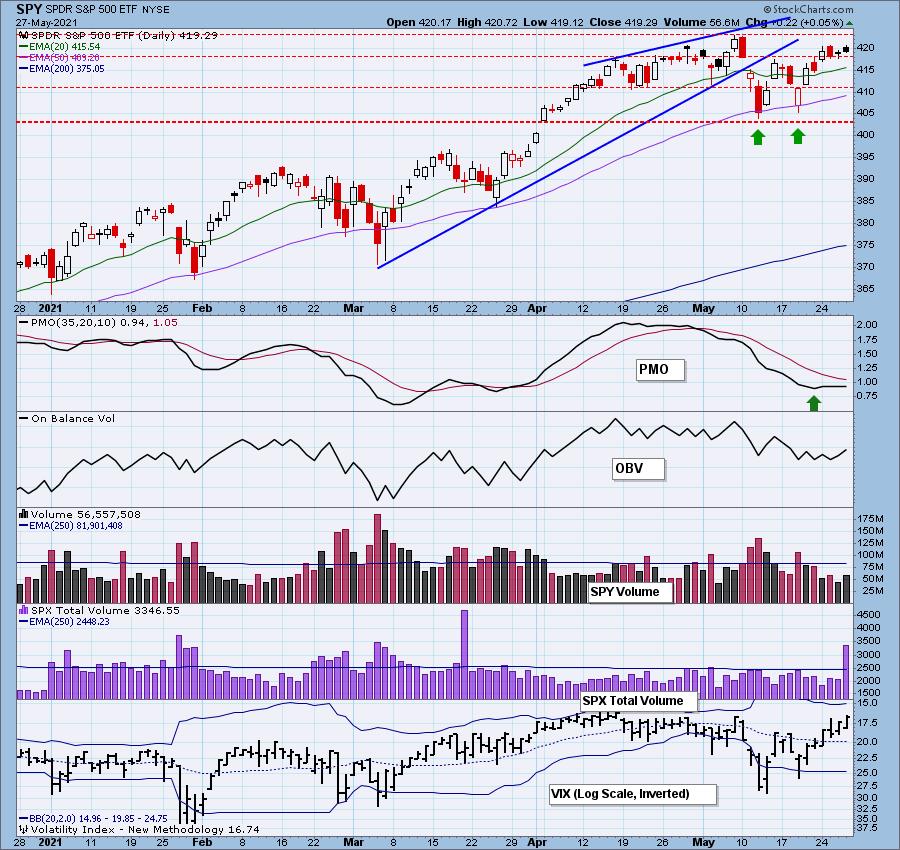
The RSI is still rising in positive territory and is not overbought.

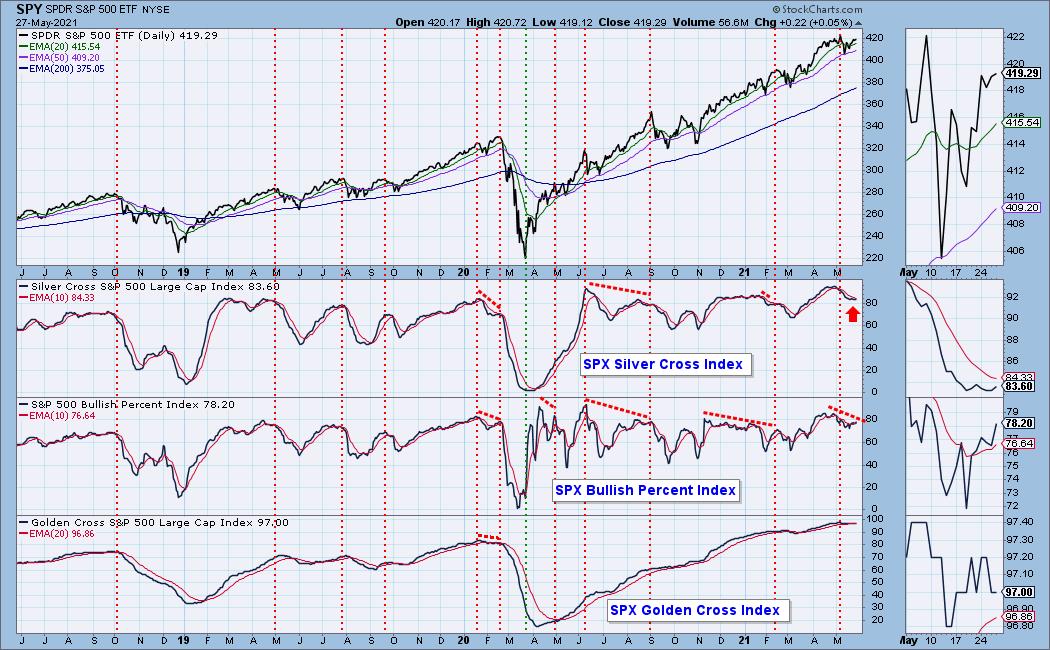
Participation: The following chart uses different methodologies for objectively showing the depth and trend of participation for intermediate- and long-term time frames.
- The Silver Cross Index (SCI) shows the percentage of SPX stocks on IT Trend Model BUY signals (20-EMA > 50-EMA).
- The Golden Cross Index (GCI) shows the percentage of SPX stocks on LT Trend Model BUY signals (50-EMA > 200-EMA).
- The Bullish Percent Index (BPI) shows the percentage of SPX stocks on Point & Figure BUY signals.
I've included the thumbnail to this chart as the direction of the indicators aren't that clear. The GCI is still holding at 97.00, but we saw an increase on the SCI and a bottom above the signal line for the BPI. Readings are overbought, but there is a bit of room for the SCI and BPI to move higher. The GCI is in overbought extremes and has been most of 2021.
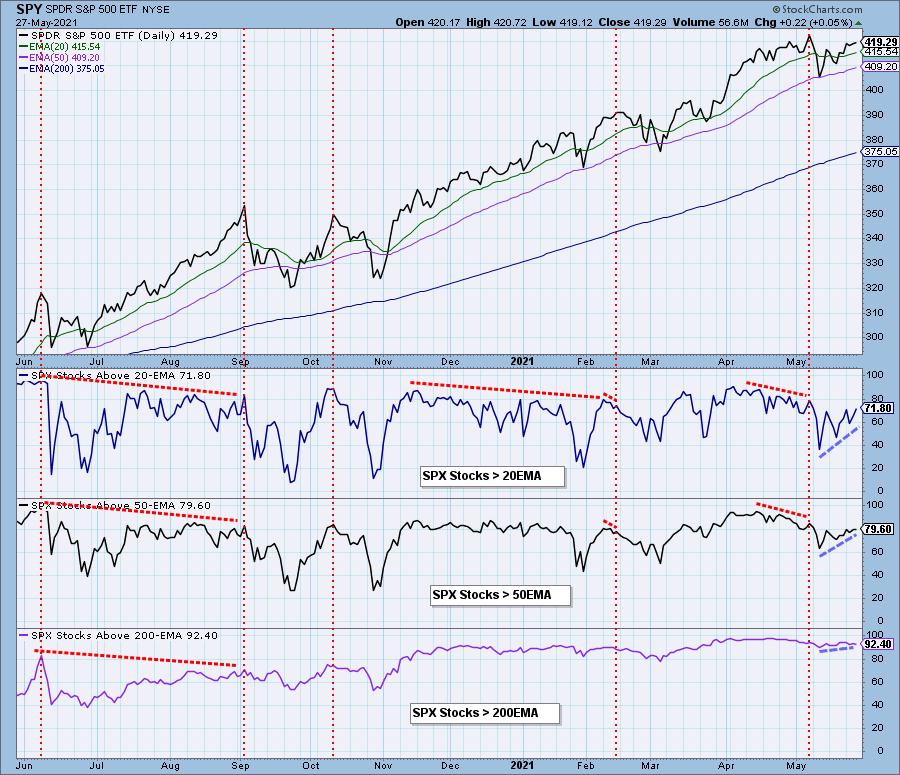
Participation continues to improve. The ST and IT participation numbers aren't really overbought yet and they are trending higher. The long-term participation is in overbought extremes.
Climax Analysis: No climax today, but we did see a large pop in Total Volume. This wasn't accompanied by climactic behavior on Net A-D and Net A-D Volume. The VIX is rising toward the upper Bollinger Band on the inverted scale. Once it penetrates it, that will likely signal the end to the current rally.
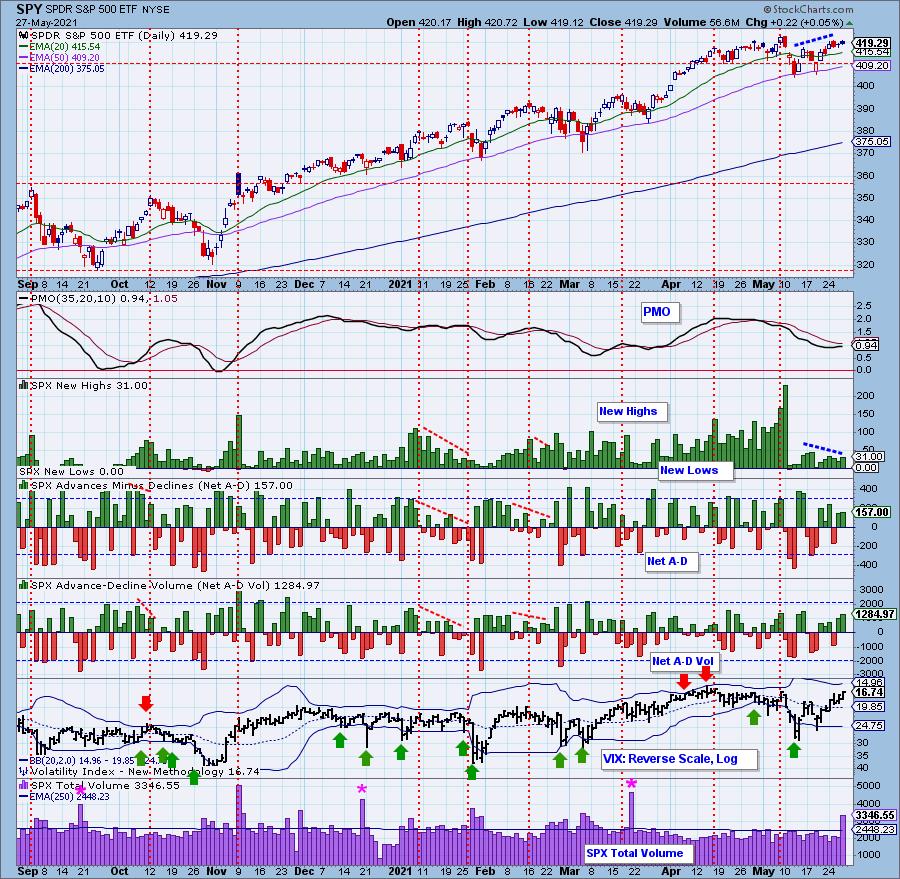
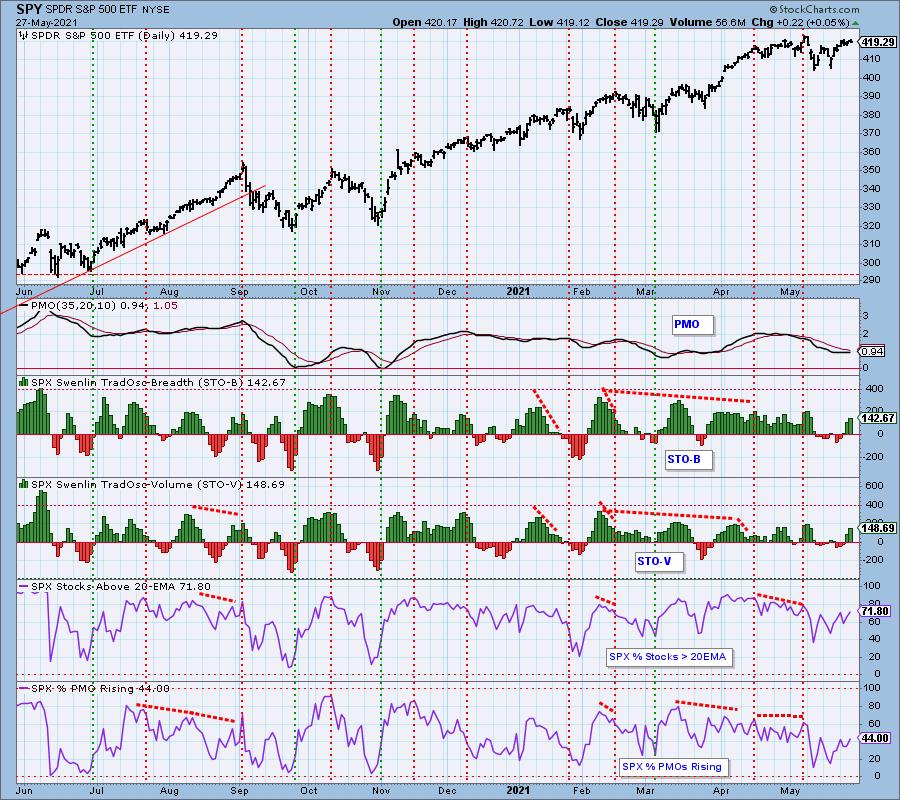
Short-Term Market Indicators: The short-term market trend is UP and the condition is NEUTRAL.
STOs continue to shoot higher, unfortunately that means they will hit overbought territory shortly. For now, they look very bullish. We also see more stocks with rising momentum.
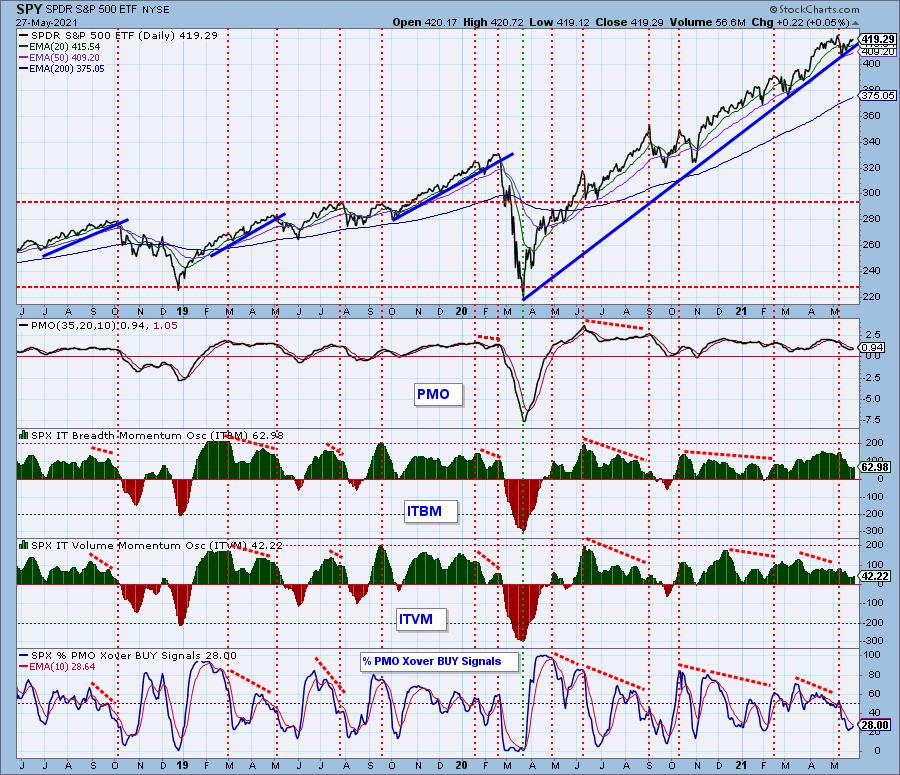
Intermediate-Term Market Indicators: The intermediate-term market trend is UP and the condition is SOMEWHAT OVERBOUGHT. The market bias is BULLISH.
The ITBM/ITVM are both rising in concert now which does make me more bullish in the intermediate term. %PMO BUY signals are certainly oversold and so far it's showing some improvement.
CONCLUSION: There are far more bullish indications on the charts than bearish ones right now. The STOs look great and we are seeing indicators rising from oversold territory. Participation is improving and we did get that new PMO BUY signal on the NDX. When the technology sector performs well, so does the market. Now we watch for short-term indicators to hit overbought territory. That will be our signal to look for a pullback or correction, but right now, we should have smooth sailing. As always, we do recommend using stop losses in case some news item initiates a price shock. Volatility is calming down, but lately the market is vulnerable to a meme or bitcoin news or an economic report...or even a tweet.
Have you subscribed the DecisionPoint Diamonds yet? DP does the work for you by providing handpicked stocks/ETFs from exclusive DP scans! Add it with a discount! Contact support@decisionpoint.com for more information!
BITCOIN
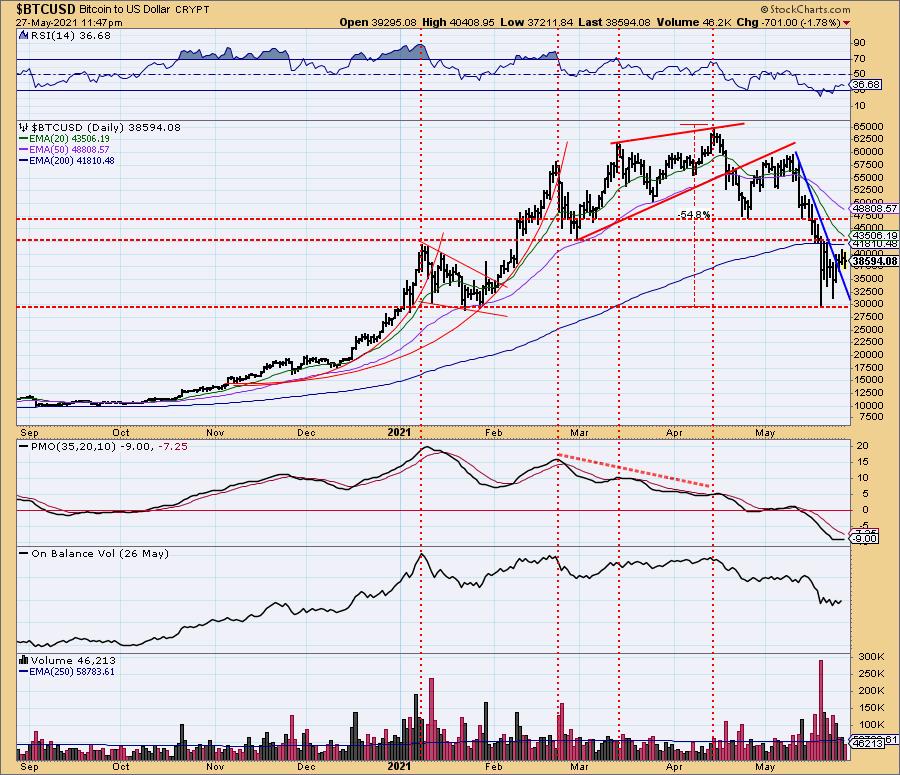
Yesterday's comments still apply:
"The steep declining trendline has been broken, but overhead resistance is still looming at the 200-EMA and January top. I also note that the 20-EMA is coming down to keep the 200-EMA company. That will strengthen that resistance line further. The PMO is flat--not even a 2.27% gain turned it higher. The RSI is negative but rising out of oversold territory. Look for overhead resistance to continue to hold."
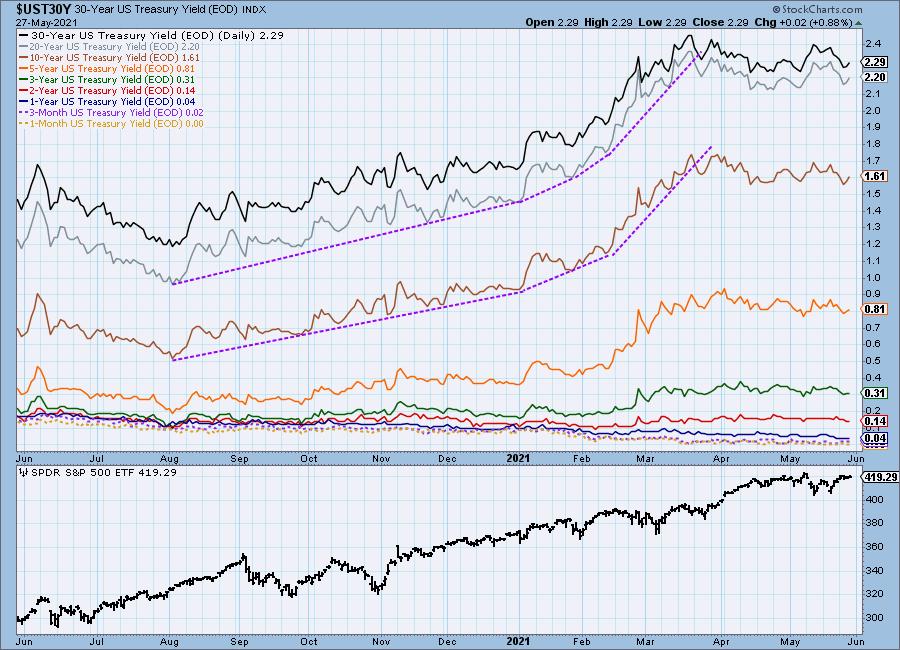
INTEREST RATES
Long-Term yields headed down to test support at April lows, but support hasn't been broken yet.
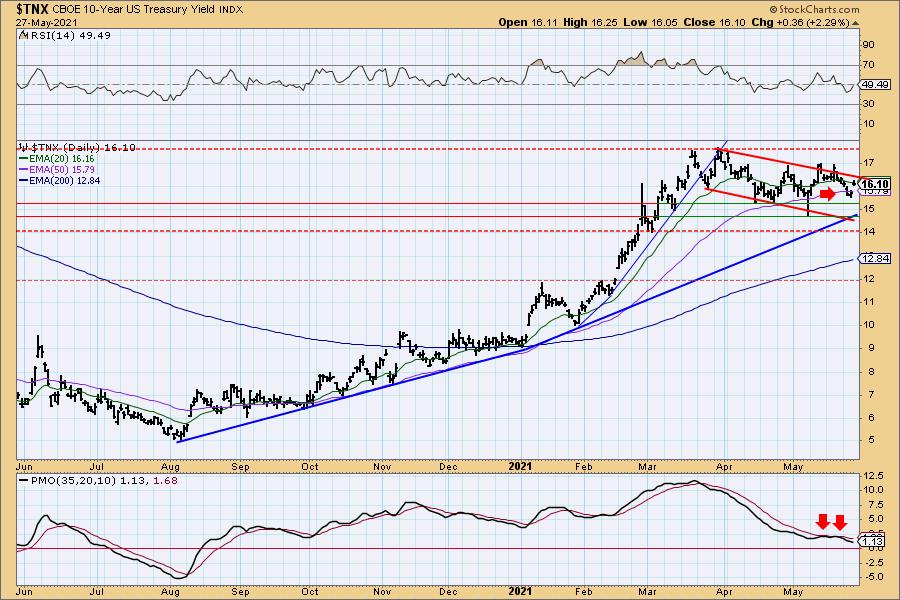
10-YEAR T-BOND YIELD
The 10-year yield bounced strongly today, but I would watch out for a reverse island formation. The yield rose above the 20-EMA, but closed beneath. The PMO is still configured negatively.
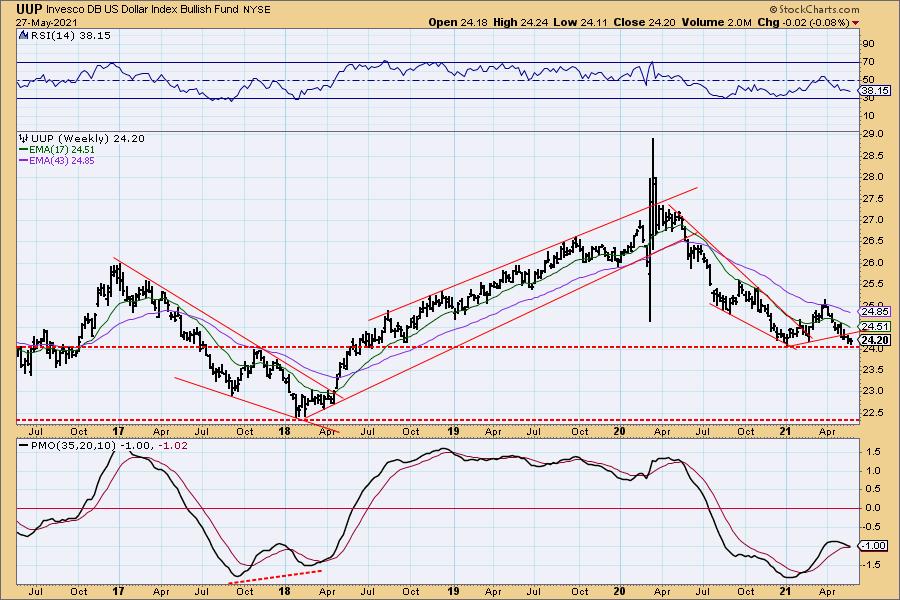
DOLLAR (UUP)
IT Trend Model: SELL as of 4/26/2021
LT Trend Model: SELL as of 7/10/2020
UUP Daily Chart: UUP bounce off support at the January low, but still hasn't been able to rally out of the falling wedge. A falling wedge is bullish and the expectation is a breakout. The PMO is beginning to rise, so maybe "third time is a charm" for price breaking above the 20-EMA.
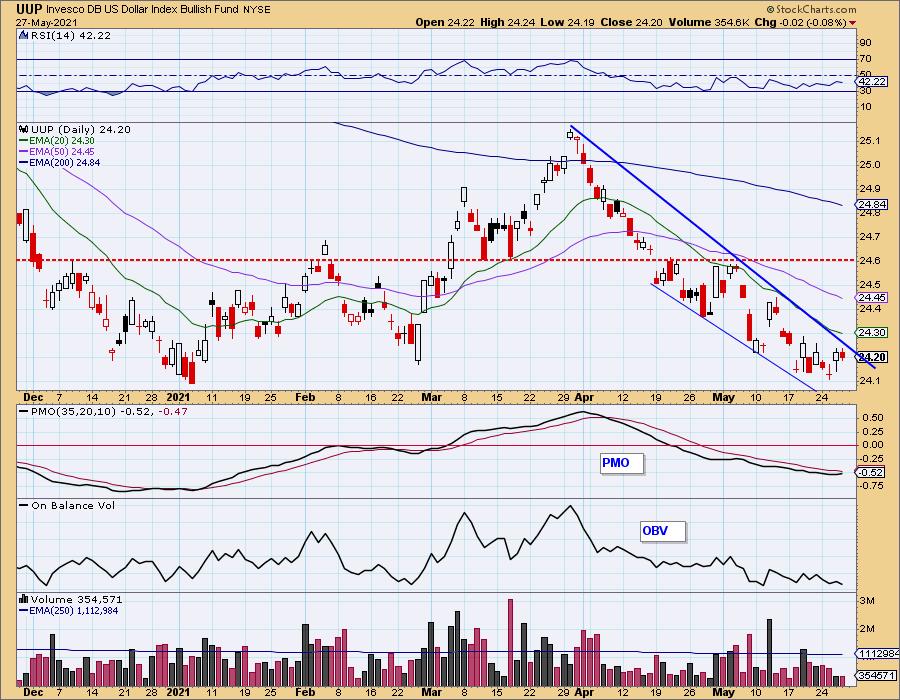
This is an important support level at the 2021 low.
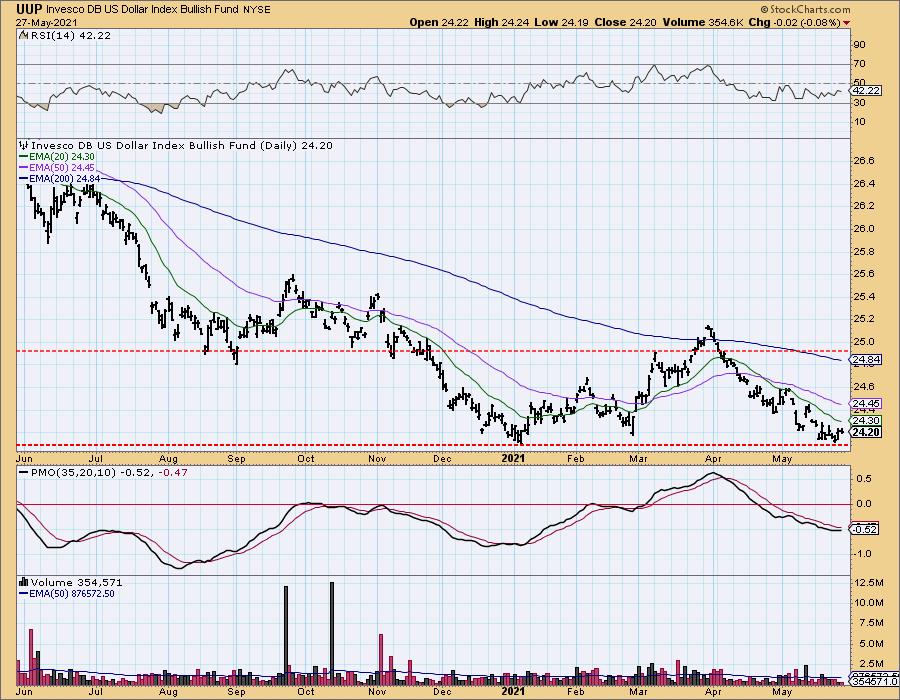
If we get the bounce here, there is a possible double-bottom in the making. However, it is hard to imagine a giant rally in the Dollar when we are printing so many of them.
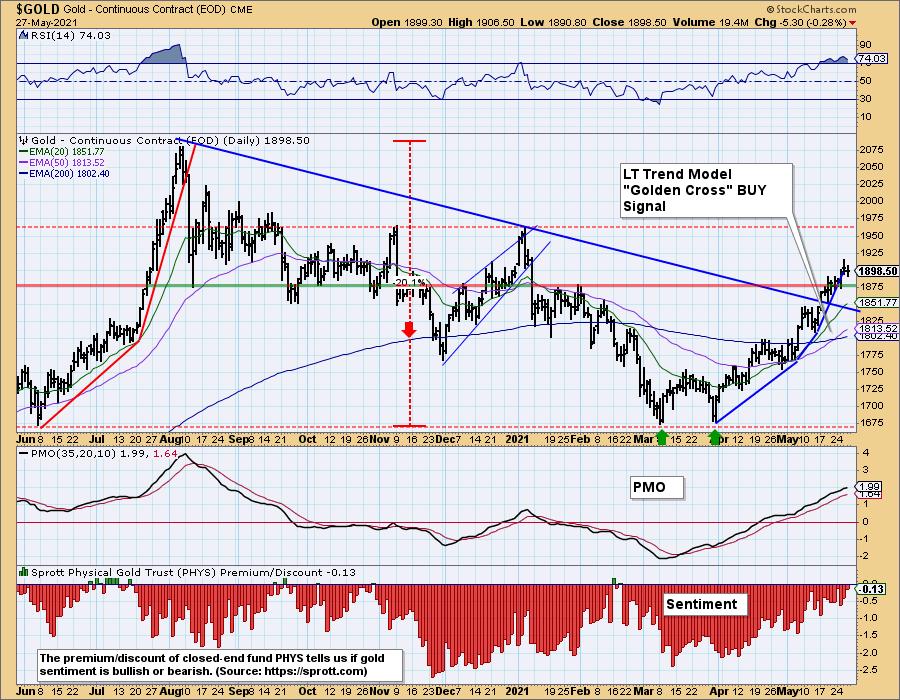
GOLD
IT Trend Model: BUY as of 5/3/2021
LT Trend Model: BUY as of 5/24/2021
GLD Daily Chart: Gold tested the rising trendline and held. There is a high likelihood we will see a breakdown from this rising trend given the RSI is so overbought and has topped. However, the PMO still looks great, but it is getting a bit overbought.
(Full Disclosure: I own GLD)
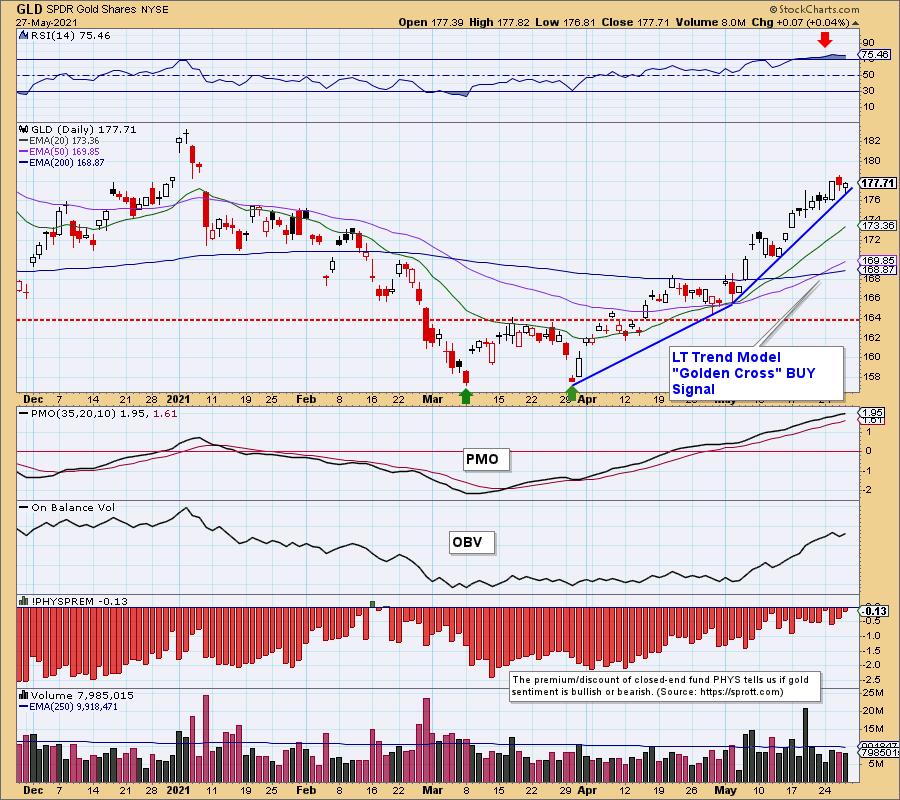
The next level of overhead resistance doesn't arrive until $1963. Other than the overbought RSI, it does appear that Gold will continue toward that resistance level.
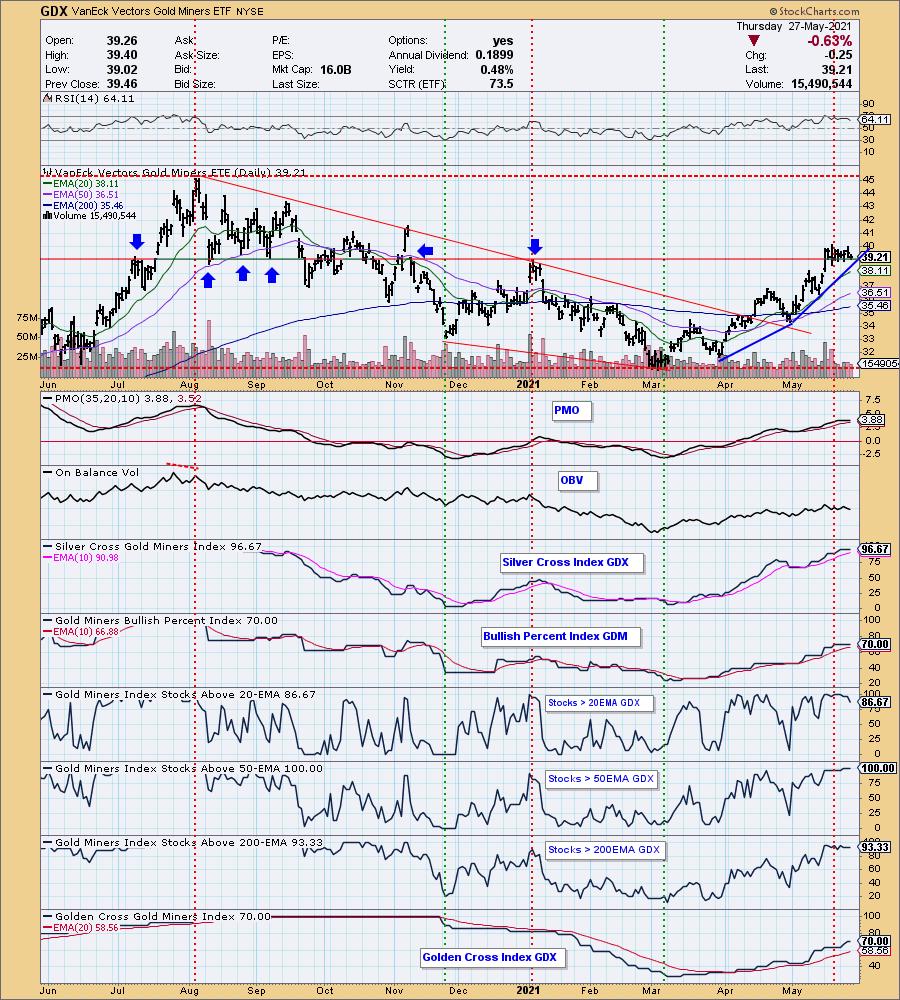
GOLD MINERS Golden and Silver Cross Indexes: Yesterday's comments still apply:
"Miners are consolidating, but they are staying above very important support. You can see that not only does the 2021 top touch the support line, but many other troughs, gaps, etc. are touching it. The rising bottoms trendline is coming up quick. The RSI is still positive and the GCI turned sharply higher. I still like Miners and expect to see them rally again."
CRUDE OIL (USO)
IT Trend Model: BUY as of 11/23/2020
LT Trend Model: BUY as of 3/9/2021
USO Daily Chart: Crude oil is rallying again. The PMO is consequently nearing a crossover BUY signal. The RSI is positive and not overbought. Working against USO is the bearish rising wedge.
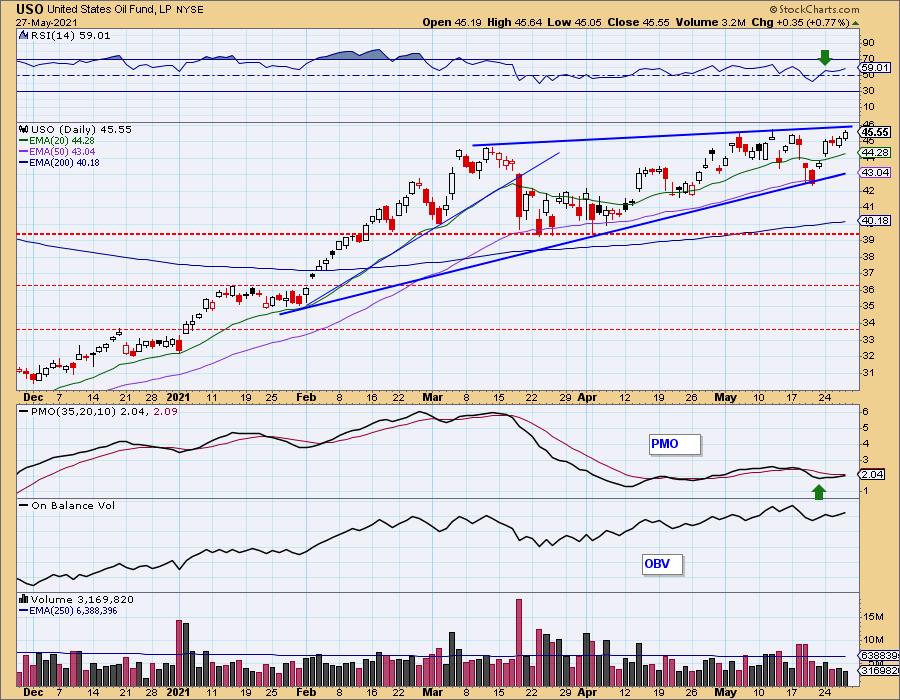
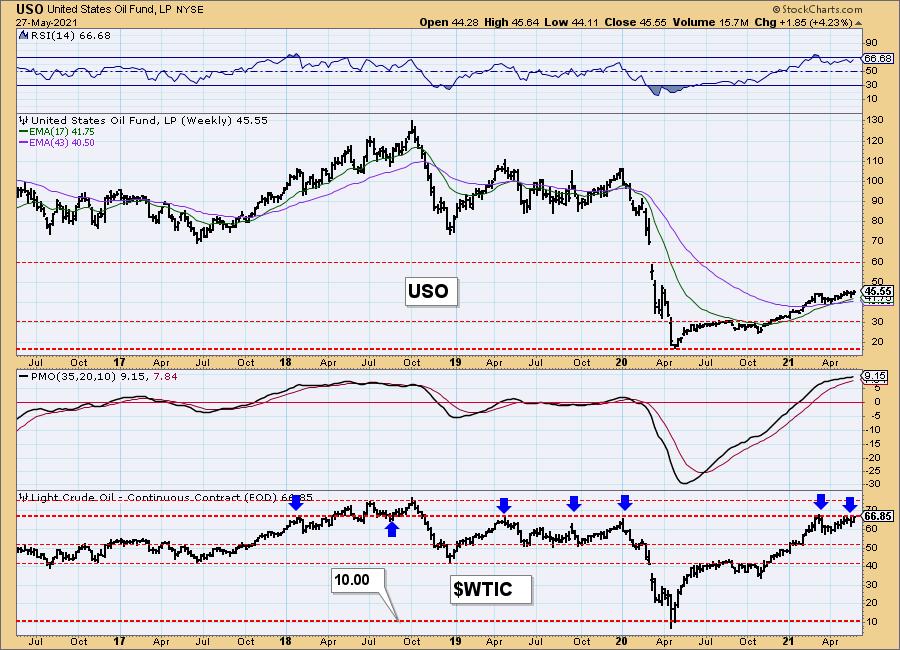
Another problem for USO is that $WTIC has not been able to overcome resistance.
BONDS (TLT)
IT Trend Model: NEUTRAL as of 8/27/2020
LT Trend Model: SELL as of 1/8/2021
TLT Daily Chart: With yields popping higher today, TLT was hit. Price is sitting on support at the 20-EMA and the RSI is still positive. Additionally there is a PMO crossover BUY signal. We could be looking at a cup and handle developing.
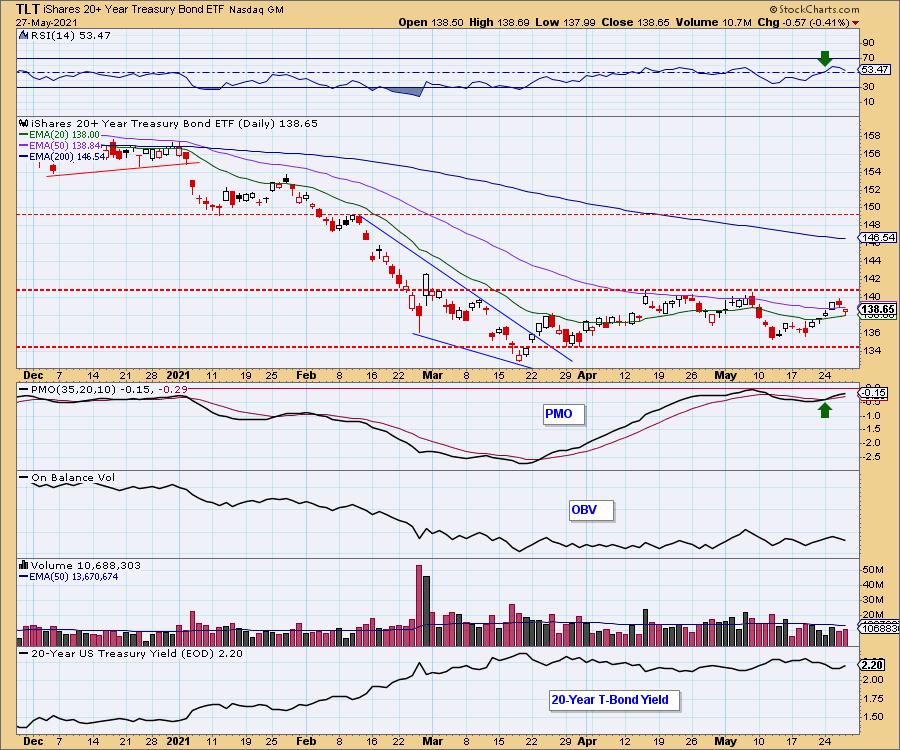
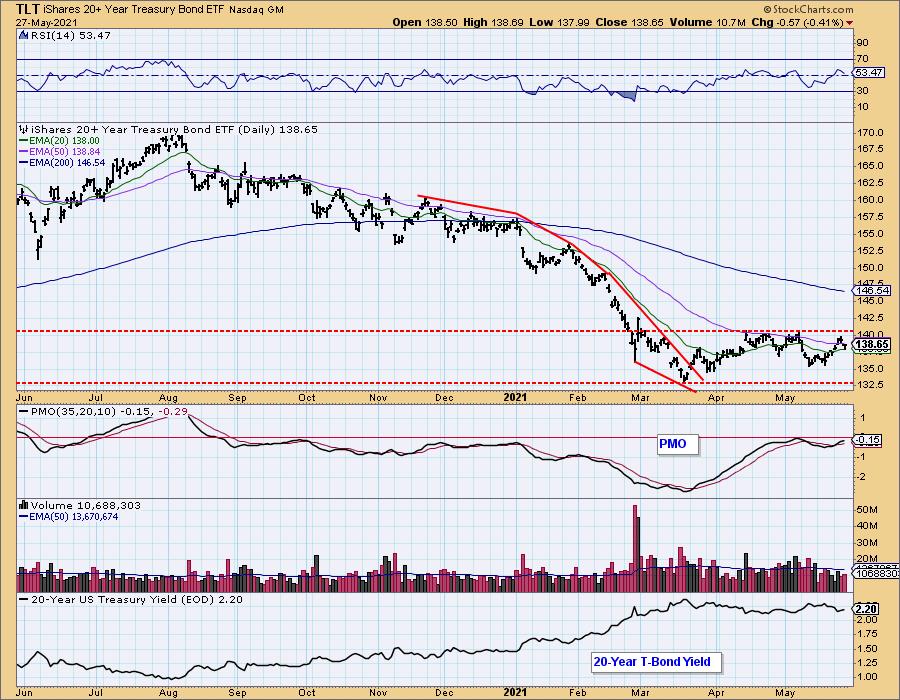
It is concerning that price couldn't hold above the 50-EMA. This has been a problem for TLT since the long-term decline began.
Happy Charting!
Erin Swenlin
Technical Analysis is a windsock, not a crystal ball.
Disclaimer: This blog is for educational purposes only and should not be construed as financial advice. The ideas and strategies should never be used without first assessing your own personal and financial situation, or without consulting a financial professional. Any opinions expressed herein are solely those of the author, and do not in any way represent the views or opinions of any other person or entity.
NOTE: The signal status reported herein is based upon mechanical trading model signals, specifically, the DecisionPoint Trend Model. They define the implied bias of the price index based upon moving average relationships, but they do not necessarily call for a specific action. They are information flags that should prompt chart review. Further, they do not call for continuous buying or selling during the life of the signal. For example, a BUY signal will probably (but not necessarily) return the best results if action is taken soon after the signal is generated. Additional opportunities for buying may be found as price zigzags higher, but the trader must look for optimum entry points. Conversely, exit points to preserve gains (or minimize losses) may be evident before the model mechanically closes the signal.
Helpful DecisionPoint Links:
DecisionPoint Alert Chart List
DecisionPoint Golden Cross/Silver Cross Index Chart List
DecisionPoint Sector Chart List
Price Momentum Oscillator (PMO)
Swenlin Trading Oscillators (STO-B and STO-V)
DecisionPoint is not a registered investment advisor. Investment and trading decisions are solely your responsibility. DecisionPoint newsletters, blogs or website materials should NOT be interpreted as a recommendation or solicitation to buy or sell any security or to take any specific action.