
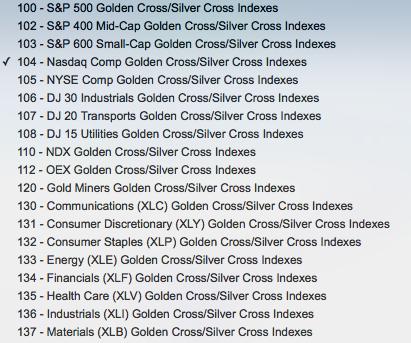
A DecisionPoint IT Trend Model (ITTM) BUY signal is generated when the 20EMA crosses up through the 50EMA, what we call a "Silver Cross." A few years ago we developed the Silver Cross Index, which tracks the percentage of stocks in a given index that have a silver cross condition. We believe this is a superior breadth indicator because it gives a much clearer picture of the stocks actually participating in the price trend of the index. Here is a list of market indexes for which we have a Silver Cross Index (SCI).
The SCI for the Nasdaq Composite Index is in terrible shape. The first panel below the Nasdaq Tracking stock (ONEQ) is the Silver Cross Index, and it is 46% below where it was in February at the previous all-time price high. How can price be making a new, all-time high when less than 50% of stocks are participating? Well, the Nasdaq has a lot of cats and dogs that are trying to drag it down, but the Nasdaq is cap-weighted, and it also has giants like Apple, Amazon, and Microsoft that hold it up. Nevertheless, we can see where previous negative divergences ultimately resulted in price declines of various degrees.
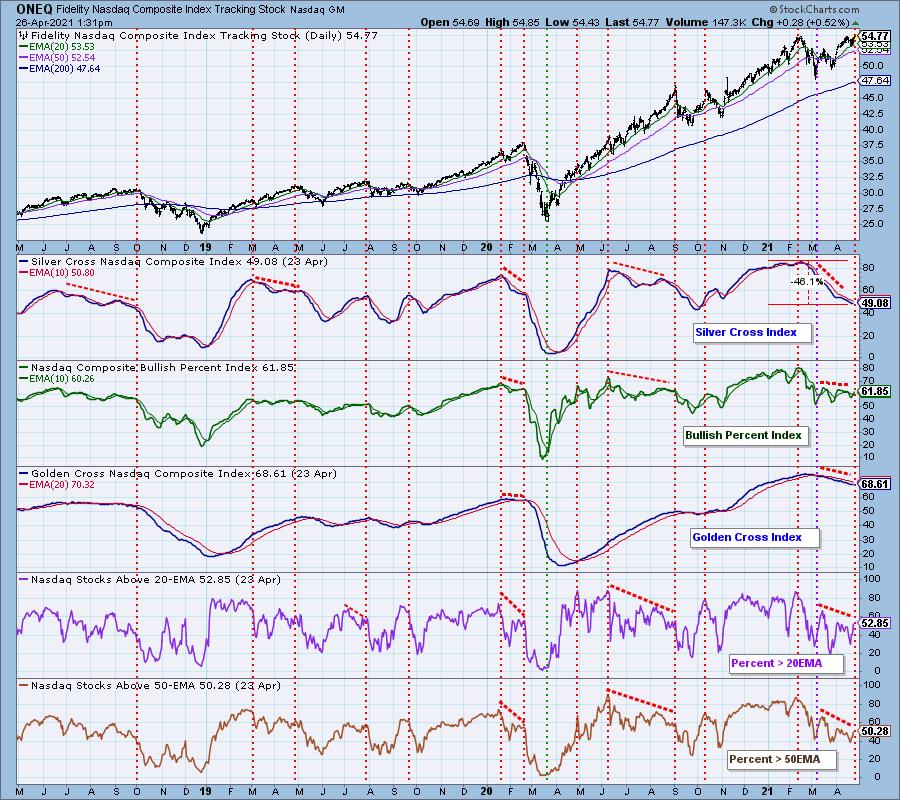
In the remaining panels on the chart are other indicators from different data sources that have similarly objective breadth assessments for other time frames. Without going into detail, we can see that they all are diverging negatively from the price trend.

Click here to register in advance for the recurring free DecisionPoint Trading Room! Recordings are available!
In contrast, the same set of indicators for the S&P 500 are generally confirming the all-time highs being set by the index. This is good, right? Well, it is better than a slew of negative divergences, but the problem is that the indicators are very overbought, indicating that a price decline is likely.
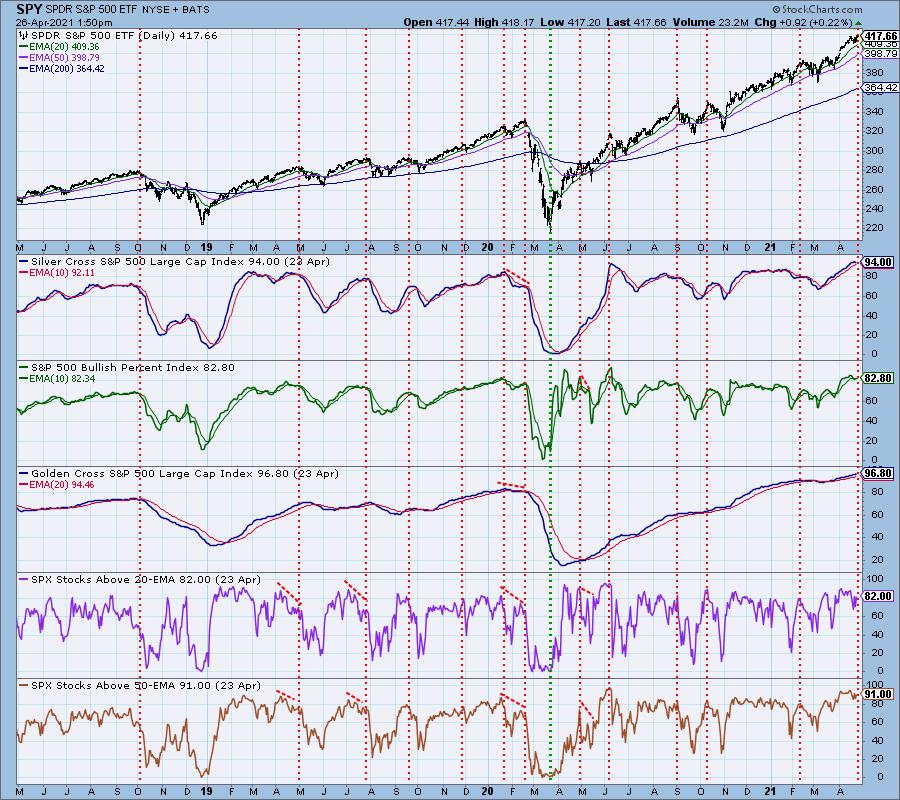
CONCLUSION: Many smaller-cap stocks in the Nasdaq Composite are no longer participating in the market rally. And even though there is still broad participation in the large-cap S&P 500, internals are extremely overbought. The price advance could continue, but this is not a robust internal picture supporting that outcome.
Technical Analysis is a windsock, not a crystal ball.
Helpful DecisionPoint Links:
DecisionPoint Alert Chart List
DecisionPoint Golden Cross/Silver Cross Index Chart List
DecisionPoint Sector Chart List
Price Momentum Oscillator (PMO)
Swenlin Trading Oscillators (STO-B and STO-V)
DecisionPoint is not a registered investment advisor. Investment and trading decisions are solely your responsibility. DecisionPoint newsletters, blogs or website materials should NOT be interpreted as a recommendation or solicitation to buy or sell any security or to take any specific action.