
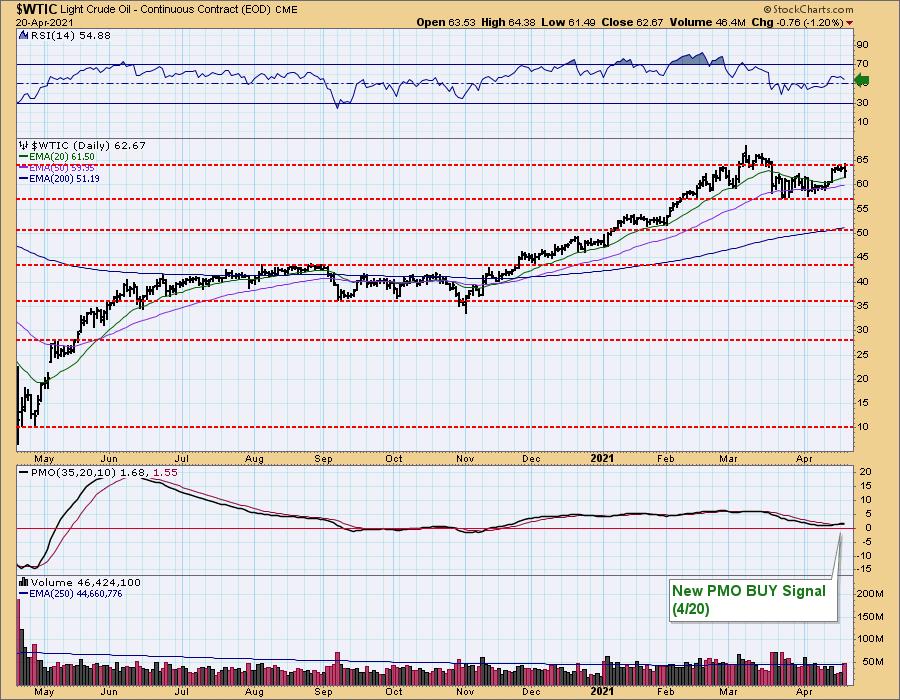
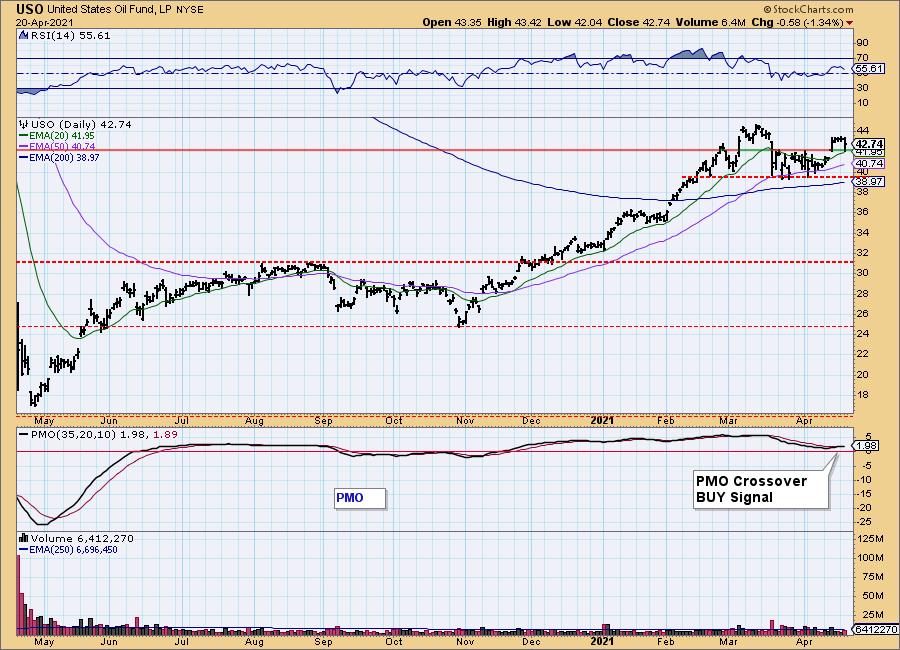
We were alerted today that Crude Oil ($WTIC) had triggered a new PMO crossover BUY signal. Yesterday, USO generated the same signal. Given the -1.2% decline today on $WTIC, it might be surprising to see a new BUY signal. The signal could have arrived late to the party. We had a nice breakout last week, but resistance has been hit and price is struggling to overcome it. The good news is that price is still holding above the 20-EMA and the RSI is positive. All is not lost for Crude Oil, but it appears we had a fake out breakout last week.
The DecisionPoint Alert Weekly Wrap presents an end-of-week assessment of the trend and condition of the Stock Market, the U.S. Dollar, Gold, Crude Oil, and Bonds. The DecisionPoint Alert daily report (Monday through Thursday) is abbreviated and gives updates on the Weekly Wrap assessments.
Watch the latest episode of DecisionPoint on StockCharts TV's YouTube channel here!
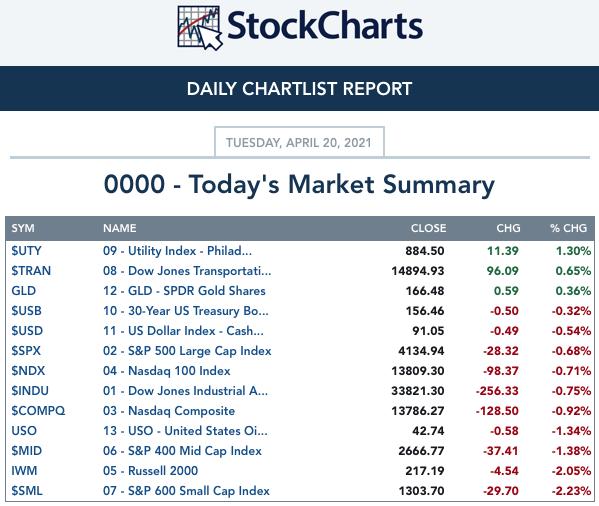
MAJOR MARKET INDEXES
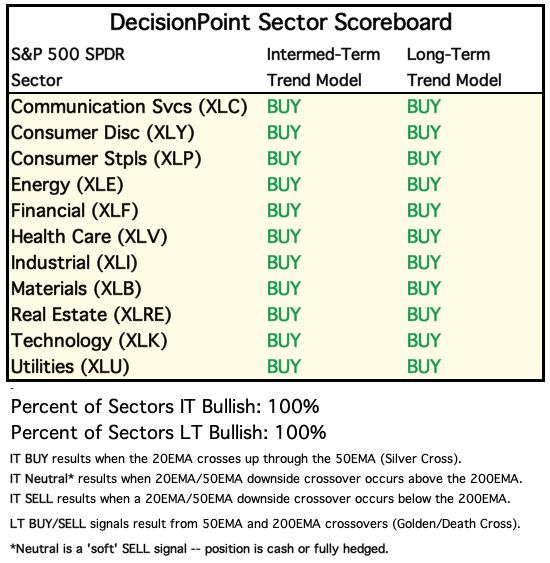
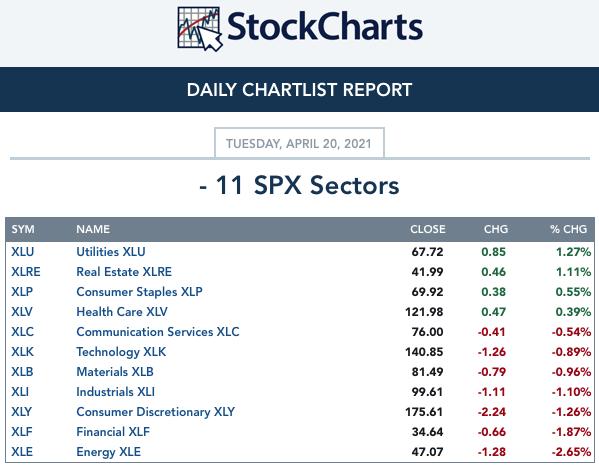
SECTORS
Each S&P 500 Index component stock is assigned to one, and only one, of 11 major sectors. This is a snapshot of the Intermediate-Term (Silver Cross) and Long-Term (Golden Cross) Trend Model signal status for those sectors.
CLICK HERE for Carl's annotated Sector charts.
THE MARKET (S&P 500)
IT Trend Model: BUY as of 5/8/2020
LT Trend Model: BUY as of 6/8/2020
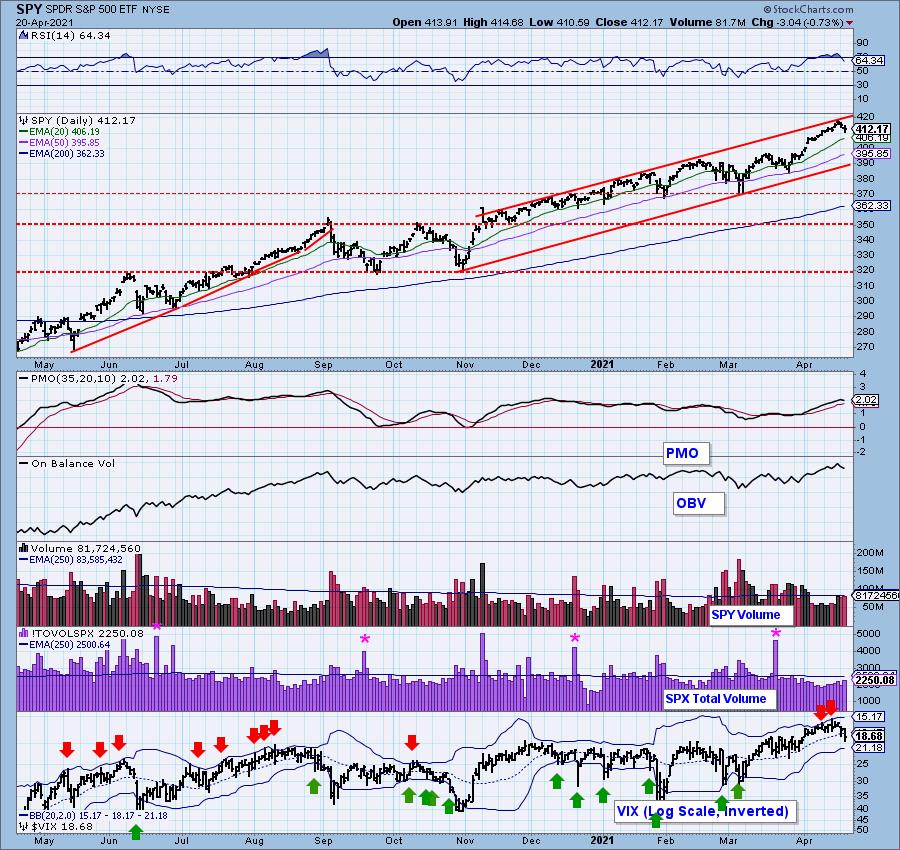
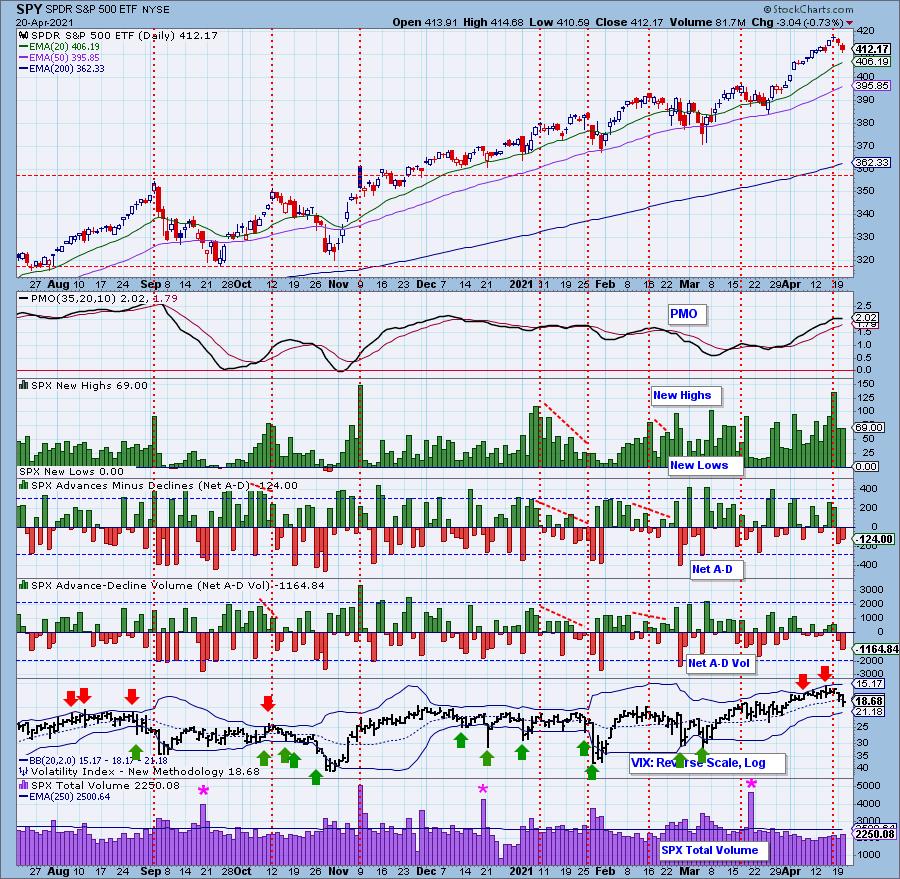
SPY Daily Chart: The decline continues. The question is where is support. I would look for a test of gap support around $402 for the SPY. With the PMO turning down and an increase in volume, there is likely more downside to endure.
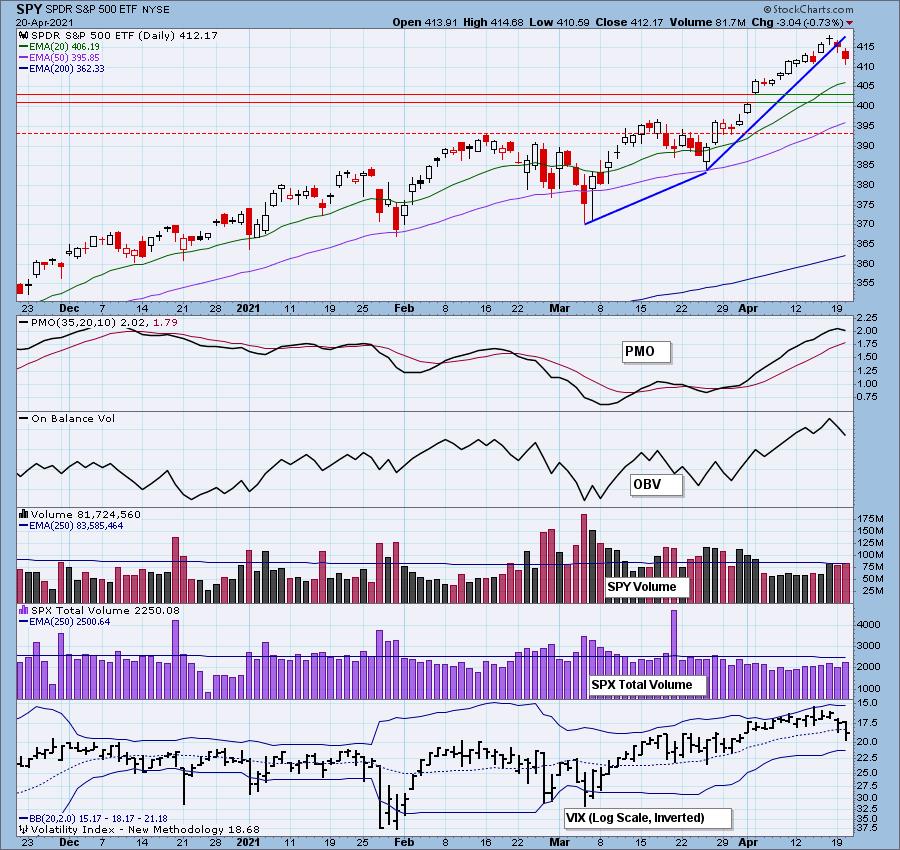
On the bright side, this pullback has taken the RSI out of overbought territory. As we can see in the past, an overbought RSI is deadly for the SPY.

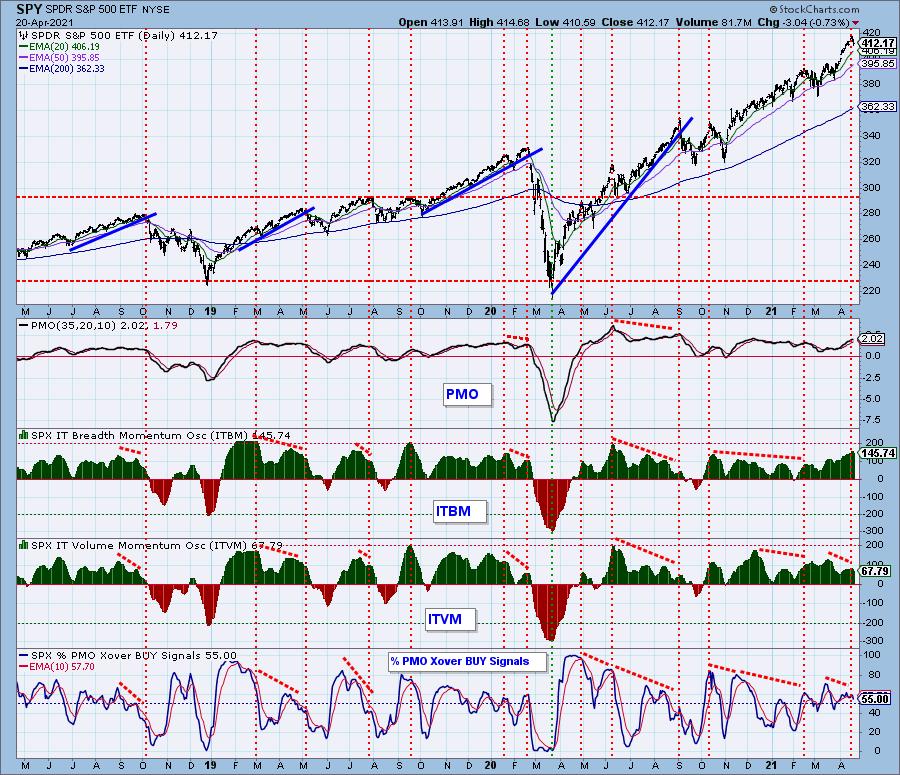
Participation: The following chart uses different methodologies for objectively showing the depth and trend of participation for intermediate- and long-term time frames.
- The Silver Cross Index (SCI) shows the percentage of SPX stocks on IT Trend Model BUY signals (20-EMA > 50-EMA).
- The Golden Cross Index (GCI) shows the percentage of SPX stocks on LT Trend Model BUY signals (50-EMA > 200-EMA).
- The Bullish Percent Index (BPI) shows the percentage of SPX stocks on Point & Figure BUY signals.
The SCI and GCI suggest there is enough participation to prevent a correction or price shock. The BPI has turned over with the PMO which tells me there is more downside to go.
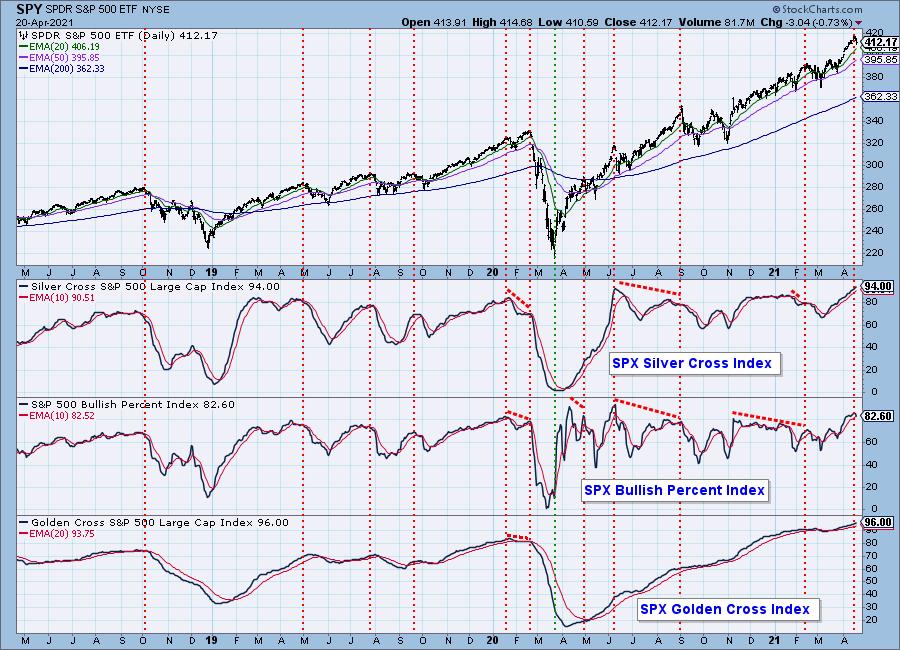
Despite a strong 94% SCI reading, we can see that nearly 27% of them lost price support at their 20-EMAs. That's a strong downdraft. And of those 94% of stocks with a 20-EMA > 50-EMA, 9% lost support at their 50-EMAs.
Climax Analysis: Interestingly we didn't see a climax today. The VIX has now dropped below its EMA on the inverted log scale, suggesting more downside in the next few days.
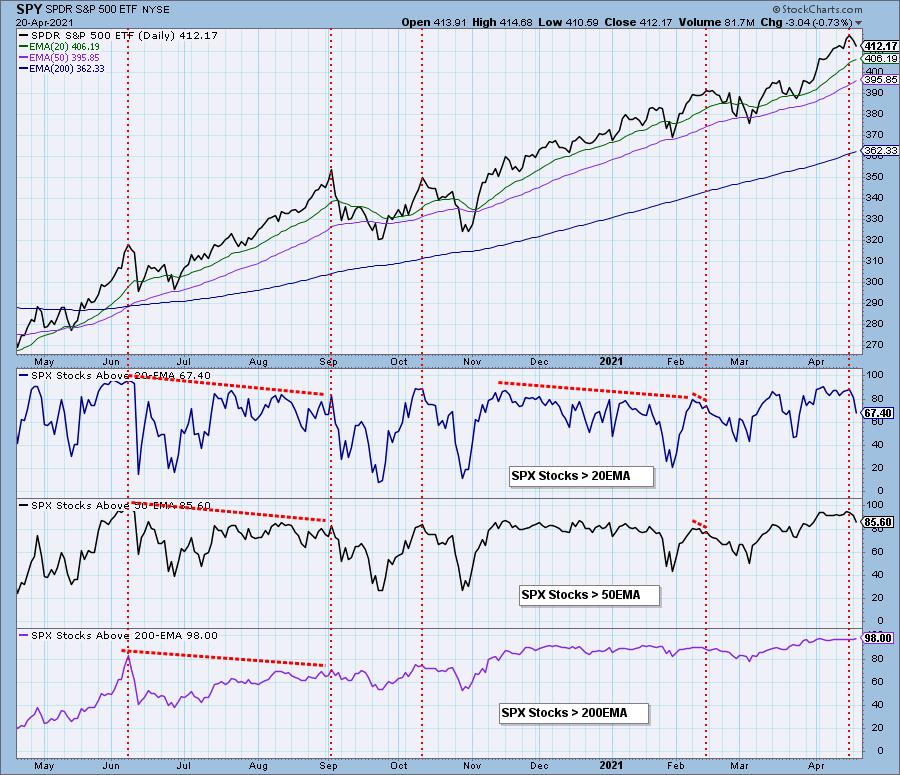
Short-Term Market Indicators: The short-term market trend is DOWN and the condition is NEUTRAL.
The STOs warned us yesterday that lower prices were likely ahead. Today their readings confirm this short-term declining trend. Notice that only 41% of SPX stocks have a rising momentum.
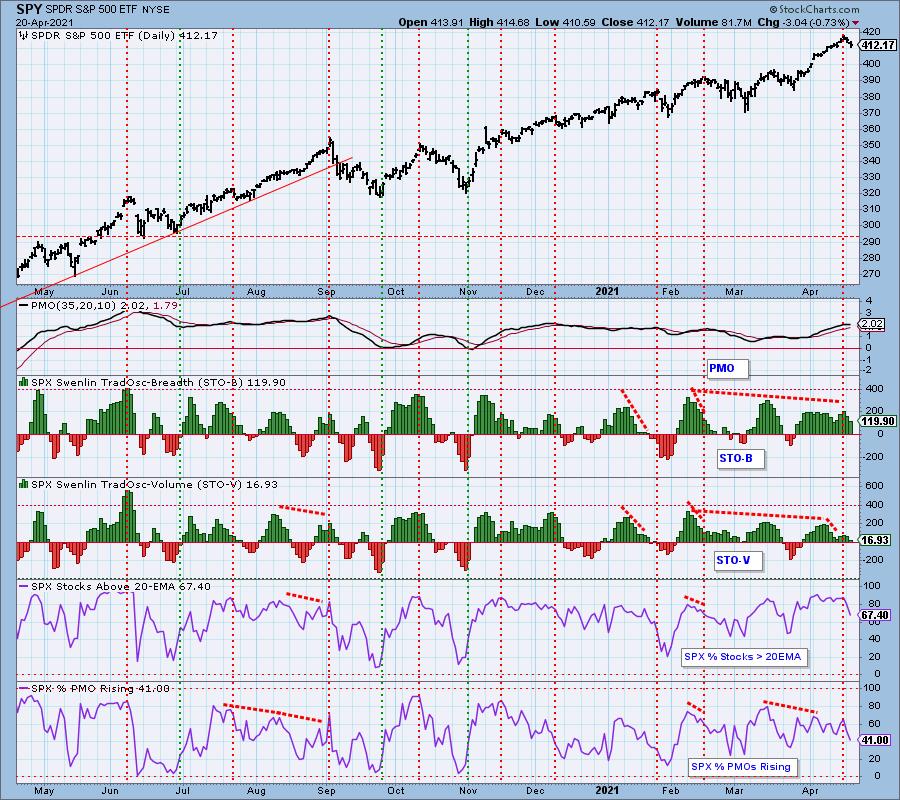
Intermediate-Term Market Indicators: The intermediate-term market trend is UP and the condition is OVERBOUGHT. The market bias is BULLISH.
Both indicators are continuing lower after topping yesterday. This does warn us that a short-term pullback could turn into an intermediate-term correction.
CONCLUSION: Given the short-term and intermediate-term indicators topped yesterday it wasn't completely surprising to see a decline in the market. They continue to decline and today we saw a great deal of damage to participation. While we may see 94% of SPX stocks with a 20-EMA above the 50-EMA, over a quarter of them lost support at the 20-EMA. We expect to see a continuation of this decline and a test of gap support at $402 for the SPY.
Have you subscribed the DecisionPoint Diamonds yet? DP does the work for you by providing handpicked stocks/ETFs from exclusive DP scans! Add it with a discount! Contact support@decisionpoint.com for more information!
BITCOIN
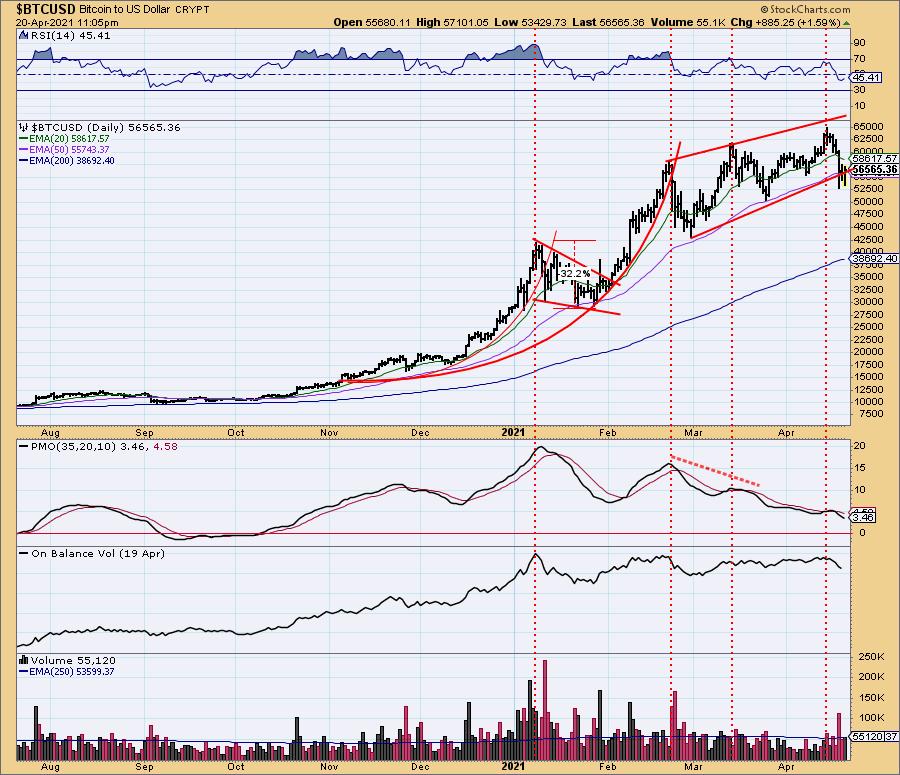
Yesterday's comments still apply:
"Price did not make it to the top of the wedge before turning lower. The PMO unenthusiastically had crossed above its signal line, but has already whipsawed into a crossover SELL signal. The RSI is now negative, but oversold for Bitcoin. Typically when Bitcoin loses or tests the 50-EMA, it is an upside reversal point. Given we haven't seen a close below the bearish wedge yet, this certainly could be a reversal point. I'd feel more certain of a reversal here if the PMO would flatten a bit more."
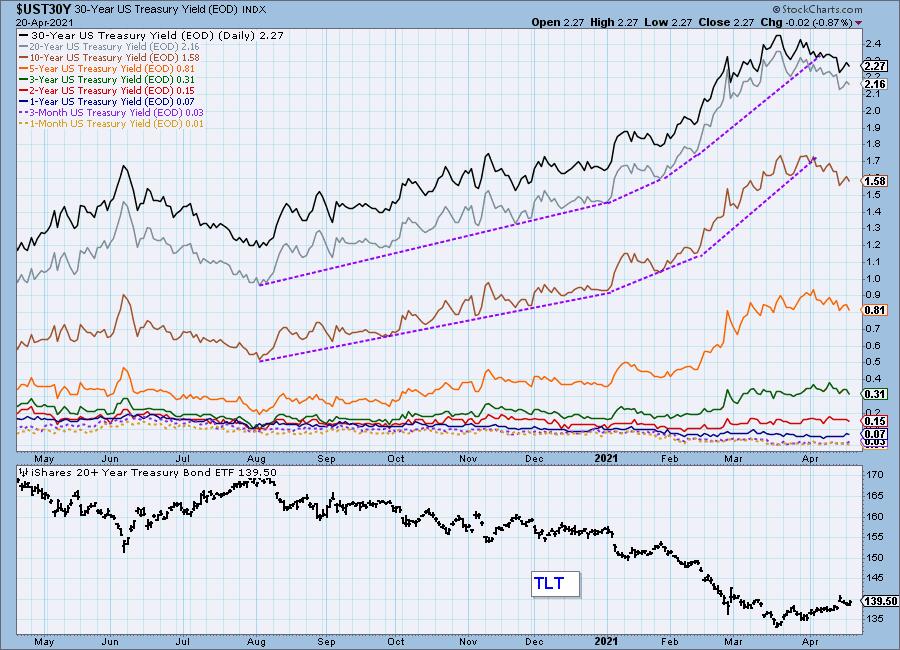
INTEREST RATES
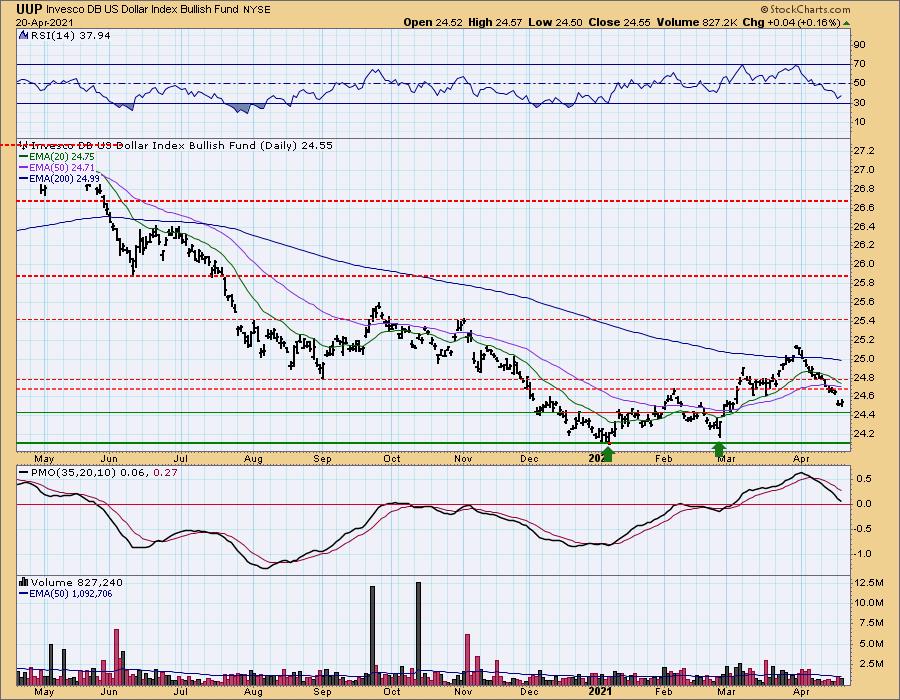
DOLLAR (UUP)
IT Trend Model: BUY as of 3/5/2021
LT Trend Model: SELL as of 7/10/2020
UUP Daily Chart: UUP managed to close slightly higher, but it hasn't improved the bearish technical picture.
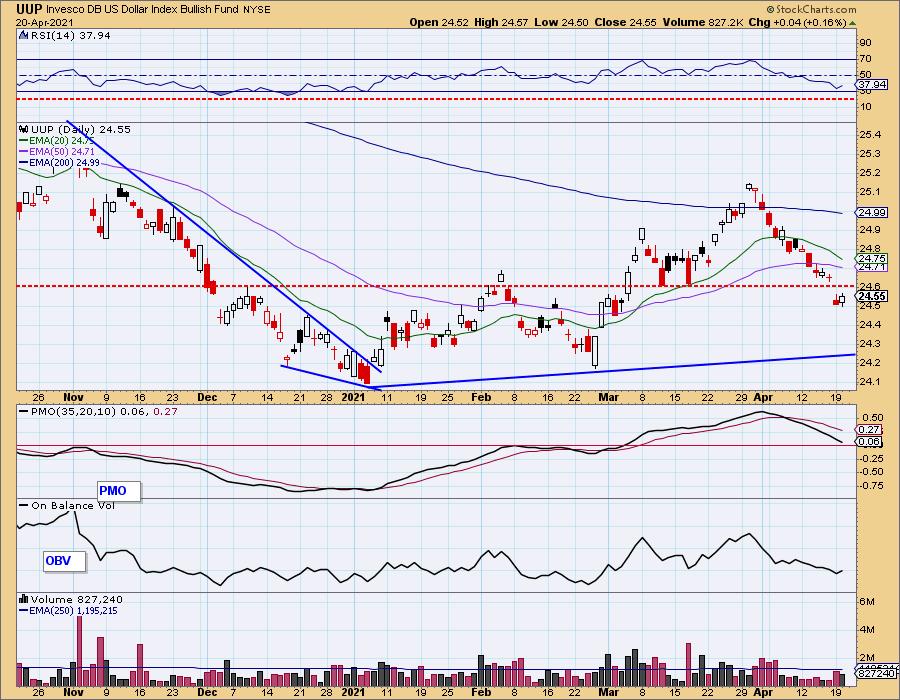
The next area of support is just above $24.40, but the strongest level of support doesn't arrive until $24.10.
GOLD
IT Trend Model: NEUTRAL as of 1/13/2021
LT Trend Model: SELL as of 3/4/2021
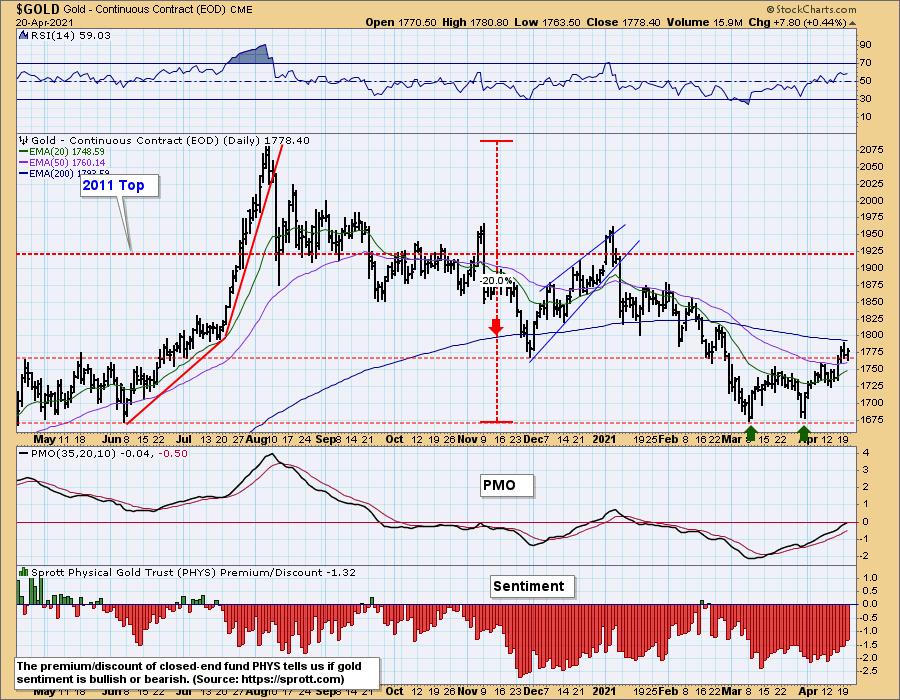
GLD Daily Chart: Gold is clinging to support at the February low. Given the positive RSI and nearly positive rising PMO, we expect support to hold here.
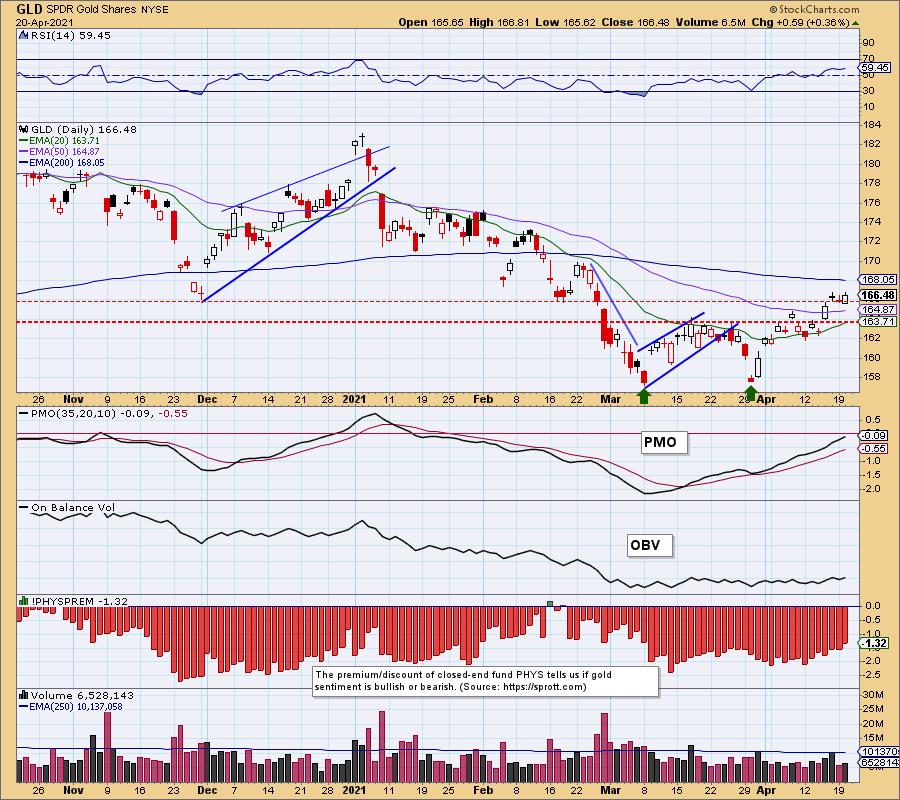
The double-bottom has resolved to the upside as expected, but we haven't come close to reaching the minimum upside target at around $1875. Discounts are contracting so investors are getting less bearish on Gold.
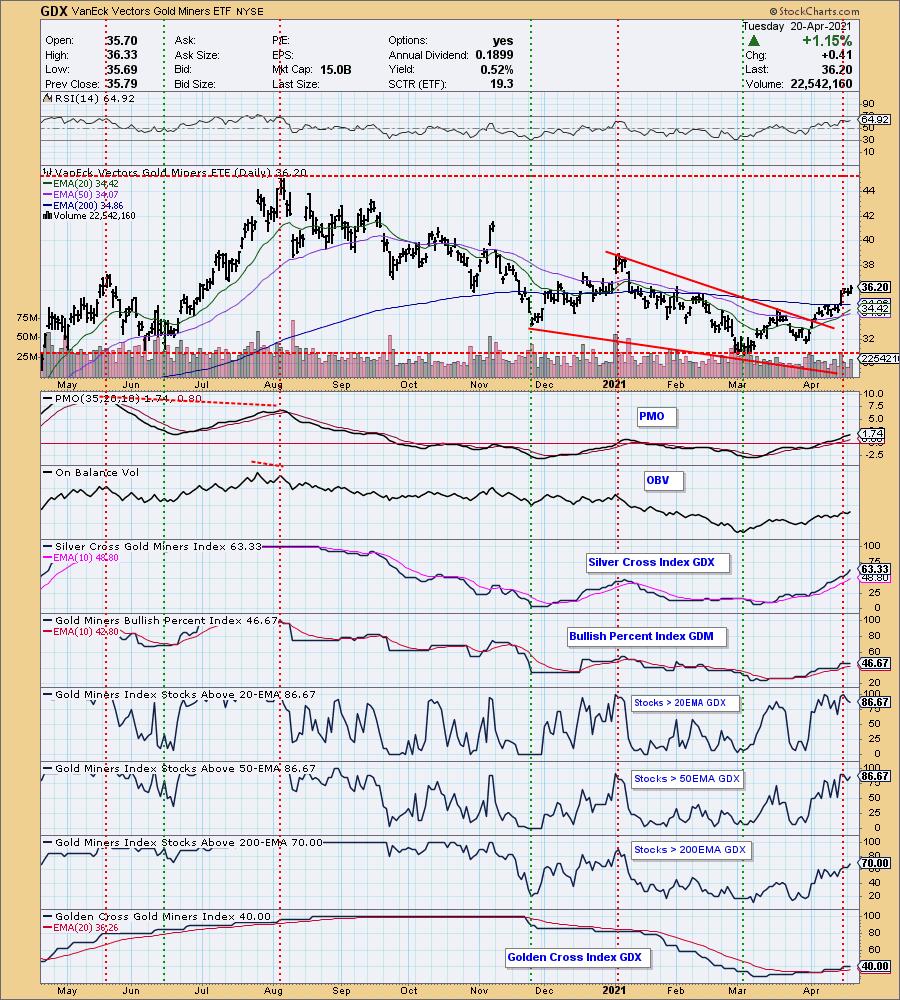
GOLD MINERS Golden and Silver Cross Indexes: GDX broke out after consolidating and forming a tiny 3-day flag. The indicators just keep improving so I would look for a test of the 2021 high.
CRUDE OIL (USO)
IT Trend Model: BUY as of 11/23/2020
LT Trend Model: BUY as of 3/9/2021
USO Daily Chart: As noted in the opening regarding $WTIC, prices dropped today but managed to hold support at the 20-EMA and the top of the bullish ascending triangle that it recently broke out of.
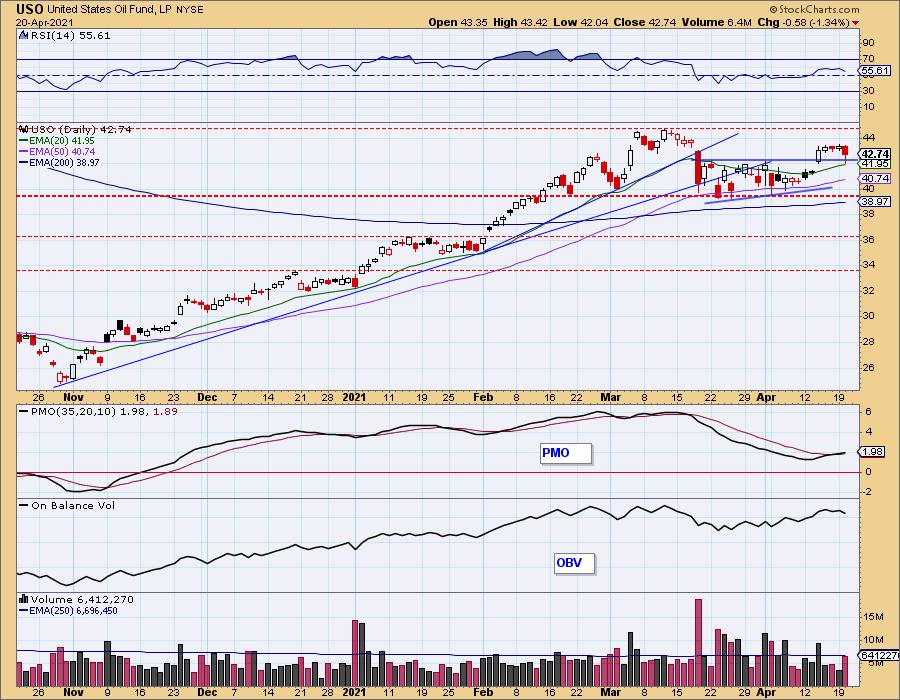
Given support held, the RSI is positive and the PMO is still holding its crossover BUY signal, at worst I would expect consolidation along this support level.
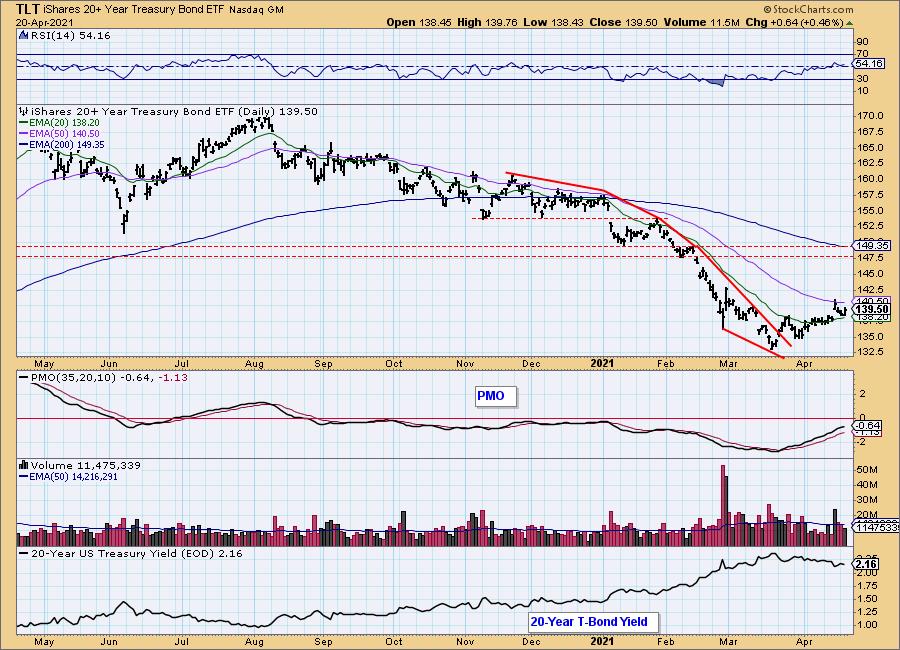
BONDS (TLT)
IT Trend Model: NEUTRAL as of 8/27/2020
LT Trend Model: SELLas of 1/8/2021
TLT Daily Chart: Price is holding support at the 20-EMA and the March top. Yields are now in a declining trend so we would expect the wind to be at the back of Bonds.
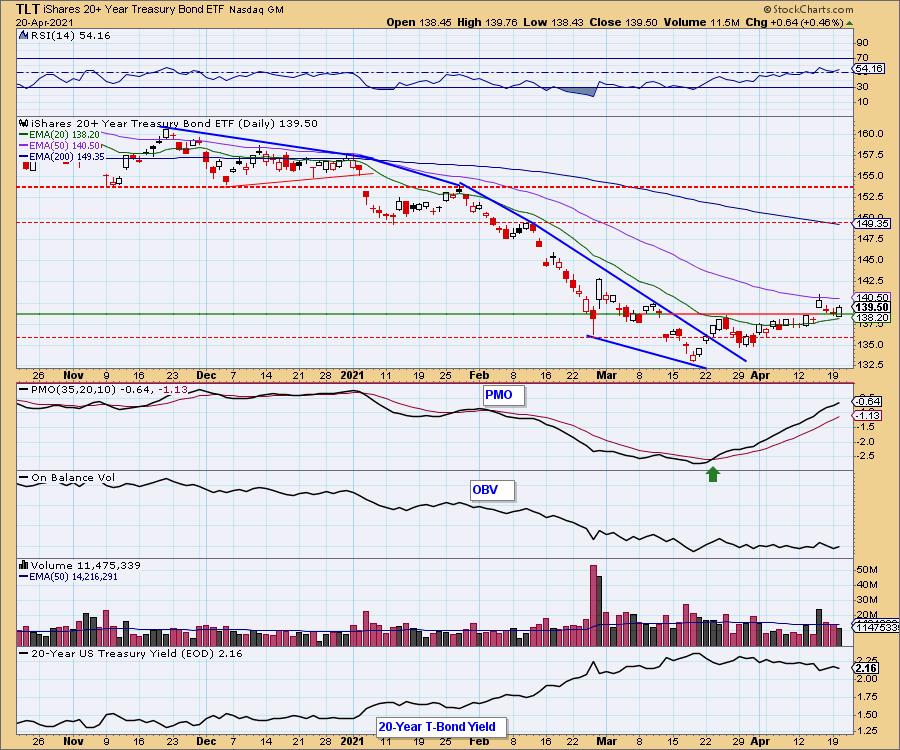
TLT has a positive RSI and rising PMO. Given this declining trend in yields, we would look for a breakout above the 50-EMA.
Happy Charting!
Erin Swenlin
Technical Analysis is a windsock, not a crystal ball.
Disclaimer: This blog is for educational purposes only and should not be construed as financial advice. The ideas and strategies should never be used without first assessing your own personal and financial situation, or without consulting a financial professional. Any opinions expressed herein are solely those of the author, and do not in any way represent the views or opinions of any other person or entity.
NOTE: The signal status reported herein is based upon mechanical trading model signals, specifically, the DecisionPoint Trend Model. They define the implied bias of the price index based upon moving average relationships, but they do not necessarily call for a specific action. They are information flags that should prompt chart review. Further, they do not call for continuous buying or selling during the life of the signal. For example, a BUY signal will probably (but not necessarily) return the best results if action is taken soon after the signal is generated. Additional opportunities for buying may be found as price zigzags higher, but the trader must look for optimum entry points. Conversely, exit points to preserve gains (or minimize losses) may be evident before the model mechanically closes the signal.
Helpful DecisionPoint Links:
DecisionPoint Alert Chart List
DecisionPoint Golden Cross/Silver Cross Index Chart List
DecisionPoint Sector Chart List
Price Momentum Oscillator (PMO)
Swenlin Trading Oscillators (STO-B and STO-V)
DecisionPoint is not a registered investment advisor. Investment and trading decisions are solely your responsibility. DecisionPoint newsletters, blogs or website materials should NOT be interpreted as a recommendation or solicitation to buy or sell any security or to take any specific action.