
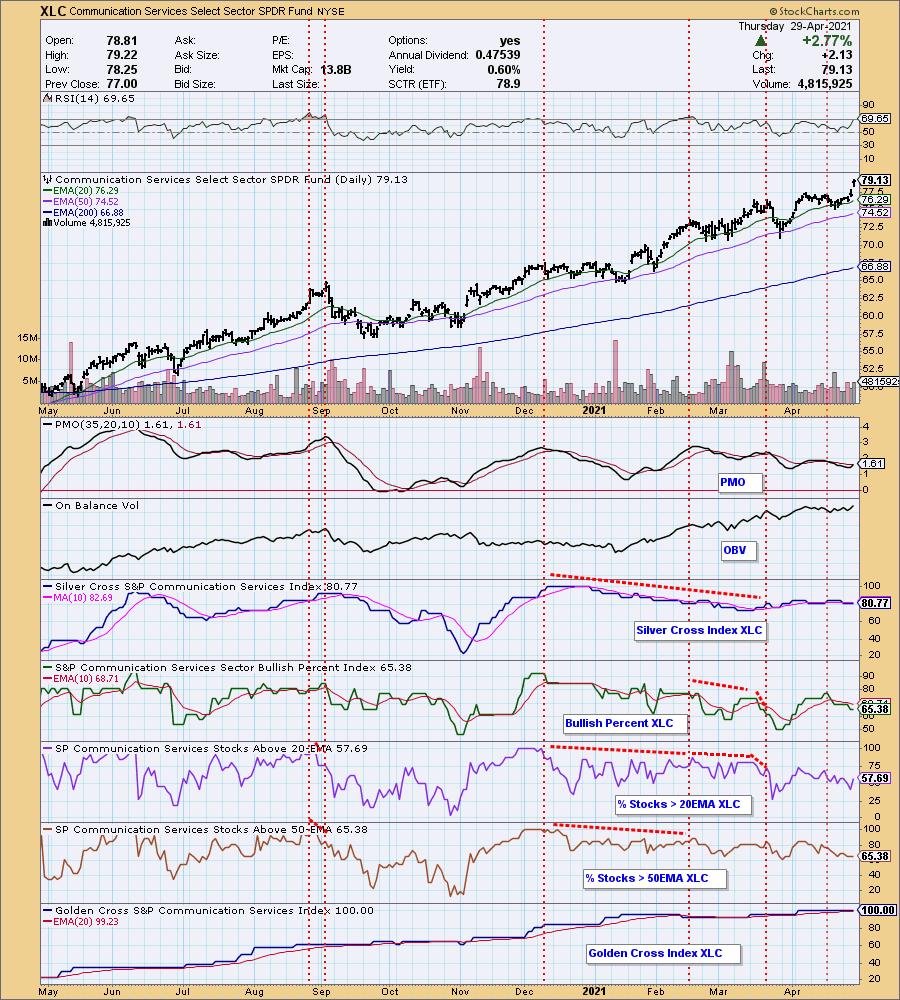
Energy (XLE) was the big winner yesterday. Today it was Communications Services (XLC) due to strong rallies for FB, PINS, GOOGL, DISH and CMCSA, among others. Price finally was able to break the April tops. Underneath the hood, we can see a PMO crossover BUY signal and confirming OBV with rising bottoms. However, past that it becomes clear that it is likely coming on the backs of a handful of stocks.
We did see an uptick in %Stocks > 20-EMA, but not much. The BPI is still in a declining trend. On the bright side there is an opportunity for the other stocks to catch up and take the sector higher.
The DecisionPoint Alert Weekly Wrap presents an end-of-week assessment of the trend and condition of the Stock Market, the U.S. Dollar, Gold, Crude Oil, and Bonds. The DecisionPoint Alert daily report (Monday through Thursday) is abbreviated and gives updates on the Weekly Wrap assessments.
Watch the latest episode of DecisionPoint on StockChartsTV.com and YouTube here!
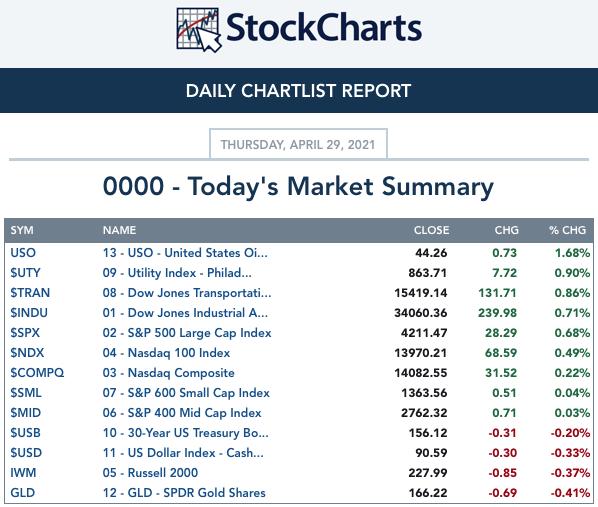
MAJOR MARKET INDEXES
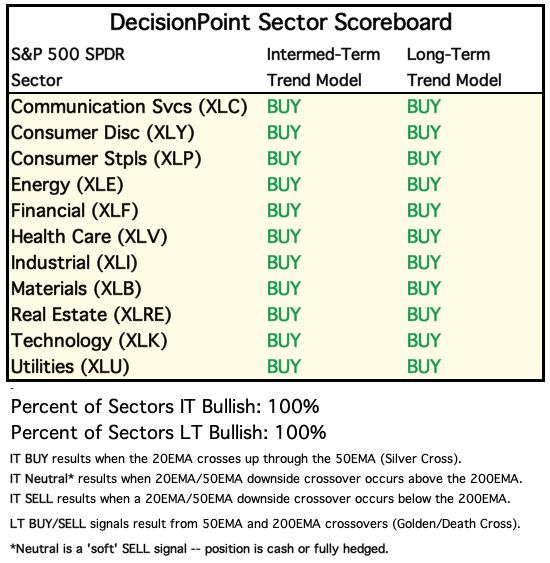
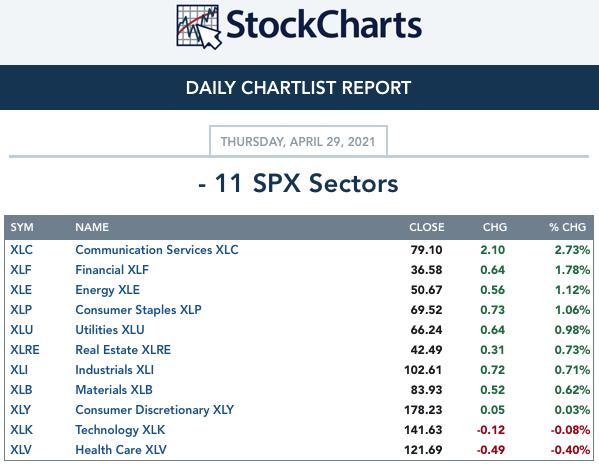
SECTORS
Each S&P 500 Index component stock is assigned to one, and only one, of 11 major sectors. This is a snapshot of the Intermediate-Term (Silver Cross) and Long-Term (Golden Cross) Trend Model signal status for those sectors.
CLICK HERE for Carl's annotated Sector charts.
THE MARKET (S&P 500)
IT Trend Model: BUY as of 5/8/2020
LT Trend Model: BUY as of 6/8/2020
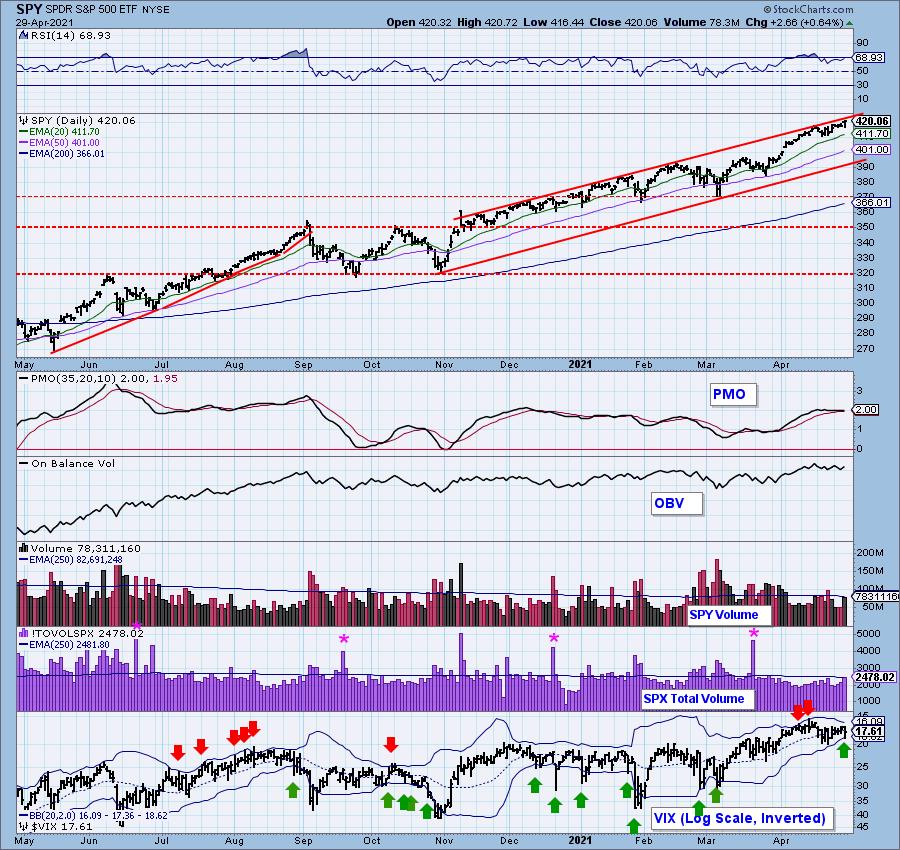
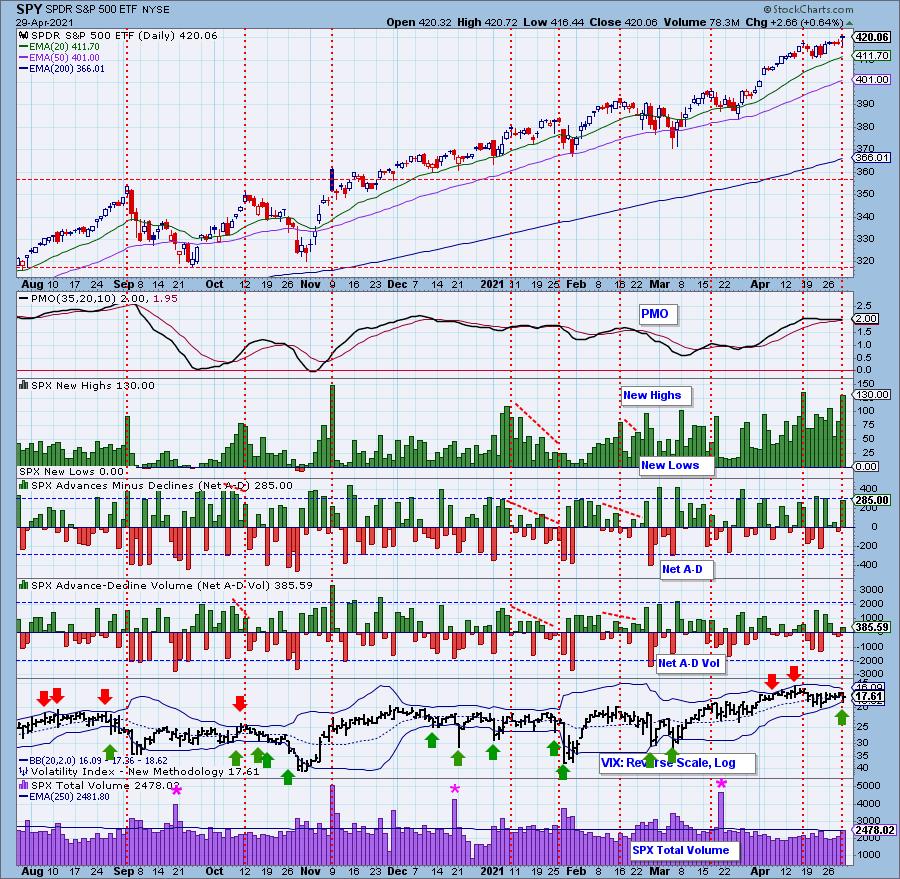
SPY Daily Chart: Today price defied the PMO and our other indicators by rising sharply to close on a new all-time high. The PMO is now rising again. The OBV still shows a negative divergence.
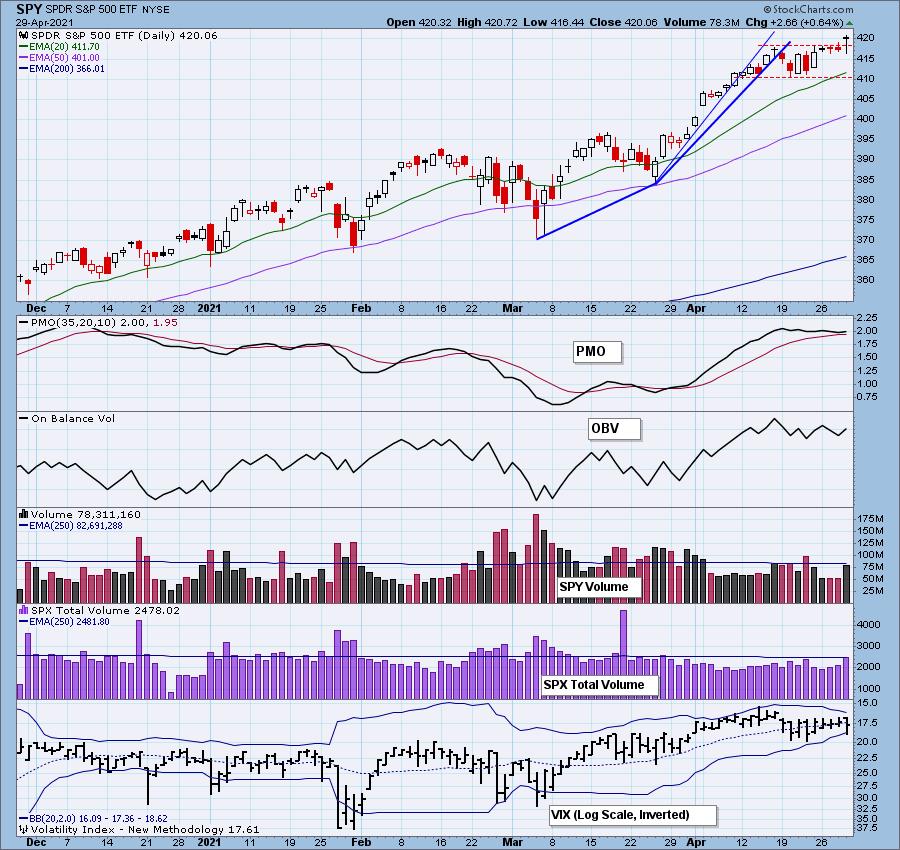
Total Volume popped today likely on big names reporting earnings. The RSI is still positive and not overbought. The rising trend channel remains intact with price hugging the top.

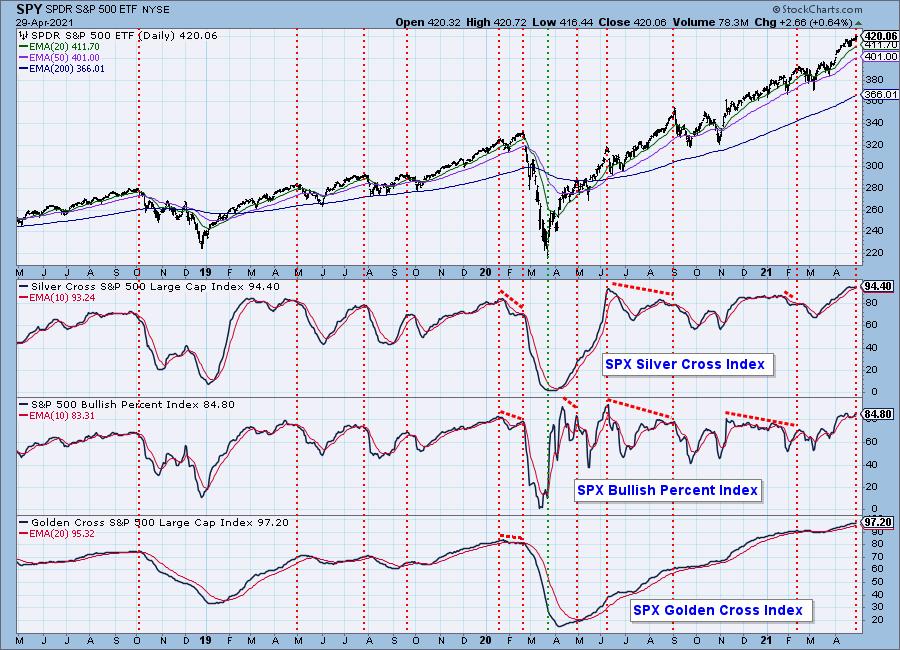
Participation: The following chart uses different methodologies for objectively showing the depth and trend of participation for intermediate- and long-term time frames.
- The Silver Cross Index (SCI) shows the percentage of SPX stocks on IT Trend Model BUY signals (20-EMA > 50-EMA).
- The Golden Cross Index (GCI) shows the percentage of SPX stocks on LT Trend Model BUY signals (50-EMA > 200-EMA).
- The Bullish Percent Index (BPI) shows the percentage of SPX stocks on Point & Figure BUY signals.
All of these indicators rose today, moving them further into overbought extremes. The SCI and GCI are particularly overbought.
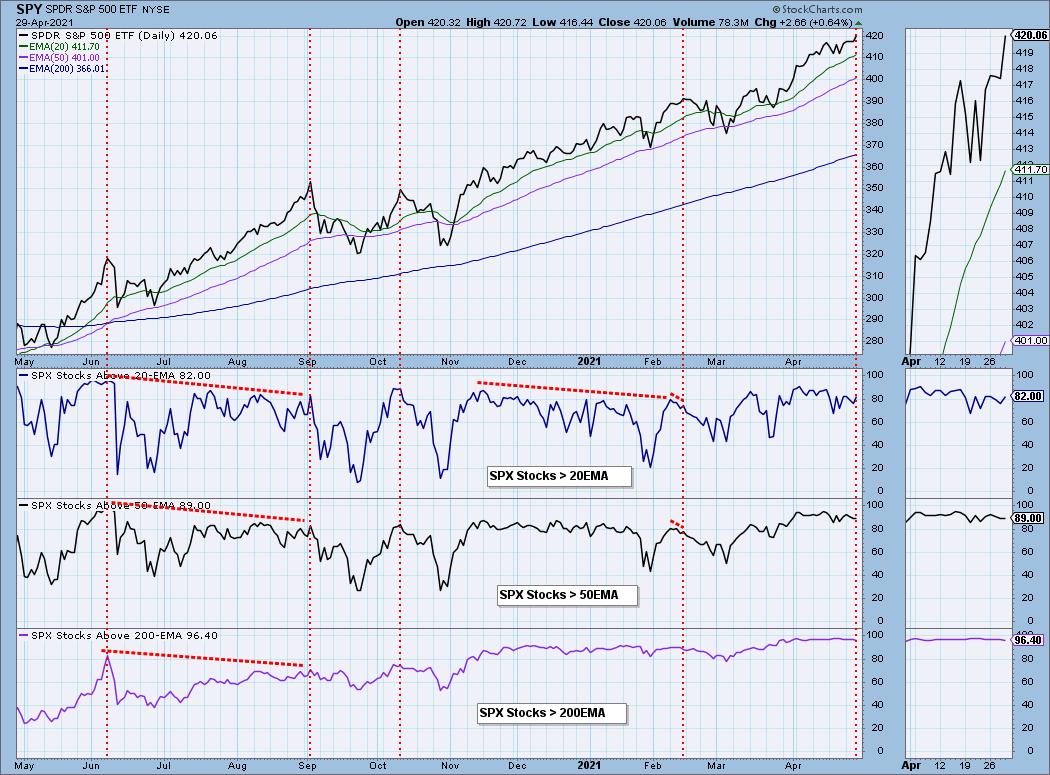
Participation did not improve in the intermediate to long terms as %Stocks > 50/200-EMAs fell today. We saw a slight increase in Stocks > 20-EMA.
Climax Analysis: It appears we had a mild upside climax as New Highs and Total Volume expanded and Net A-D came close to moving past the threshold for climaxes at +300. Net A-D Volume definitely did not confirm this. I also checked our volume ratios chart and there was nothing there to confirm this climax.
However, I do consider this a possible upside exhaustion climax, meaning we should see lower prices or a possible blow off.
The squeeze continues on the VIX so today's downside penetration of the lower Bollinger Band on the inverted scale isn't that meaningful.
Keep in mind: When the Bands squeeze it makes any penetration of the Bollinger Bands less useful since it is easy for them to punch through the upper Band one day and immediately puncture the bottom of the Band the next.
A Bollinger Band squeeze also signals that volatility is ahead. The Bands can't remain squeezed together and the only way to have them expand is on high volatility. I've never seen a VIX squeeze finish with a powerful thrust to the upside. High volatility is nearly always bad.
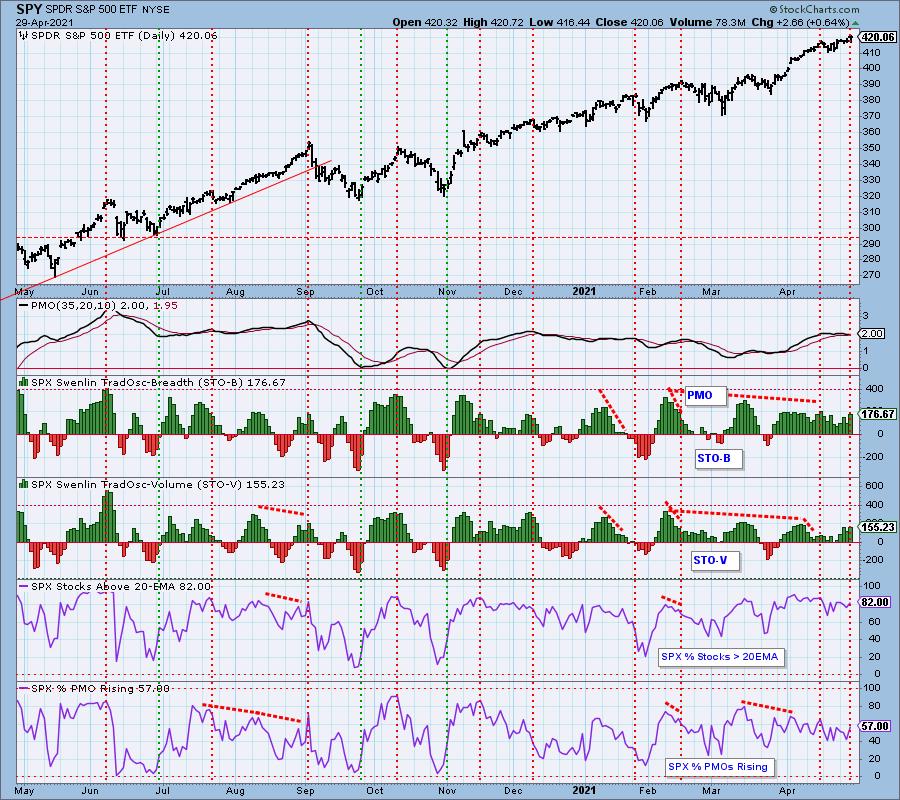
Short-Term Market Indicators: The short-term market trend is UP and the condition is NEUTRAL.
STOs are twitchy and unfortunately not that helpful right now. They did change direction and rise today which is positive. I also like seeing the big improvement on stocks with rising momentum. Still it is somewhat anemic at 57% given the strong breakout.
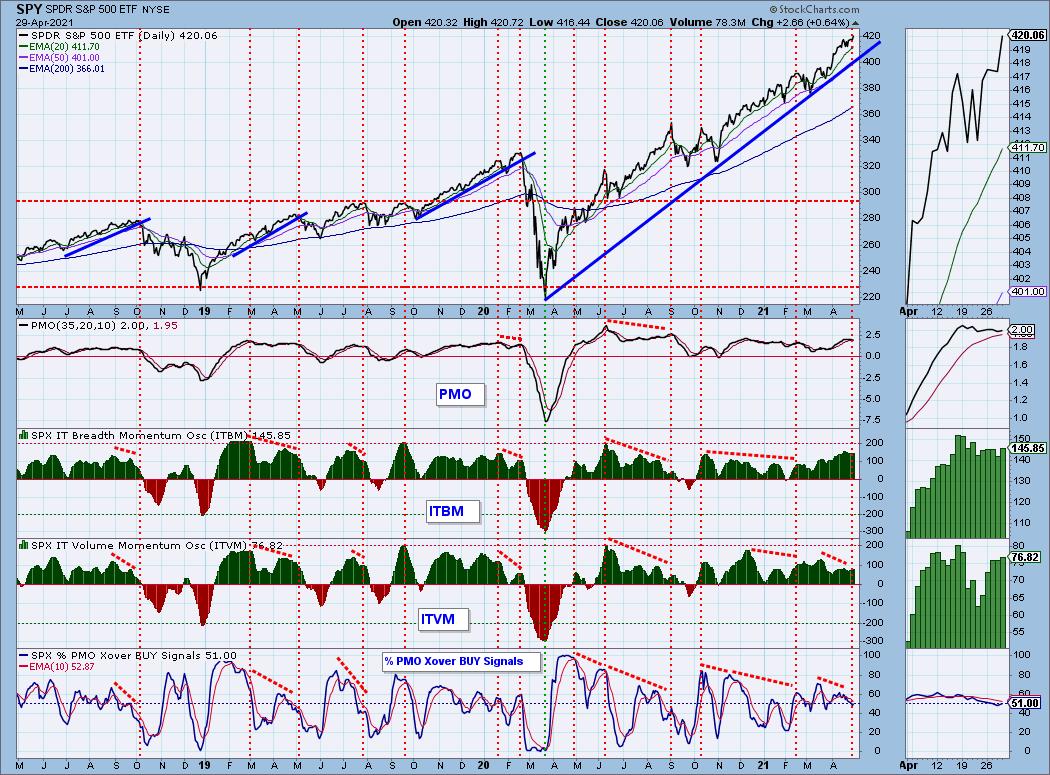
Intermediate-Term Market Indicators: The intermediate-term market trend is UP and the condition is OVERBOUGHT. The market bias is BULLISH.
In the thumbnail we can see both of these indicators turned back up, however, we have declining tops on all of the IT indicators and that has set up negative divergences with rising prices.
CONCLUSION: Today's earnings bonanza likely goosed price higher. We still have plenty of negative divergences and not much confirmation of these new all-time highs. The ST Climax chart suggests we have a possible exhaustion climax. Another crack in the foundation would be the drop in intermediate-term and long-term participation. I suspect we are looking at a developing blow off.
Have you subscribed the DecisionPoint Diamonds yet? DP does the work for you by providing handpicked stocks/ETFs from exclusive DP scans! Add it with a discount! Contact support@decisionpoint.com for more information!
BITCOIN
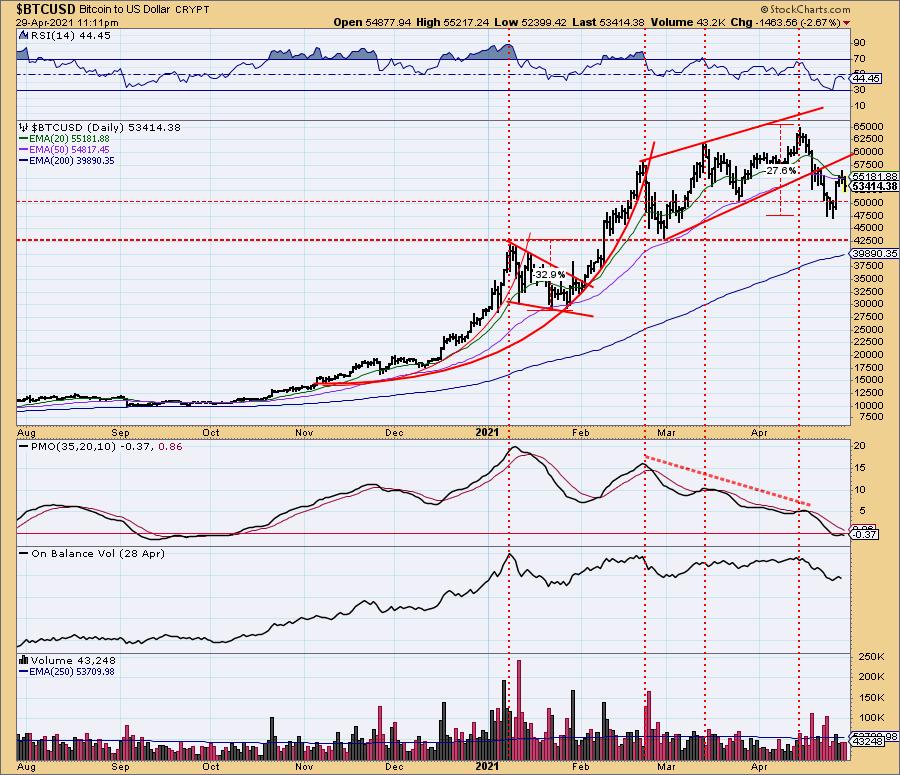
Bitcoin failed to overcome resistance at the 20-EMA. This tells me we have a bigger decline ahead. Notice the RSI turned down in negative territory and the PMO has turned down below the zero line. Bitcoin has held support at the 50-EMA since October of last year. It has held above the 200-EMA since May of 2020! This failure at the 20/50-EMAs suggests to me we will see a test of this month's bottom at a minimum, but more likely a trip to the 200-EMA.
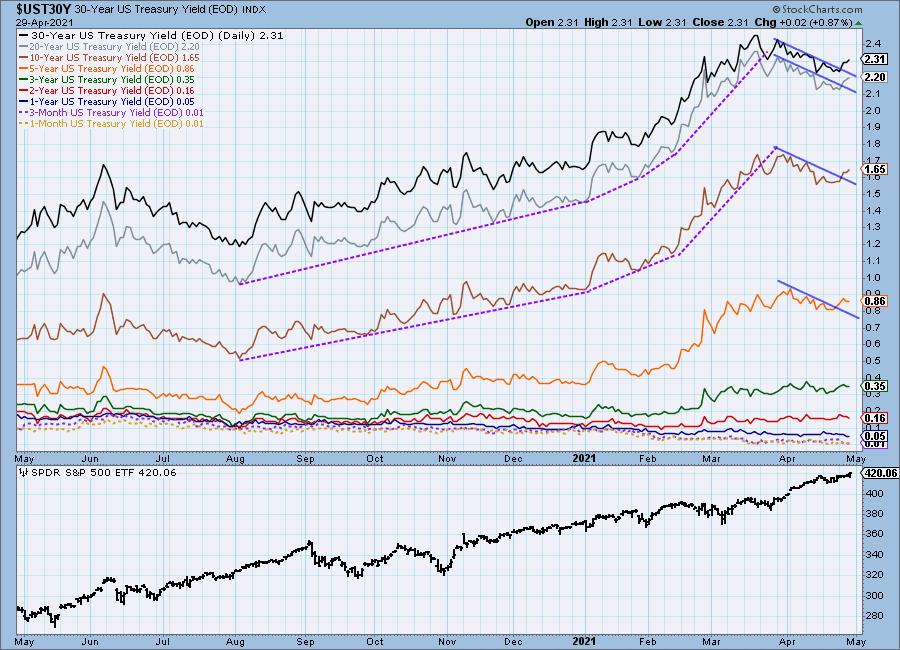
INTEREST RATES
Long-term rates are beginning to break their declining trends.
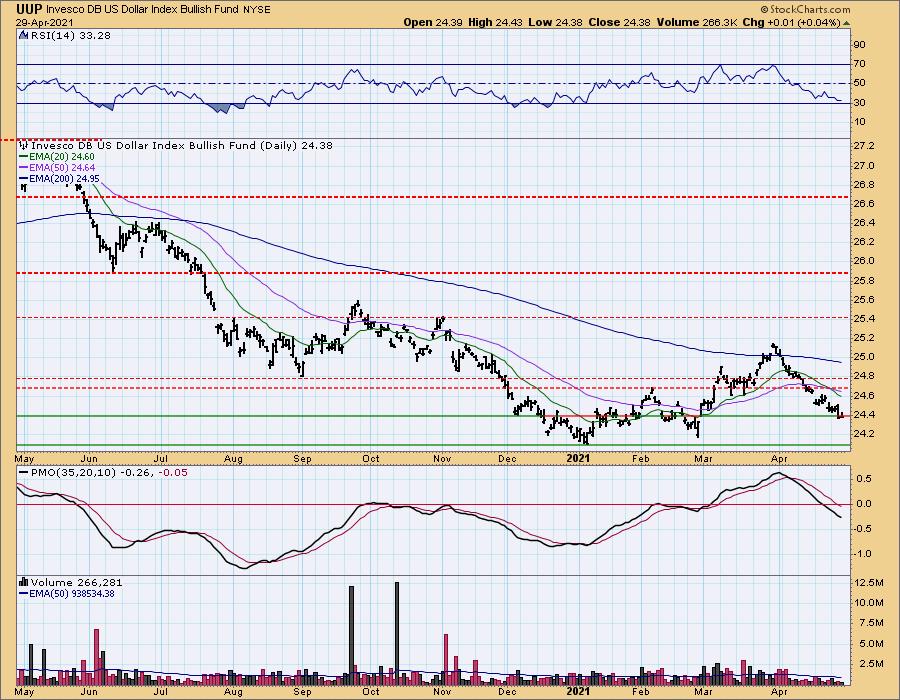
DOLLAR (UUP)
IT Trend Model: SELL as of 4/26/2021
LT Trend Model: SELL as of 7/10/2020
UUP Daily Chart: UUP was mostly unchanged today. The RSI is negative and not oversold yet and the PMO is in decline below the zero line.
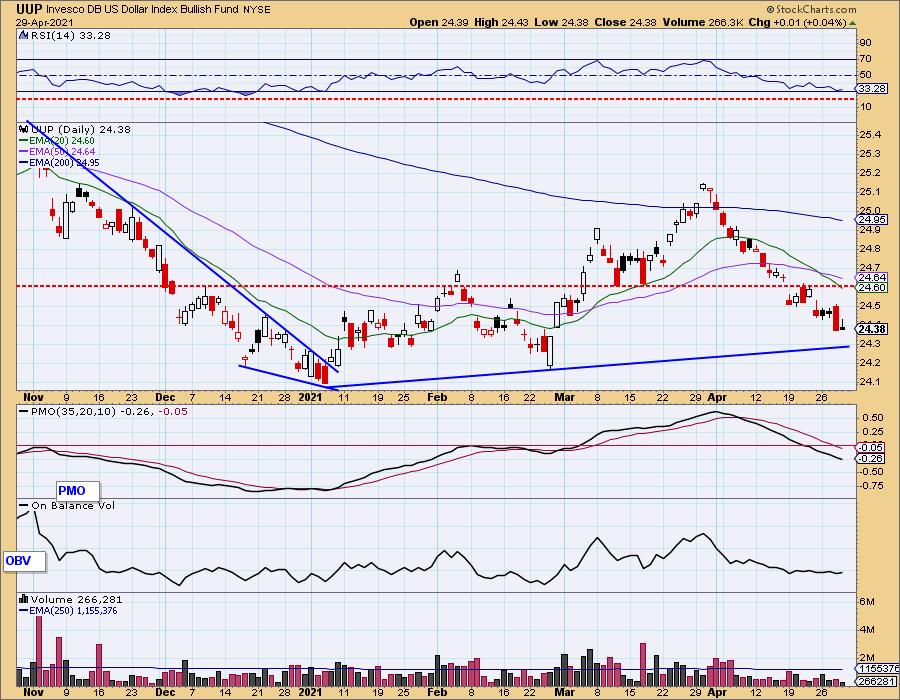
$24.40 was broken again today which leaves us looking at $24.10 as the next stopping point.
GOLD
IT Trend Model: NEUTRAL as of 1/13/2021
LT Trend Model: SELL as of 3/4/2021
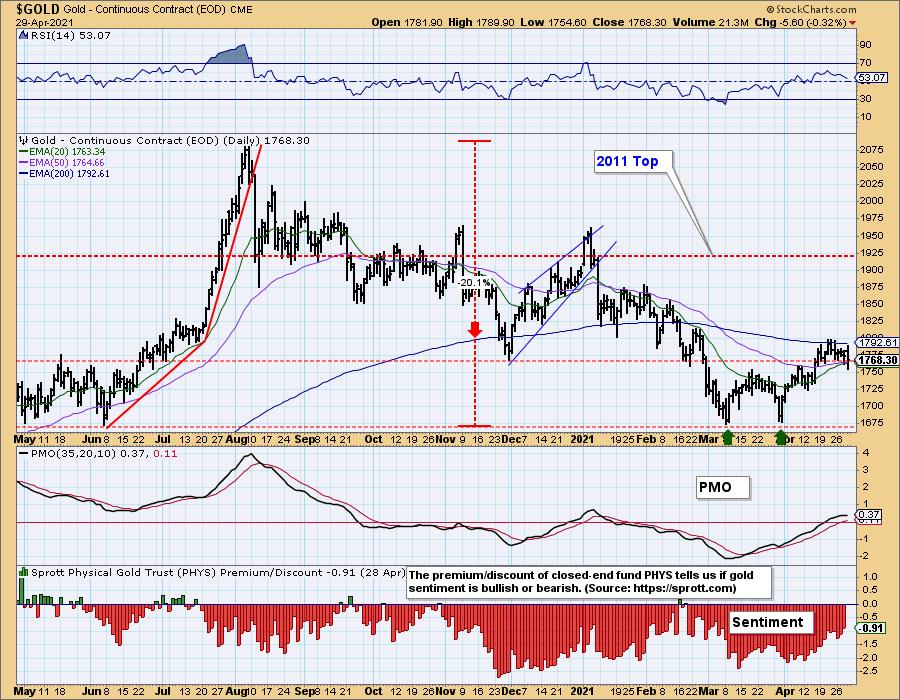
GLD Daily Chart: Gold is looking less attractive as it broke down from the bearish rising wedge yesterday. The 20-EMA hasn't given us a "silver cross" above the 50-EMA yet and if price can't maintain above the 50-EMA, we won't get it. The PMO is beginning to decelerate, but the RSI remains positive.
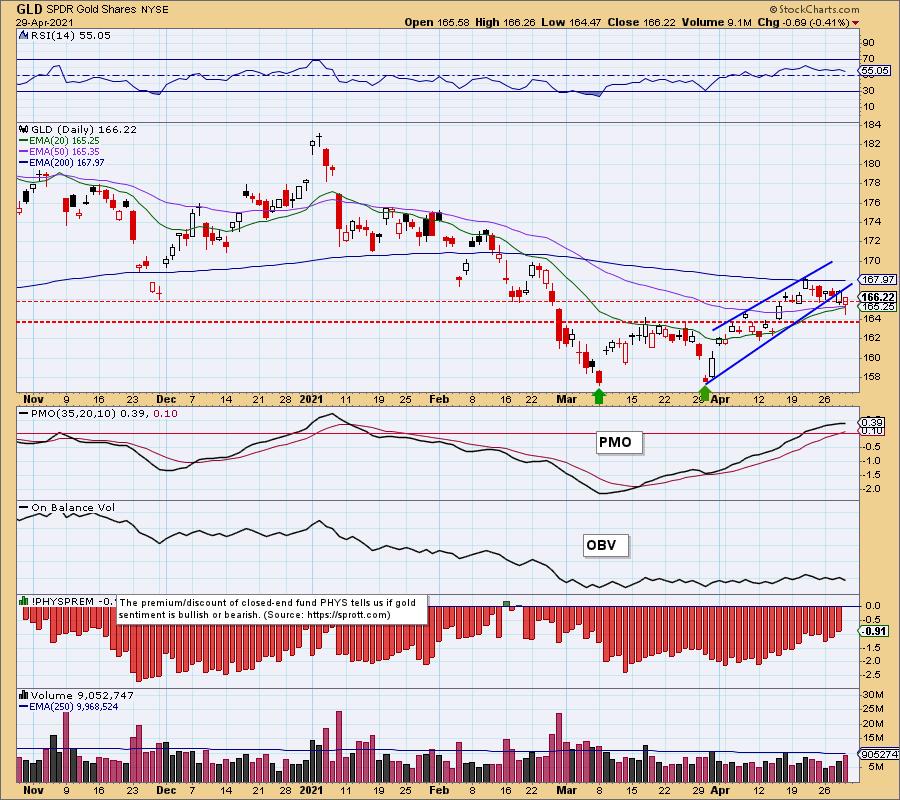
Discounts on PHYS contracted again today, suggesting participants are getting less bearish. The $1750 level seems a likely reversal point of this new declining trend, but by the time it reaches that level, the technicals aren't going to look good.
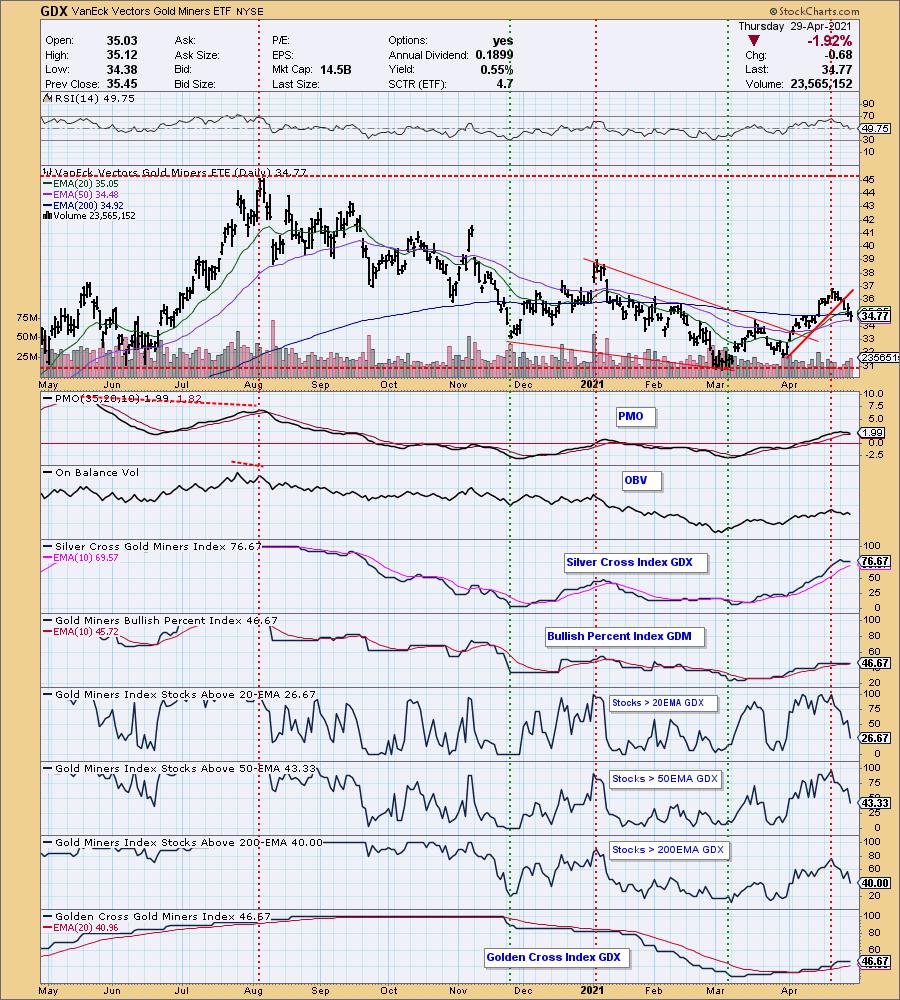
GOLD MINERS Golden and Silver Cross Indexes: Bad sign for GDX with price dropping below the 200-EMA. Given Gold is struggling, it will be difficult for Miners to recover. For now, there is one last hope, that price will stay above the confirmation line of the double-bottom around $34. We can see that participation is tumbling quickly.
CRUDE OIL (USO)
IT Trend Model: BUY as of 11/23/2020
LT Trend Model: BUY as of 3/9/2021
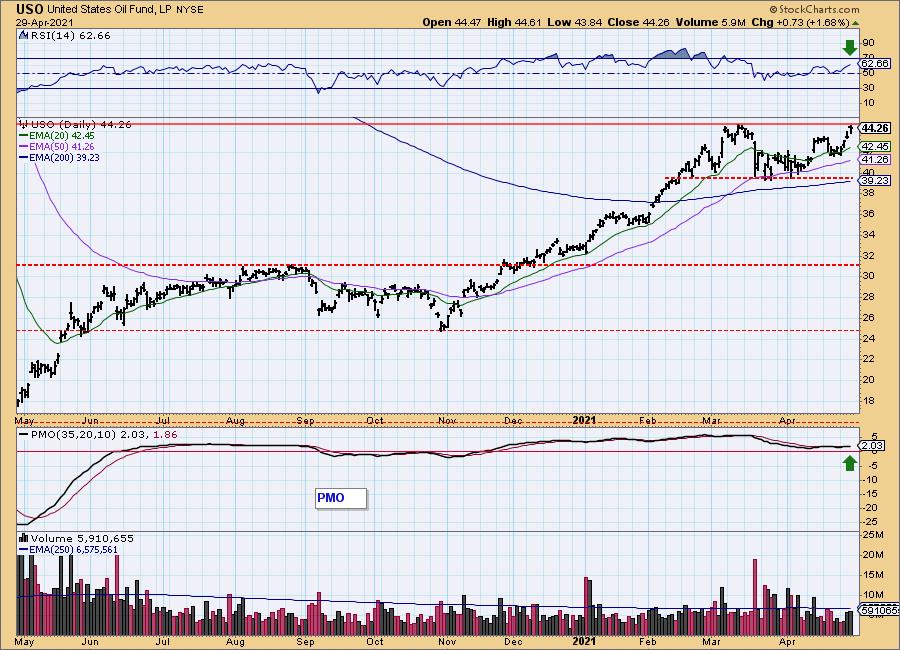
USO Daily Chart: USO is on its way to a breakout. The PMO and RSI are confirming this. The Energy sector is prospering and this is one of the reasons why.
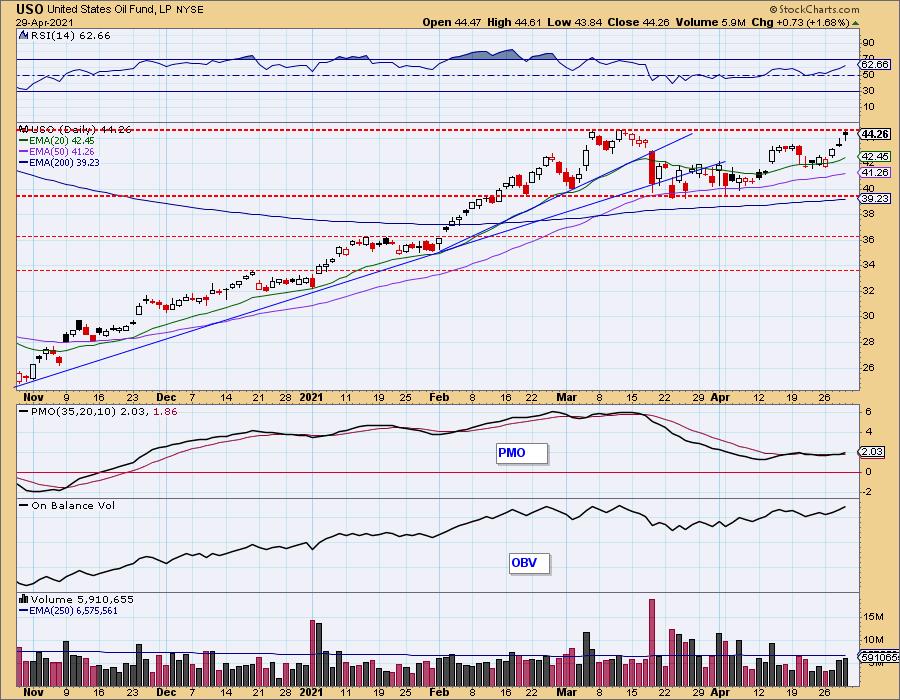
I'm looking for a breakout.
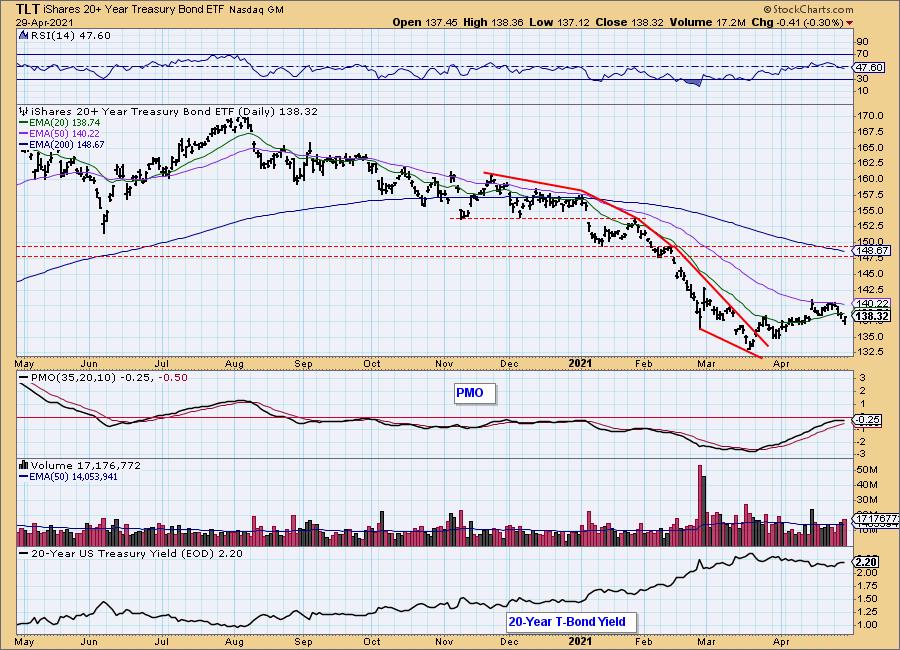
BONDS (TLT)
IT Trend Model: NEUTRAL as of 8/27/2020
LT Trend Model: SELL as of 1/8/2021
TLT Daily Chart: Candlestick studies failed us yesterday as the "hammer" candlestick did not result in a rally today. TLT continues lower as yields have broken their declining trend.
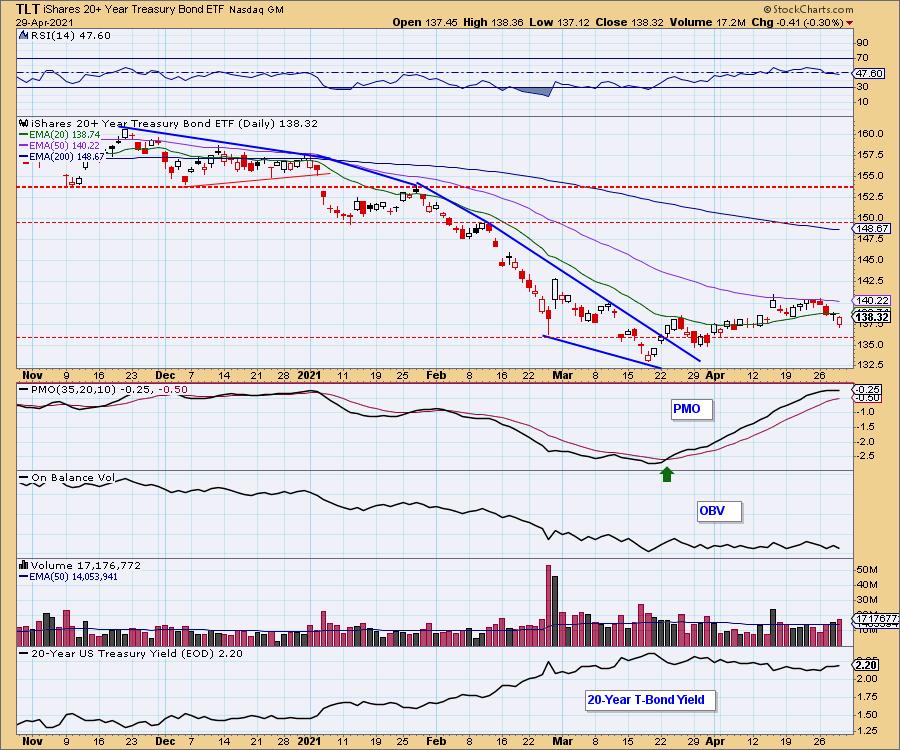
The PMO is now topping below the signal line and the RSI has moved into negative territory below net neutral (50). With the loss of the 20-EMA as support, we now should look for a decline to the $135.
Happy Charting!
Erin Swenlin
Technical Analysis is a windsock, not a crystal ball.
Disclaimer: This blog is for educational purposes only and should not be construed as financial advice. The ideas and strategies should never be used without first assessing your own personal and financial situation, or without consulting a financial professional. Any opinions expressed herein are solely those of the author, and do not in any way represent the views or opinions of any other person or entity.
NOTE: The signal status reported herein is based upon mechanical trading model signals, specifically, the DecisionPoint Trend Model. They define the implied bias of the price index based upon moving average relationships, but they do not necessarily call for a specific action. They are information flags that should prompt chart review. Further, they do not call for continuous buying or selling during the life of the signal. For example, a BUY signal will probably (but not necessarily) return the best results if action is taken soon after the signal is generated. Additional opportunities for buying may be found as price zigzags higher, but the trader must look for optimum entry points. Conversely, exit points to preserve gains (or minimize losses) may be evident before the model mechanically closes the signal.
Helpful DecisionPoint Links:
DecisionPoint Alert Chart List
DecisionPoint Golden Cross/Silver Cross Index Chart List
DecisionPoint Sector Chart List
Price Momentum Oscillator (PMO)
Swenlin Trading Oscillators (STO-B and STO-V)
DecisionPoint is not a registered investment advisor. Investment and trading decisions are solely your responsibility. DecisionPoint newsletters, blogs or website materials should NOT be interpreted as a recommendation or solicitation to buy or sell any security or to take any specific action.