
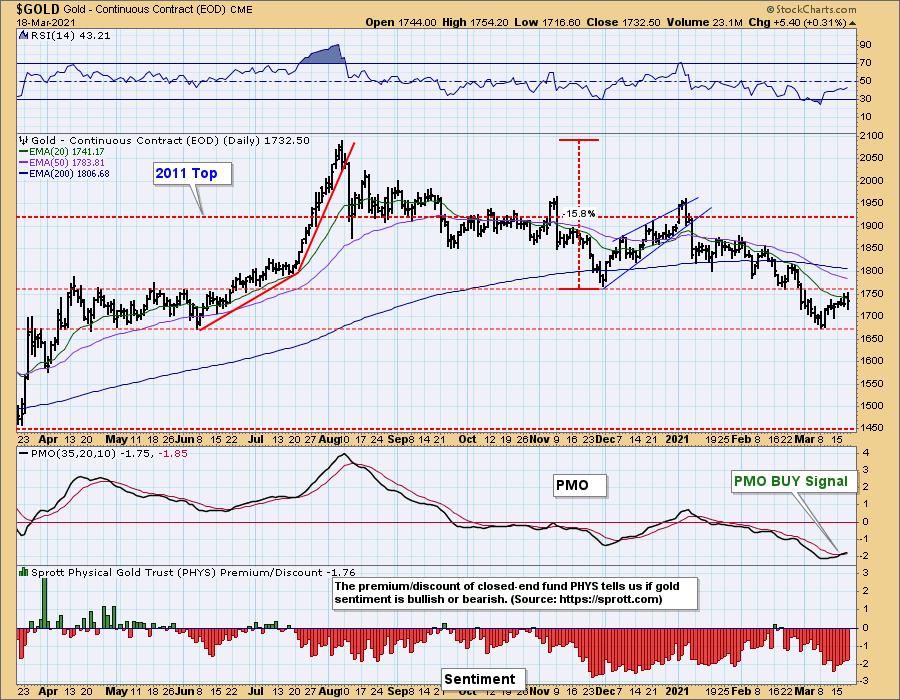
Yesterday I wrote about the new PMO SELL signal on USO. I didn't expect it to drop like a rock, but apparently the PMO did. Today, $GOLD triggered a PMO BUY signal. I still have difficulty trusting Gold right now. The RSI is negative, albeit rising somewhat. Price is struggling against resistance at the 20-EMA. Even if it vaults the 20-EMA, it has substantial resistance to deal with at the November low. Given the market is topping, I would expect to see a flight to Gold; however, that thesis has not held up this year.
This is Gold's chance to breakout and show strength. Just remember that Gold is on a "Death Cross". When the 50-EMA is below the 200-EMA, we should temper our bullish expectations. If we get a breakout above resistance, it will likely get held up at the 200-EMA.
The DecisionPoint Alert Weekly Wrap presents an end-of-week assessment of the trend and condition of the Stock Market, the U.S. Dollar, Gold, Crude Oil, and Bonds. The DecisionPoint Alert daily report (Monday through Thursday) is abbreviated and gives updates on the Weekly Wrap assessments.
Watch the latest episode of DecisionPoint on StockCharts TV's YouTube channel here!
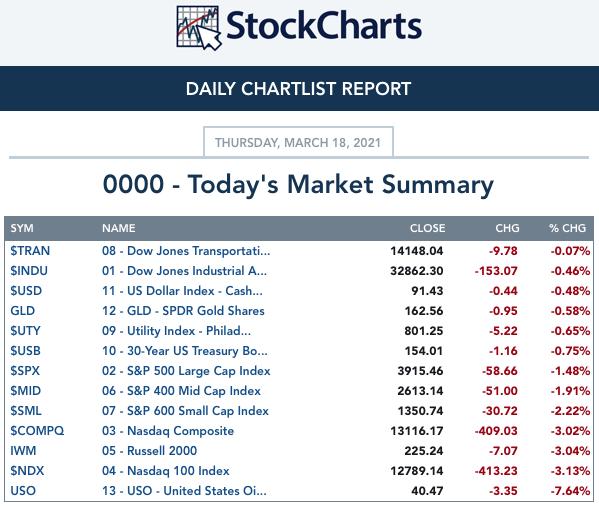
MAJOR MARKET INDEXES
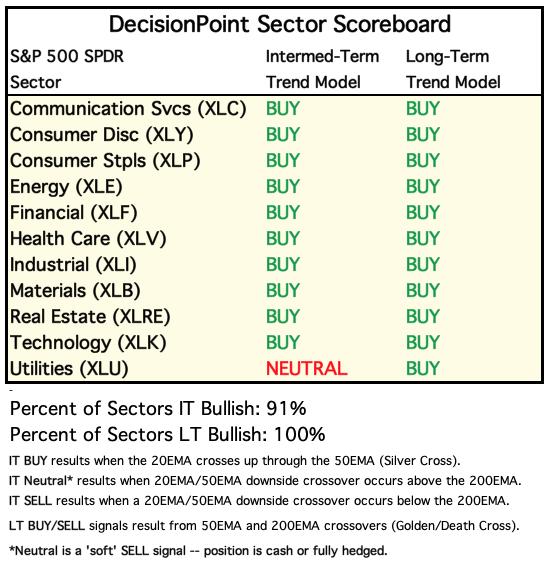
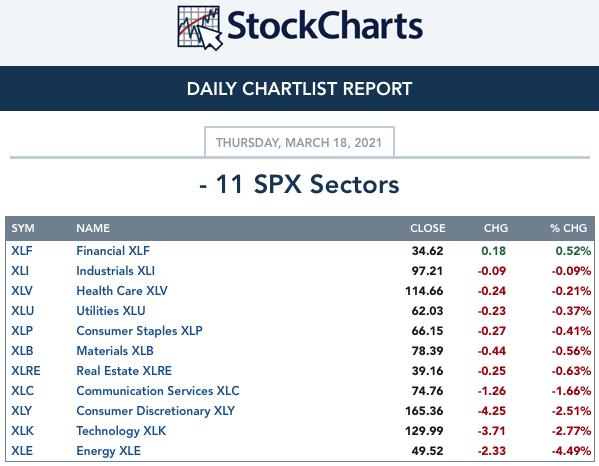
SECTORS
Each S&P 500 Index component stock is assigned to one, and only one, of 11 major sectors. This is a snapshot of the Intermediate-Term (Silver Cross) and Long-Term (Golden Cross) Trend Model signal status for those sectors.
CLICK HERE for Carl's annotated Sector charts.
THE MARKET (S&P 500)
IT Trend Model: BUY as of 5/8/2020
LT Trend Model: BUY as of 6/8/2020
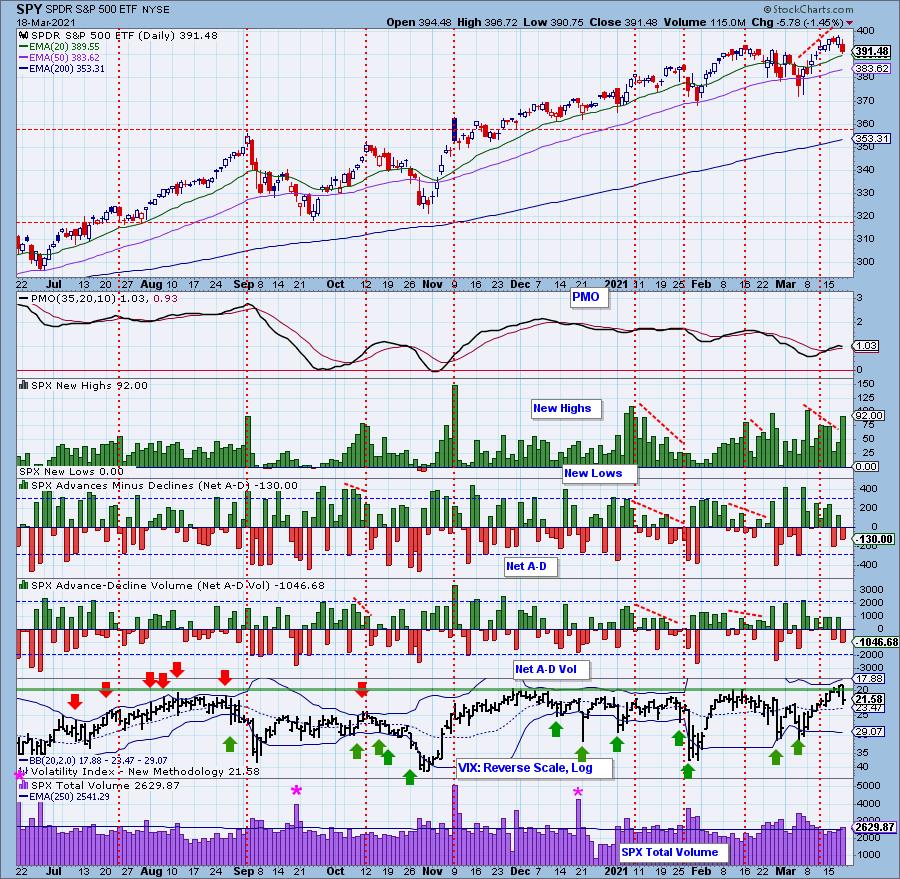
SPY Daily Chart: The market as broken the intermediate-term rising bottoms trendline. The 20-EMA is available as support, but given the topping PMO and negative divergences with both the PMO and OBV, we will likely see more decline.
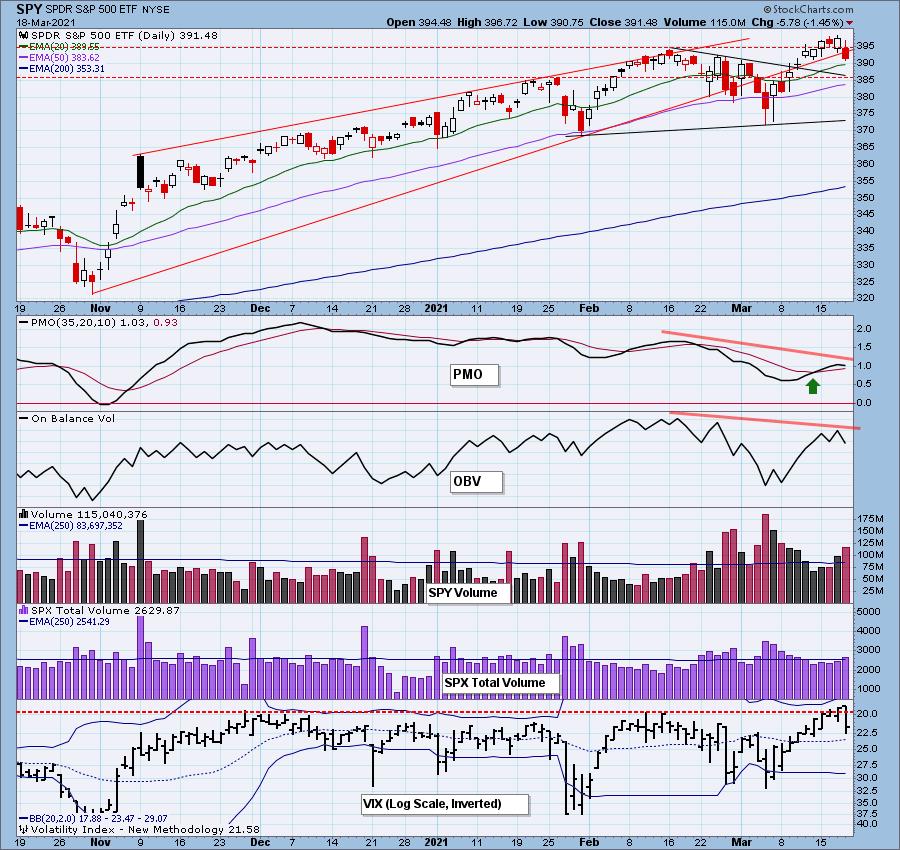
Notice that Total Volume has been increasing on this decline from the all-time highs which could mean we will see a pick up in selling. The RSI is failing and also sports a negative divergence with price.
Free DecisionPoint Trading Room on Mondays, Noon ET

*Click here to register for this recurring free DecisionPoint Trading Room on Mondays at Noon ET!*
=======================================
BELOW is a link to the 3/15 trading room recording:
Topic: DecisionPoint Trading Room
Start Time : Mar 15, 2021 09:00 AM
DP Trading Room RECORDING Link
Access Passcode: 0f$2Pf5z
For best results, copy and paste the access code to avoid typos.
Participation: The following chart uses different methodologies for objectively showing the depth and trend of participation for intermediate- and long-term time frames.
- The Silver Cross Index (SCI) shows the percentage of SPX stocks on IT Trend Model BUY signals (20-EMA > 50-EMA).
- The Golden Cross Index (GCI) shows the percentage of SPX stocks on LT Trend Model BUY signals (50-EMA > 200-EMA).
- The Bullish Percent Index (BPI) shows the percentage of SPX stocks on Point & Figure BUY signals.
The SCI has not yet topped. It is trying to clear the current negative divergence. The GCI was unchanged but still holds a negative divergence as it topped earlier this week. The last time this happened, it preceded the bear market. The BPI topped sealing the negative divergence in the intermediate term.
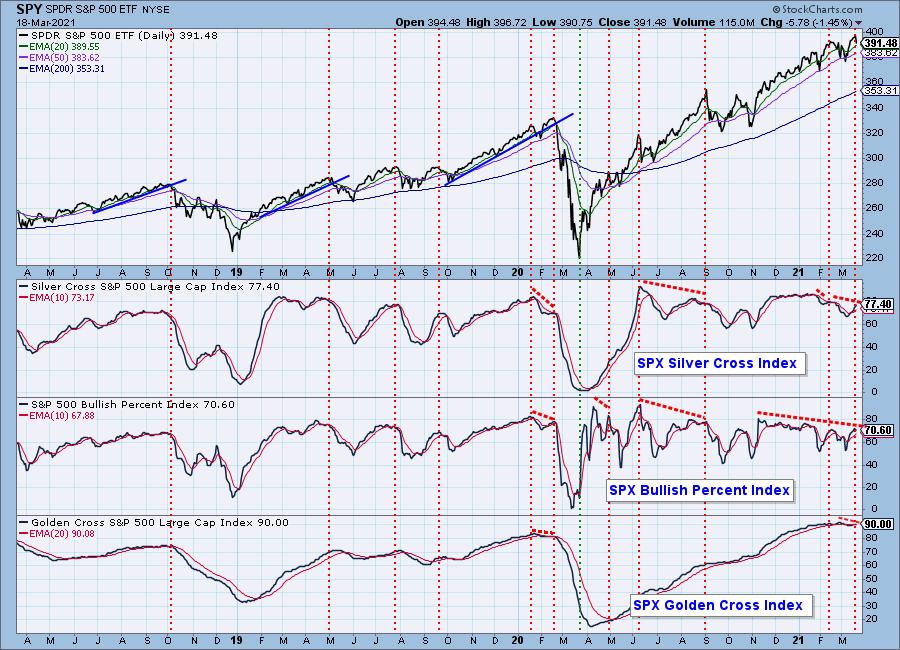
Not surprisingly participation pulled back on today's decline. Despite that they are still in overbought territory.
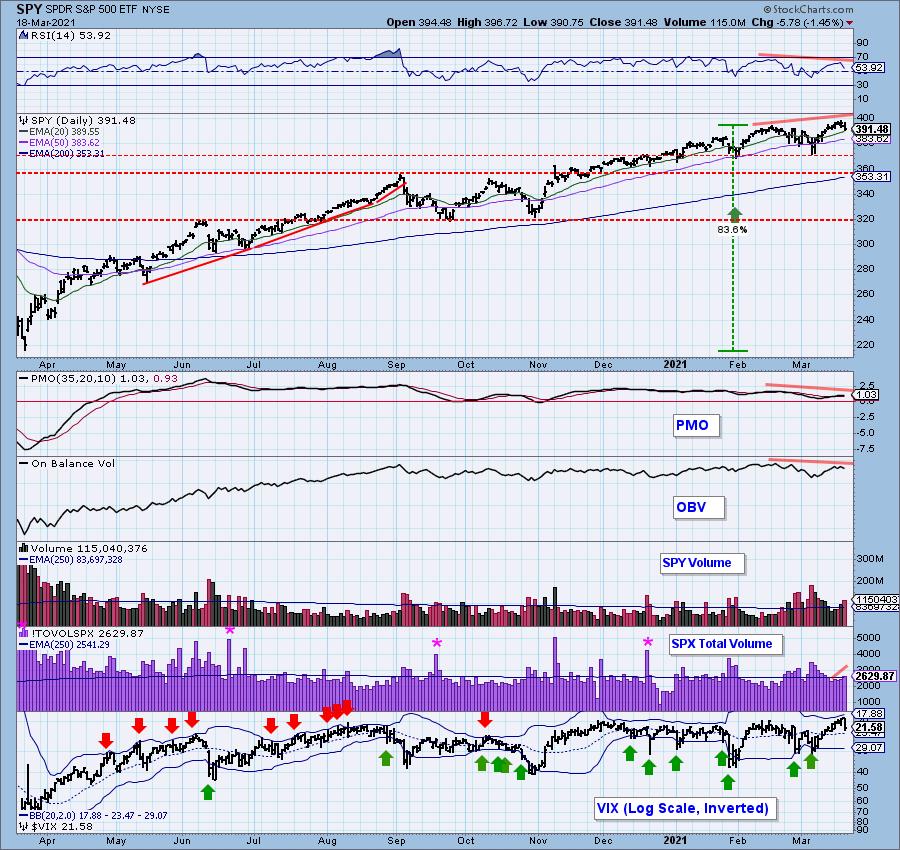
Climactic Market Indicators: There was an increase in New Highs today which is interesting given today's market action. We didn't see climactic readings elsewhere. The VIX pulled back from overbought territory on the inverted scale. It did not have to puncture the upper Bollinger Band before declining. It remains above its EMA, but I would expect to see more downside given its pullback from overbought territory.
Friday is quadruple witching so expect high volume. You'll note the pink "*" over prior quadruple witching days.
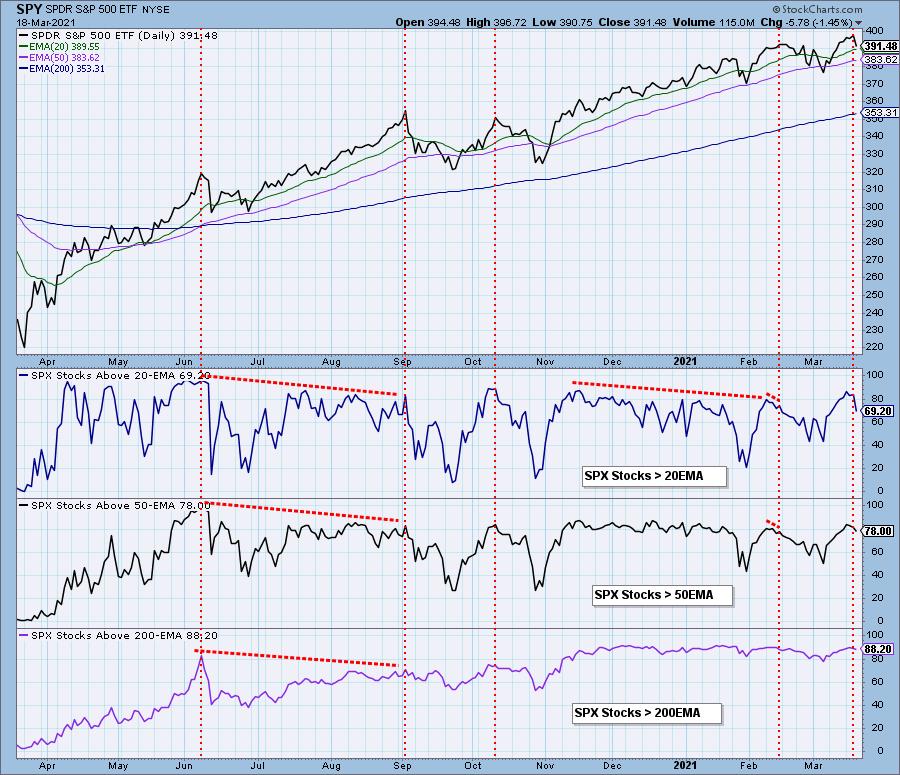
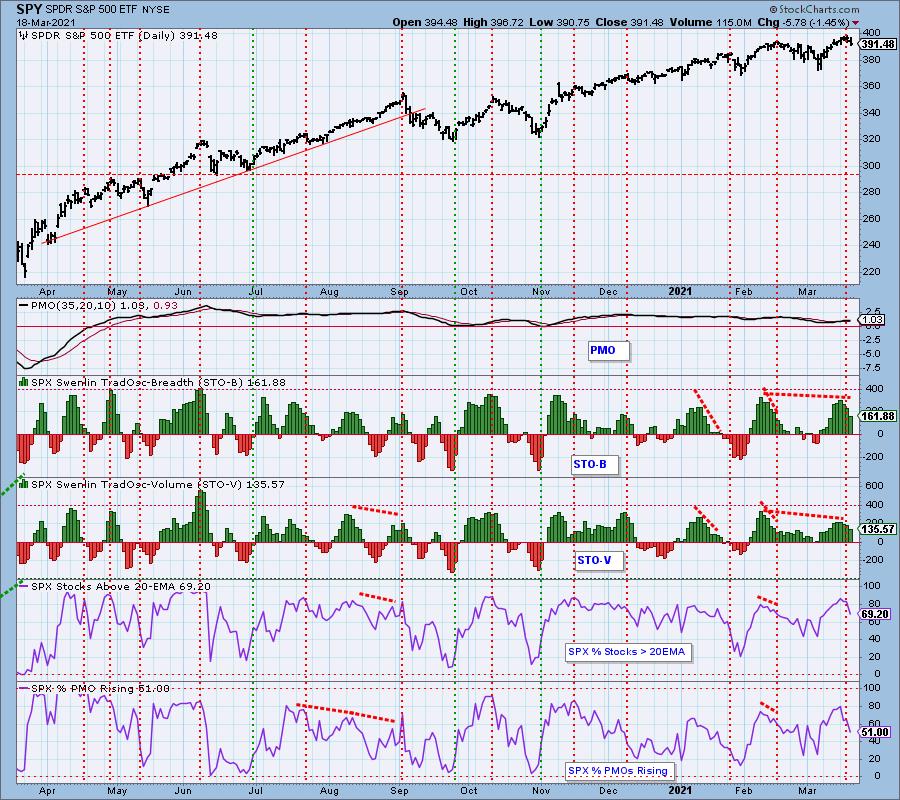
Short-Term Market Indicators: The short-term market trend is DOWN and the condition is SOMEWHAT OVERBOUGHT.
The STOs and %Stocks indicators are confirming this decline. Until they turn back up, I am expecting lower prices.
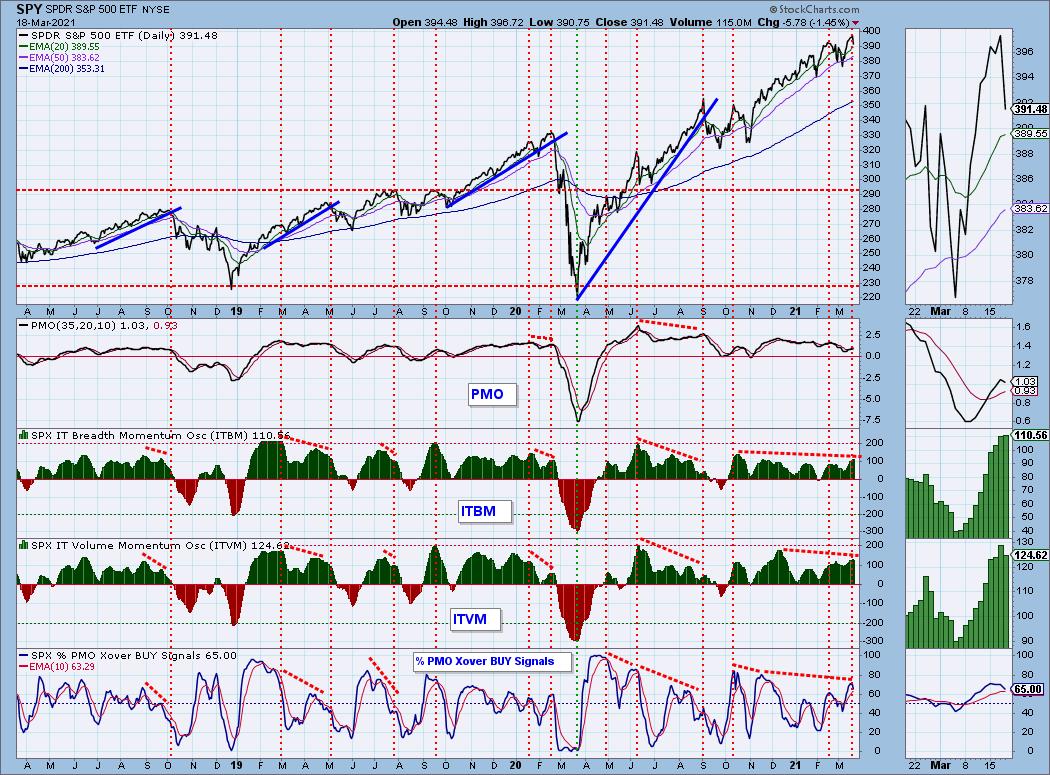
Intermediate-Term Market Indicators: The intermediate-term market trend is UP and the condition is OVERBOUGHT. The intermediate-term market bias is BULLISH.
Mixed messages on the ITBM/ITVM today. The ITBM crept a bit higher, while the ITVM topped. Both indicators are very overbought. I would expect to see a contraction in %PMO Crossover BUY signals today. All of these indicators are carrying negative divergences with price.
CONCLUSION: The market is finally topping and the indicators in all timeframes suggest we will see more decline. The VIX has topped and that nearly always leads to lower prices in the short term. How deep will the decline be? I would expect a test of the 50-EMA at a minimum which would put price at $384 on the SPY.
** Don't forget! It is quadruple witching on Friday. Options expiration generally comes with heavy volume and little price movement.
Have you subscribed the DecisionPoint Diamonds yet? DP does the work for you by providing handpicked stocks/ETFs from exclusive DP scans! Add it with a discount! Contact support@decisionpoint.com for more information!
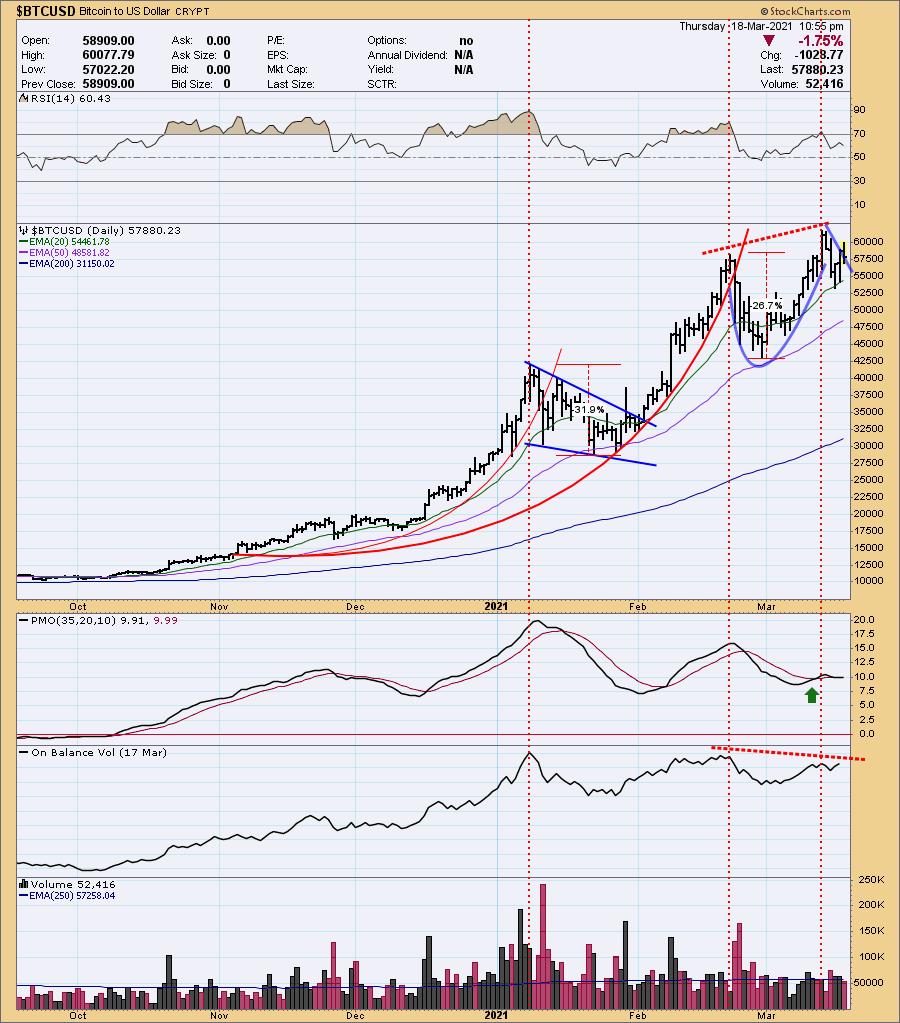
BITCOIN
The cup and handle pattern could be executing with the recent breakout from the 'handle'. The PMO is still on a SELL signal and there is an OBV negative divergence so I'm not expecting new all-time highs just yet.
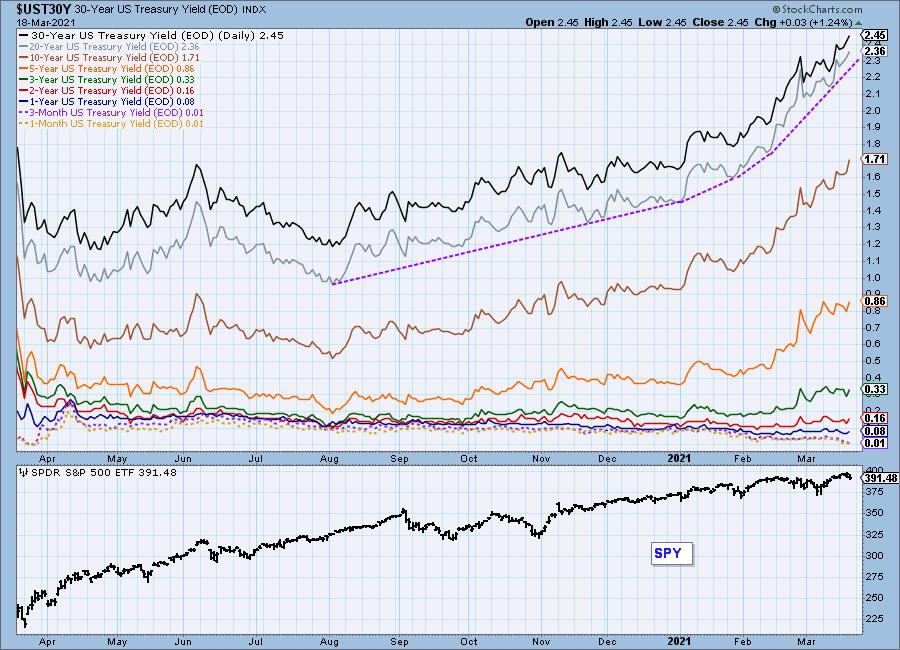
INTEREST RATES
The rising trend remains on interest rates which will continue to put pressure on Bonds.
DOLLAR (UUP)
IT Trend Model: NEUTRAL as of 5/28/2020
LT Trend Model: SELL as of 7/10/2020
UUP Daily Chart: The Dollar was up today and that has moved the PMO and RSI higher. I don't like that price has attempted numerous times to pass resistance at $24.80 to no avail; it simply is not confirming the positive indicators. The OBV is confirming the decline. Remember I mentioned earlier that when the 50-EMA is below the 200-EMA, we need to temper bullish expectations. This is a great example. Despite positive indicators, price is not breaking out.
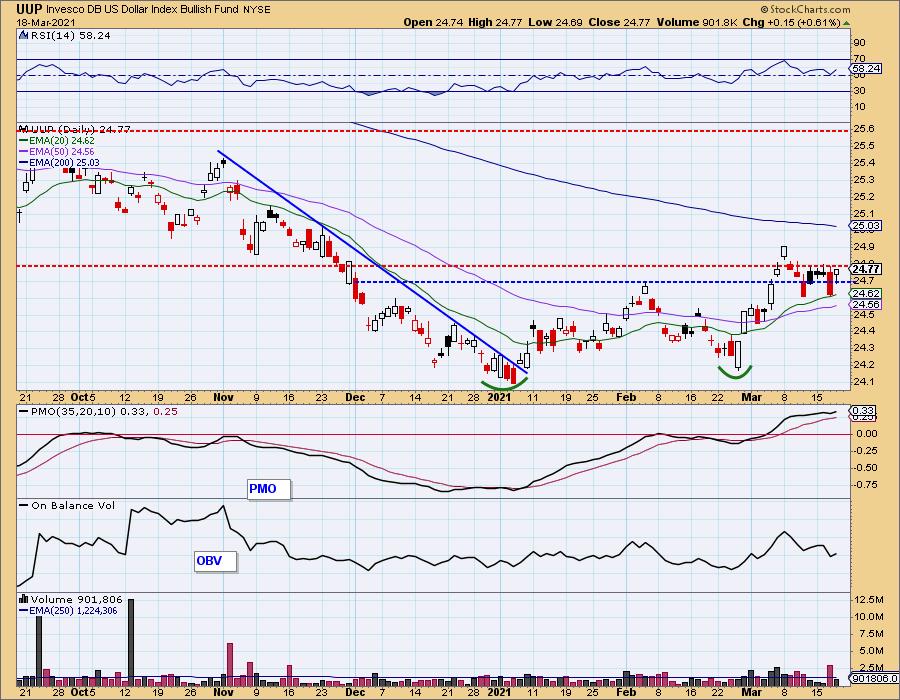
The $24.80 level is important as it lines up with resistance at the September low. There is a double-bottom, but given the failure to hold a breakout above the confirmation line, we're likely going to see a breakdown.
GOLD
IT Trend Model: NEUTRAL as of 1/14/2021
LT Trend Model: SELL as of 3/4/2021
GLD Daily Chart: You'll note that GLD gave us a PMO crossover BUY signal yesterday. Price failed to get above the 20-EMA and turned lower. We now have a short-term rising wedge. The RSI is setting up shop below net neutral (50). I have a hard time trusting this BUY signal.
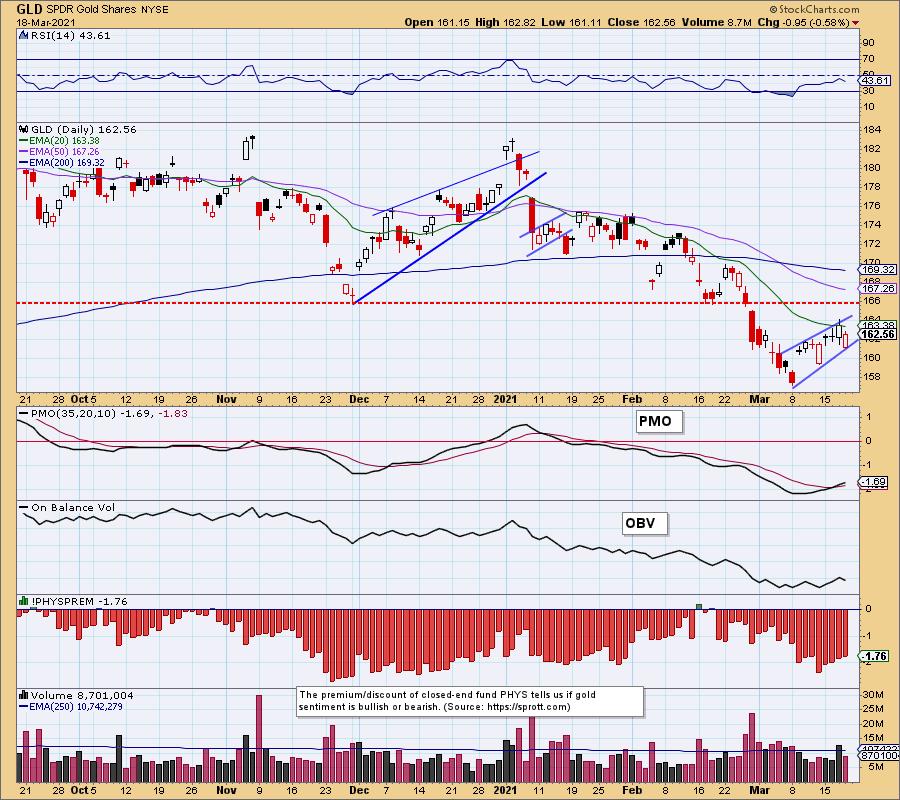
Full disclosure: I own GLD.
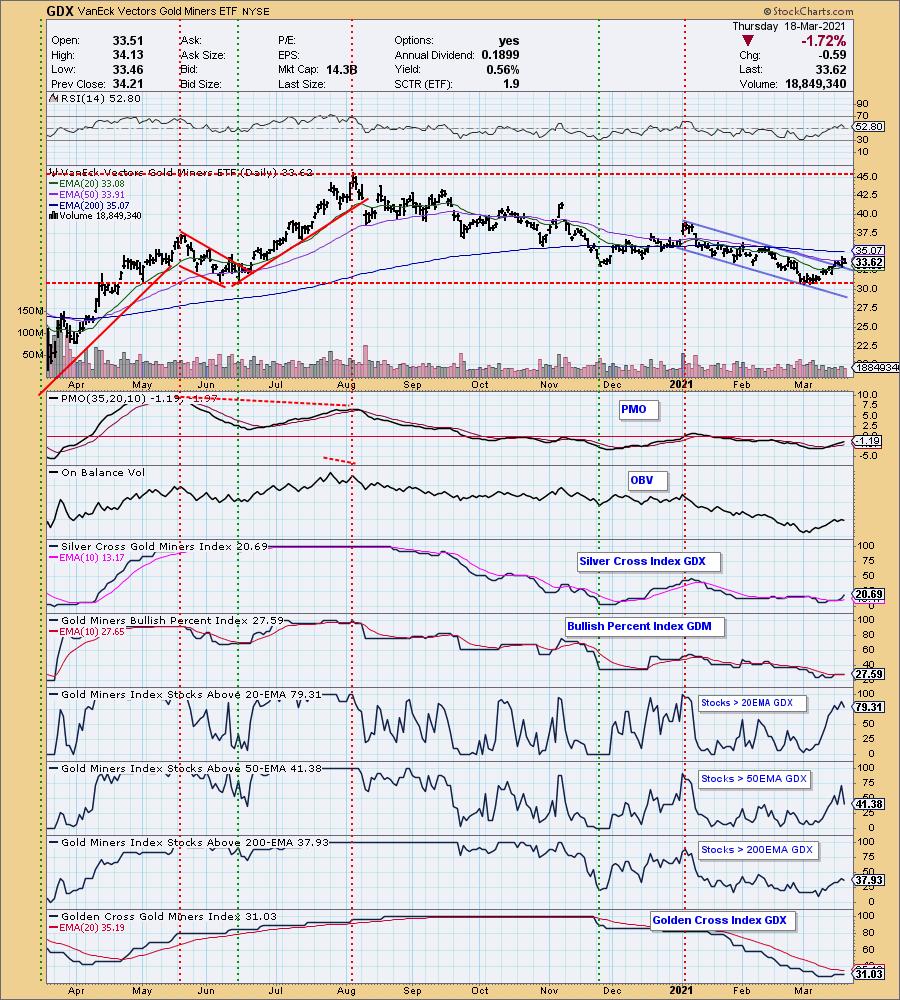
GOLD MINERS Golden and Silver Cross Indexes: Miners pulled back today. The SCI is beginning to improve and participation in the short-term is at 79%. At issue is Gold which is applying pressure every time it declines. The market itself is topping and that also is working against Gold Miners. They are showing promise off this current rally and breakout from the declining trend channel. The RSI is positive and the PMO continues to rise so I'm looking for a test of the 200-EMA.
CRUDE OIL (USO)
IT Trend Model: BUY as of 10/20/2020
LT Trend Model: SELL as of 2/3/2020
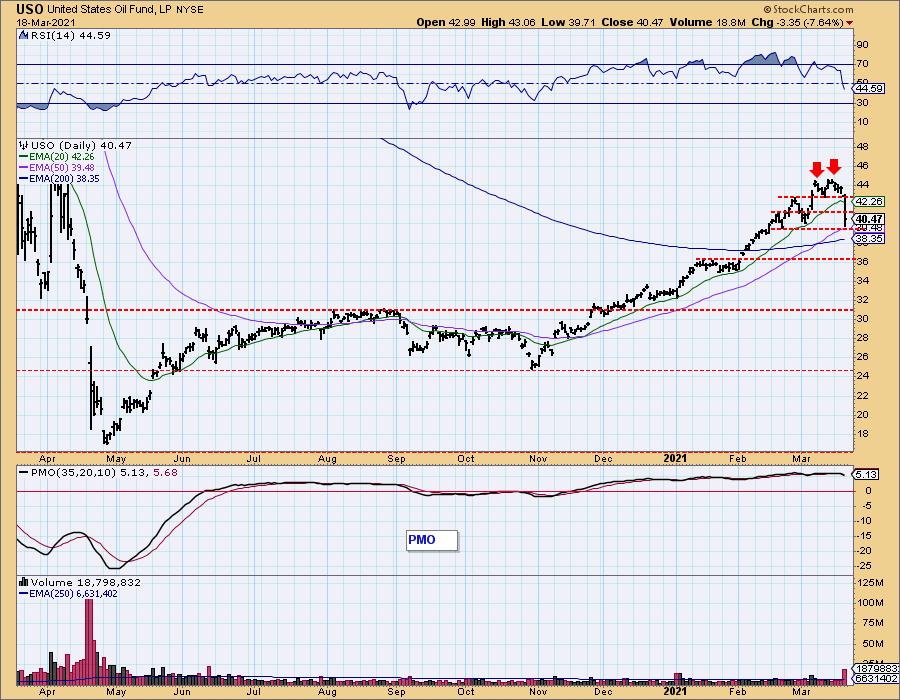
USO Daily Chart: I was looking for a decline to the 20-EMA, but said that at the very least it should find support at the 50-EMA. A giant 7.64% drop today brought price to the 50-EMA in one giant fall. The RSI is now negative and the PMO continues lower on yesterday's SELL signal. I would expect this level to hold as support but given the climactic move on volume, we may need a test of the 200-EMA and possibly the $36. This pullback was needed. My sense is that this is more than likely an exhaustion climax. However, I wouldn't try to catch this falling knife.
BONDS (TLT)
IT Trend Model: NEUTRAL as of 8/27/2020
LT Trend Model: SELL as of 1/8/2021
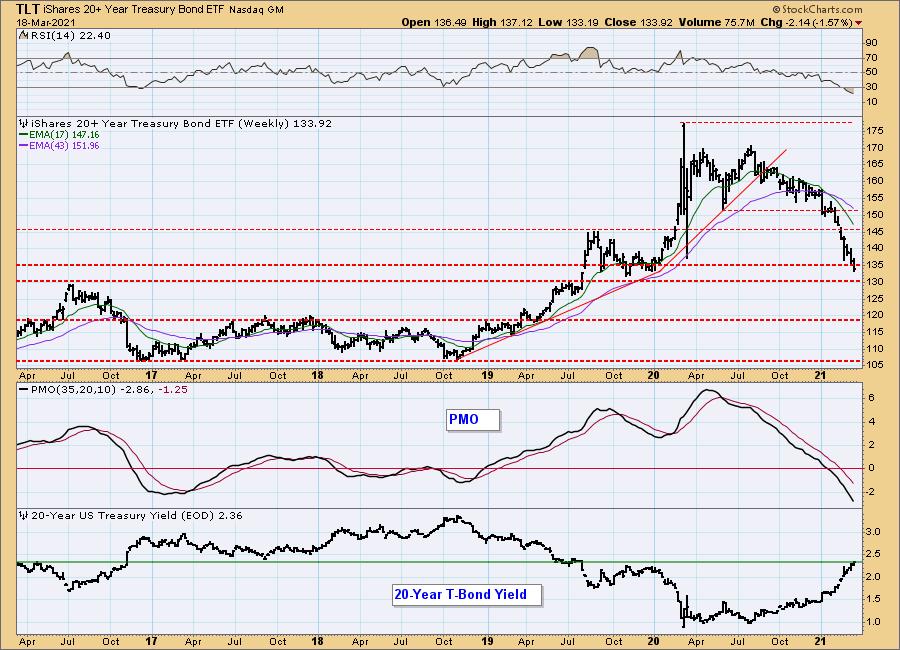
TLT Daily Chart: Yesterday's comments still apply:
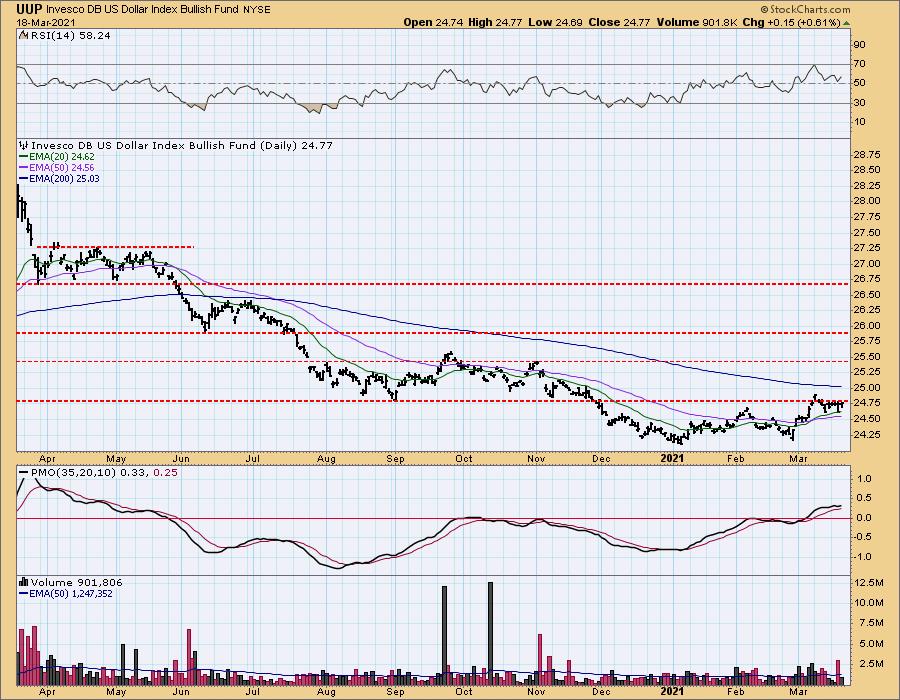
"Yields continue to rise and put pressure on Bonds. The six-month chart below doesn't even show a support level."
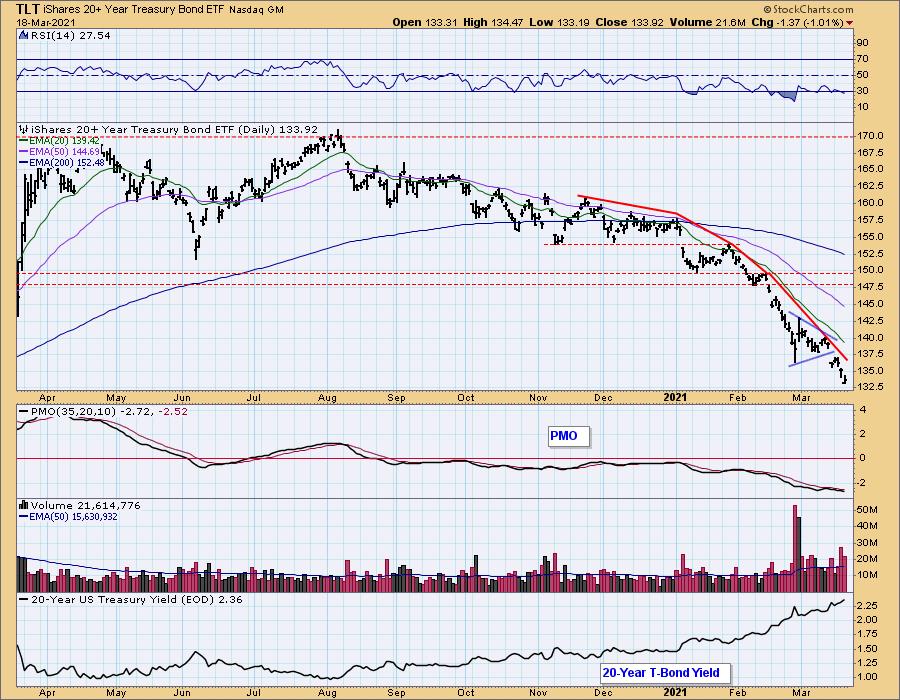
"We have to use the weekly chart to find the next support levels. Currently price has reached a support zone between $130 and $135. There is a good chance this level will hold. Notice that yields have reached overhead resistance. They may finally ease up and give TLT the opportunity to reverse at $130. If yields breakout, then TLT will likely drop to the next support level at $120. Bonds are not a good investment right now."
Technical Analysis is a windsock, not a crystal ball.
Happy Charting! - Erin
Disclaimer: This blog is for educational purposes only and should not be construed as financial advice. The ideas and strategies should never be used without first assessing your own personal and financial situation, or without consulting a financial professional. Any opinions expressed herein are solely those of the author, and do not in any way represent the views or opinions of any other person or entity.
NOTE: The signal status reported herein is based upon mechanical trading model signals, specifically, the DecisionPoint Trend Model. They define the implied bias of the price index based upon moving average relationships, but they do not necessarily call for a specific action. They are information flags that should prompt chart review. Further, they do not call for continuous buying or selling during the life of the signal. For example, a BUY signal will probably (but not necessarily) return the best results if action is taken soon after the signal is generated. Additional opportunities for buying may be found as price zigzags higher, but the trader must look for optimum entry points. Conversely, exit points to preserve gains (or minimize losses) may be evident before the model mechanically closes the signal.
Helpful DecisionPoint Links:
DecisionPoint Alert Chart List
DecisionPoint Golden Cross/Silver Cross Index Chart List
DecisionPoint Sector Chart List
Price Momentum Oscillator (PMO)
Swenlin Trading Oscillators (STO-B and STO-V)
DecisionPoint is not a registered investment advisor. Investment and trading decisions are solely your responsibility. DecisionPoint newsletters, blogs, trading rooms or website materials should NOT be interpreted as a recommendation or solicitation to buy or sell any security or to take any specific action.