
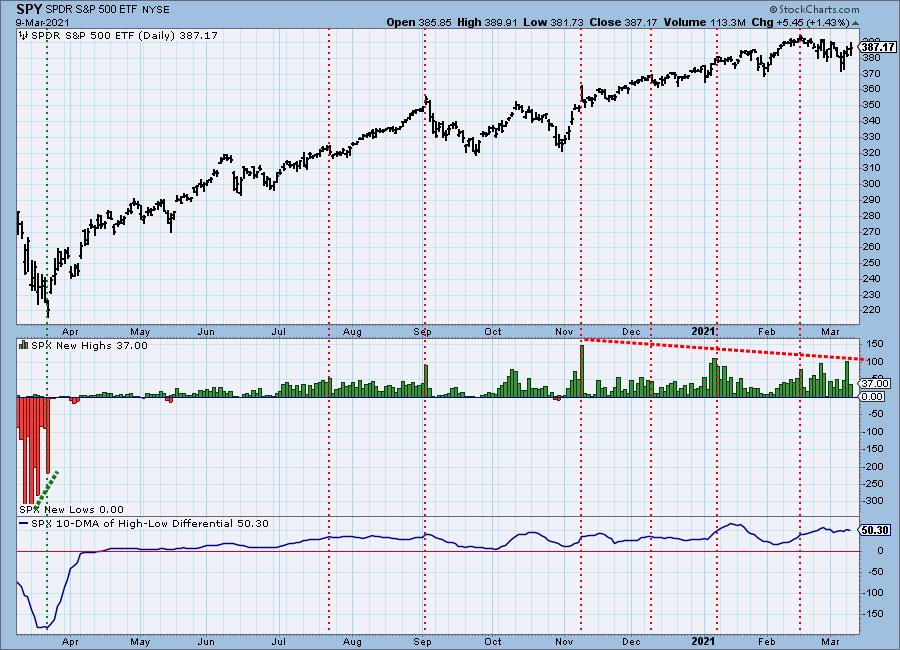
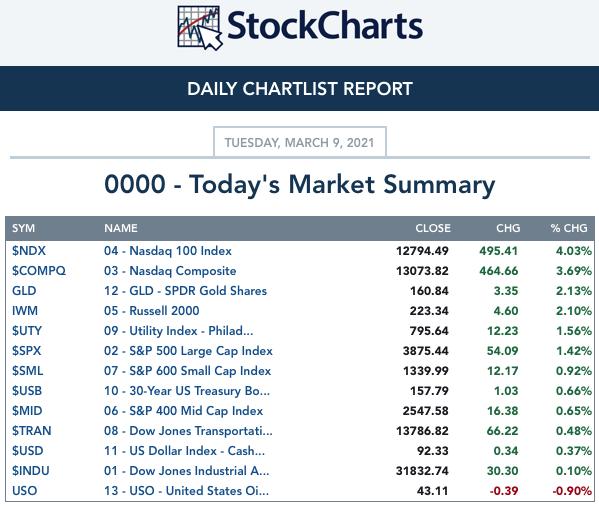
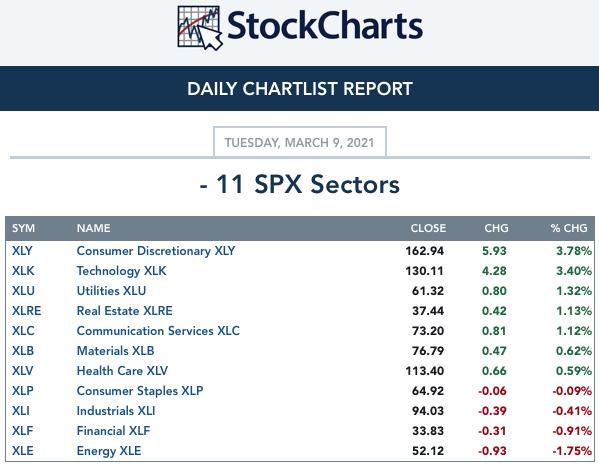
The market rallied strongly on the back of Technology and Consumer Discretionary sectors. However, the defensive Utilities sector also rallied. It is important to note that New Highs continue to trend downward. Today saw much fewer New Highs even on the heels of a +1.43% gain in the market. It isn't likely that we are out of the woods. Just tap into your memory of yesterday and the bearish pallor of the market. Today was a great rally day, but curb your appetite for expanding your portfolio in the aggressive areas of the market. Diamonds subscribers received the names of some very strong stocks in the Utilities and Consumer Staples sectors that should continue to outperform the market.
The DecisionPoint Alert Weekly Wrap presents an end-of-week assessment of the trend and condition of the Stock Market, the U.S. Dollar, Gold, Crude Oil, and Bonds. The DecisionPoint Alert daily report (Monday through Thursday) is abbreviated and gives updates on the Weekly Wrap assessments.
Watch the latest episode of DecisionPoint on StockCharts TV's YouTube channel here!
MAJOR MARKET INDEXES
SECTORS
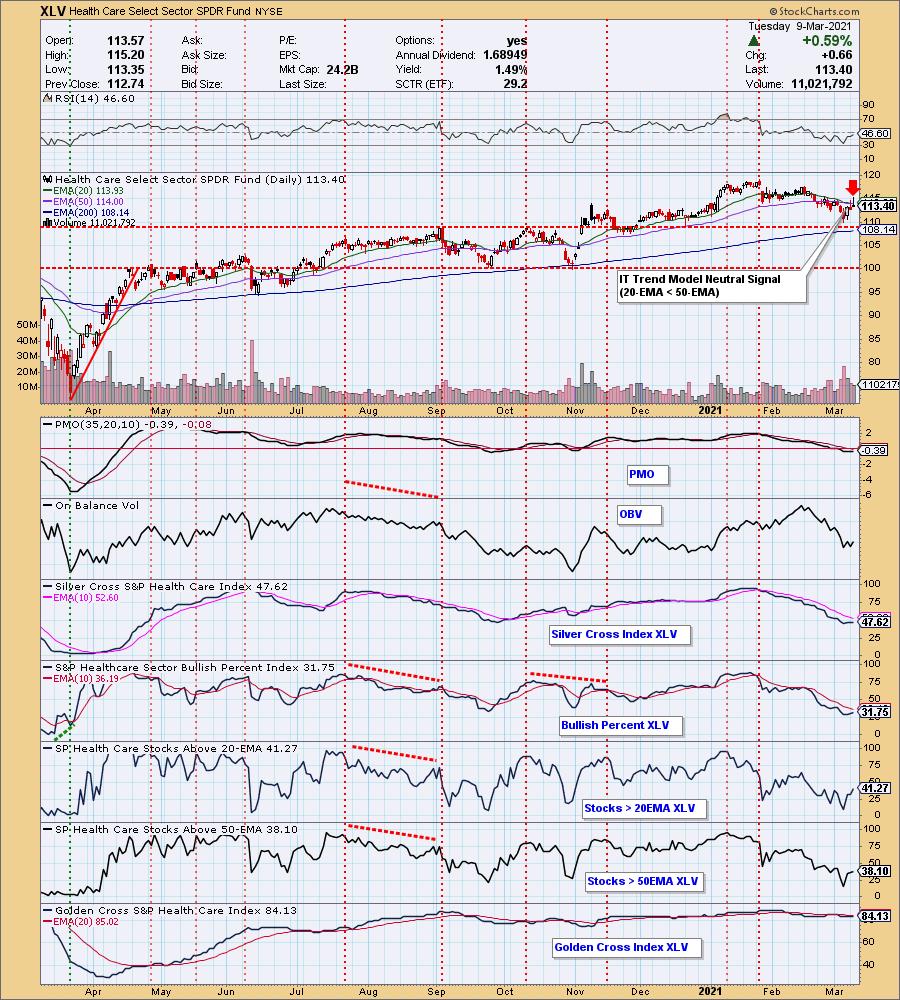
Each S&P 500 Index component stock is assigned to one, and only one, of 11 major sectors. This is a snapshot of the Intermediate-Term (Silver Cross) and Long-Term (Golden Cross) Trend Model signal status for those sectors.
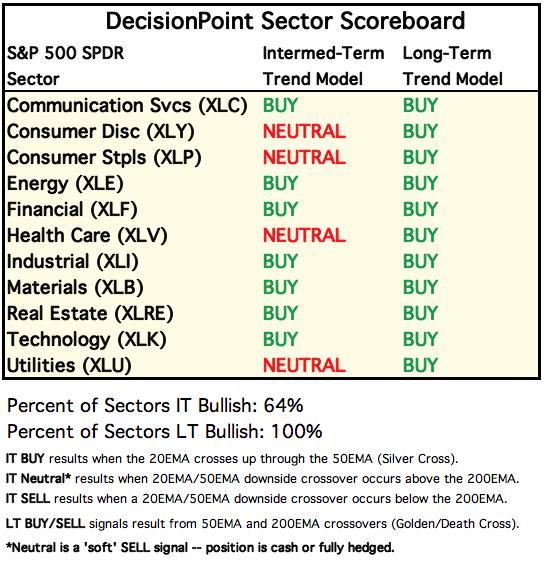
Today the Health Care sector (XLV) logged a new IT Trend Model Neutral signal when the 20-EMA crossed below the 50-EMA while the 50-EMA was above the 200-EMA. Had the crossover occurred below the 200-EMA we would have gone to a SELL signal. Also note that we have a bearish shooting star candlestick on XLV.
CLICK HERE for Carl's annotated Sector charts.
THE MARKET (S&P 500)
IT Trend Model: BUY as of 5/8/2020
LT Trend Model: BUY as of 6/8/2020
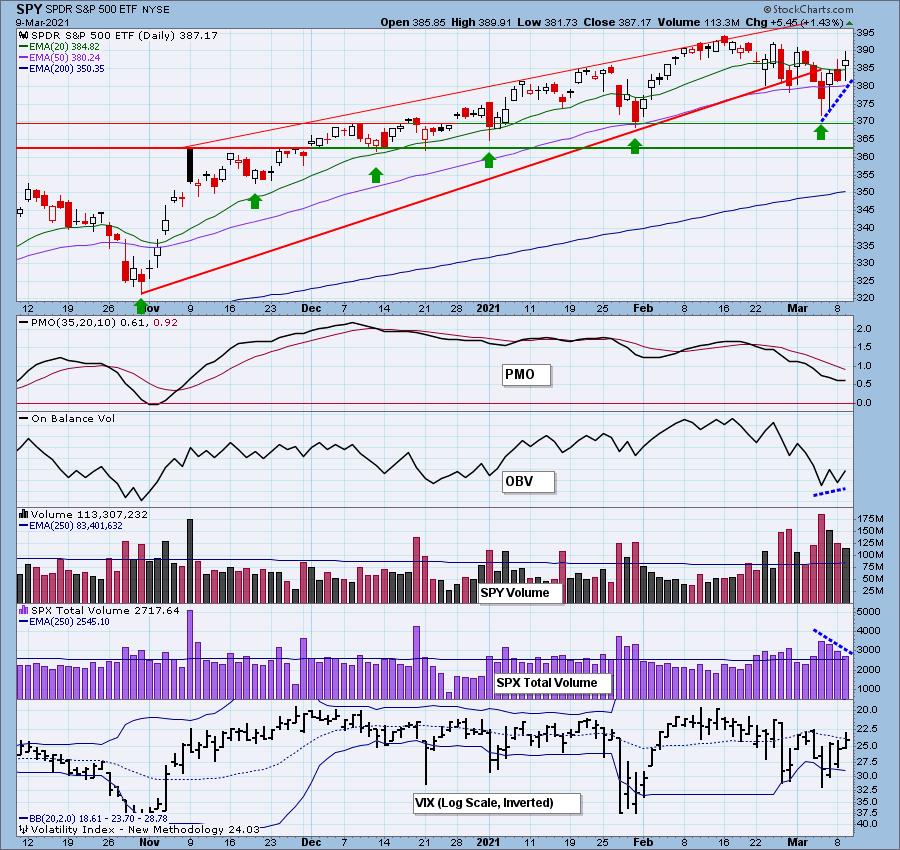
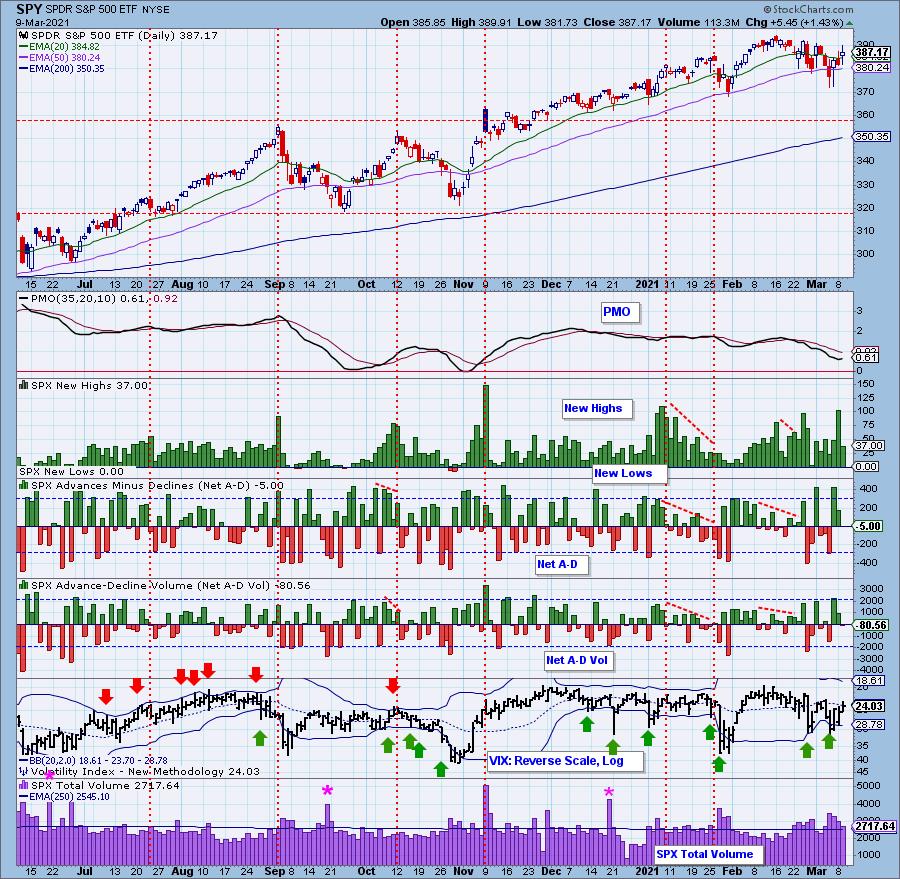
SPY Daily Chart: Total volume contracted again today despite the strong rally. Meanwhile we have a new rising trend. Seeing volume contract as prices move higher is bearish. We can't discount the close above the 20-EMA. The OBV is showing rising bottoms, but that is a "confirmation" not a divergence which is more helpful.
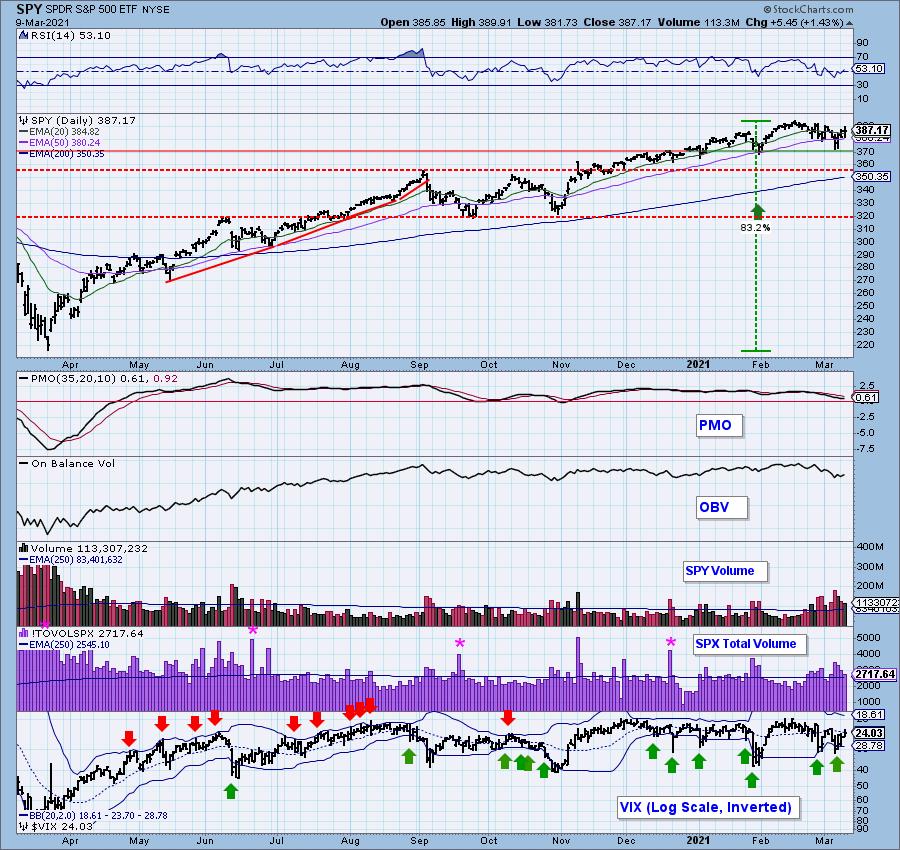
The RSI did manage to reach positive territory above net neutral (50) and the PMO has decelerated and is looking to bottom here. The OBV, however, is still in a declining trend basically confirming the short-term declining trend off the all-time high.
Free DecisionPoint Trading Room on Mondays, Noon ET

*Click here to register for this recurring free DecisionPoint Trading Room on Mondays at Noon ET!*
=======================================
BELOW is a link to the 3/8 trading room recording:
Topic: DecisionPoint Trading Room
Start Time : Mar 8, 2021 09:00 AM
Meeting Recording:
Access Passcode: G@W.$M5B
For best results, copy and paste the access code to avoid typos.
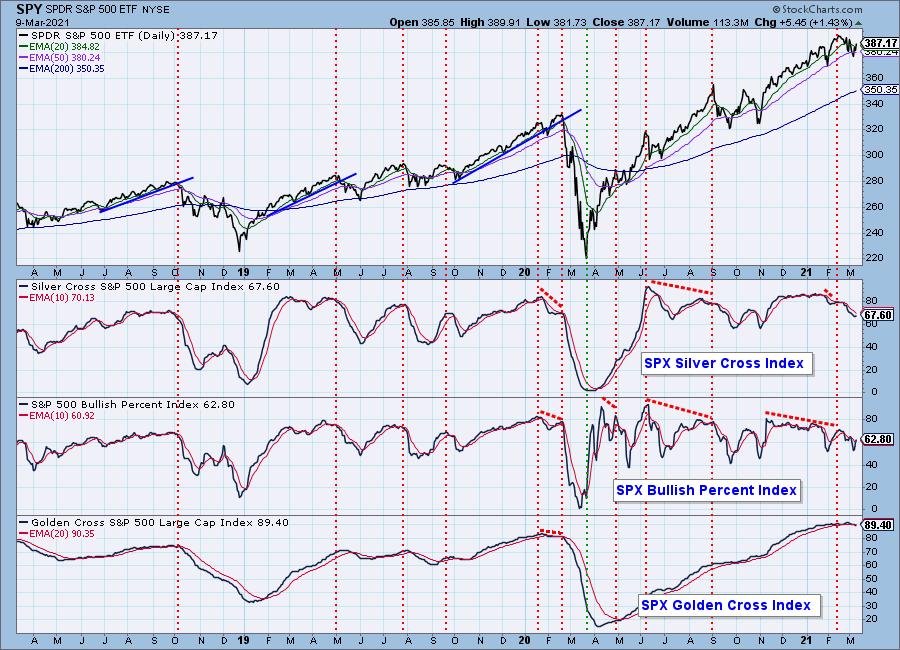
Participation: The following chart uses different methodologies for objectively showing the depth and trend of participation for intermediate- and long-term time frames.
- The Silver Cross Index (SCI) shows the percentage of SPX stocks on IT Trend Model BUY signals (20-EMA > 50-EMA).
- The Golden Cross Index (GCI) shows the percentage of SPX stocks on LT Trend Model BUY signals (50-EMA > 200-EMA).
- The Bullish Percent Index (BPI) shows the percentage of SPX stocks on Point & Figure BUY signals.
The SCI rose again today, but is decelerating. The BPI gave us a positive crossover which is bullish in the short to intermediate term. The GCI is still declining from historically overbought territory based on data going back to 2017.
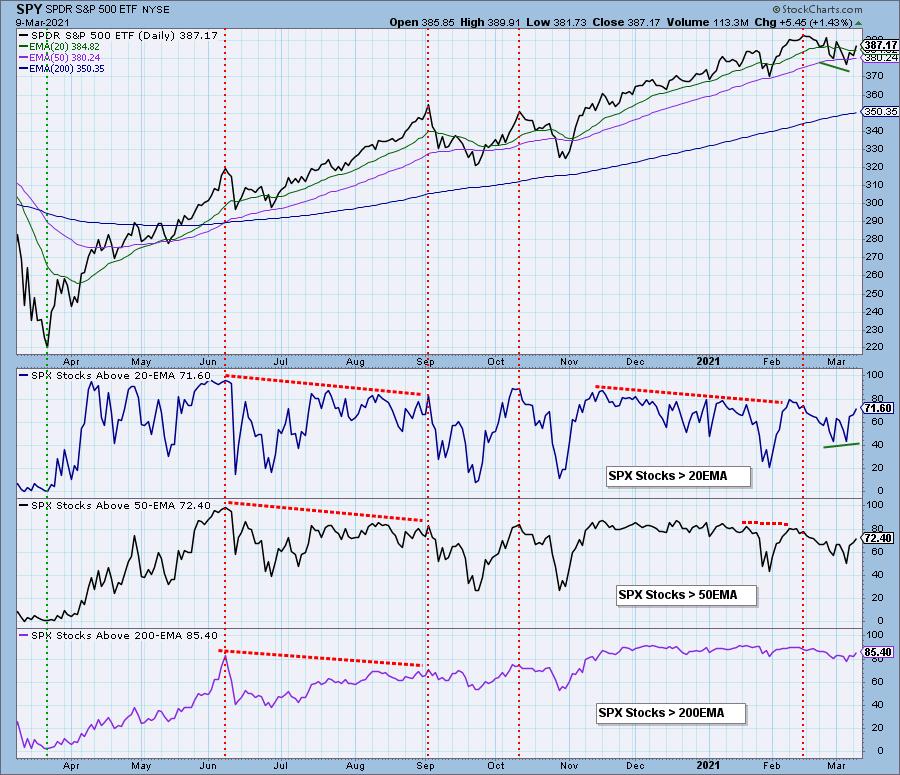
Not surprisingly we saw an increase in participation. As noted yesterday, we do have a slight positive divergence in the short term on %Stocks > 20-EMA. The rally off that positive divergence may have exhausted itself, but it is still encouraging to see at least one positive divergence.
Climactic Market Indicators: Another dichotomy to today's big rally is a negative reading on Net A-D. I already mentioned the contraction in New Highs which is also concerning. The VIX did close above its EMA but spent most of the day below its EMA on the inverted scale. Typically, oscillation by the VIX below its EMA denotes internal weakness.
Short-Term Market Indicators: The short-term market trend is UP and the condition is NEUTRAL.
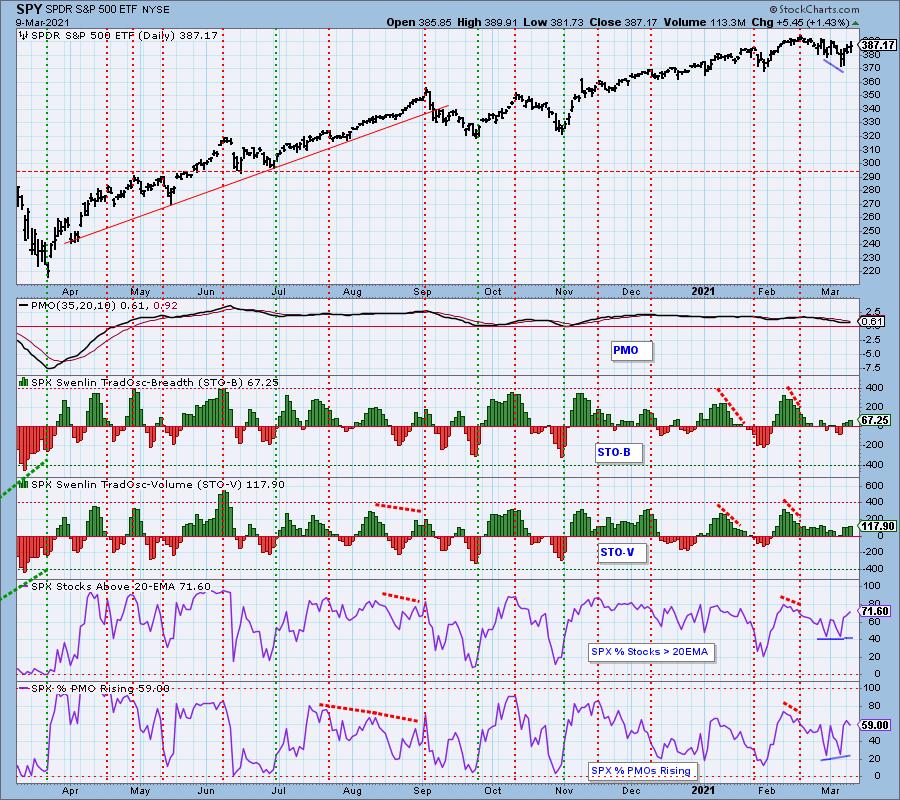
The Swenlin Trading Oscillators continued to rise which does confirm the current rally. You'll also notice a positive divergence on %Stocks with PMOs rising. However, you should also notice that %Stocks with PMOs rising FELL on today's rally.
Intermediate-Term Market Indicators: The intermediate-term market trend is UP and the condition is OVERBOUGHT. The intermediate-term market bias is BULLISH.
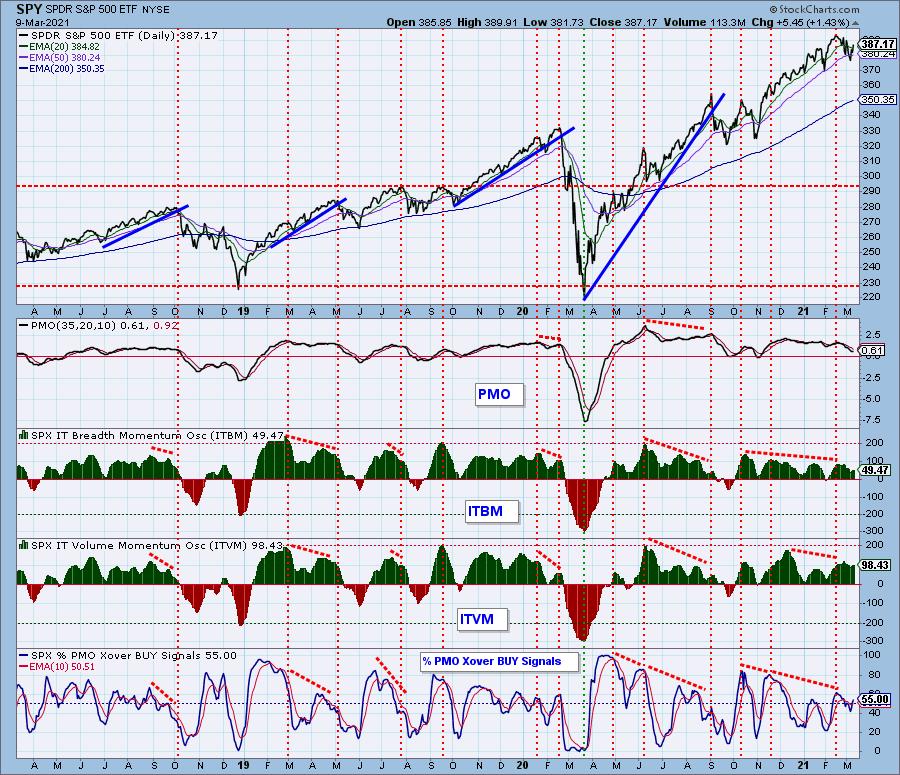
The ITBM/ITVM are rising again, but are somewhat overbought already. The %PMO crossover BUY signal is rising, but only managed to increase by 3%.
CONCLUSION: I don't want to takeaway from today's strong rally as we are seeing some improvement on our short-term indicators. The problem is not all of those indicators improved as they should have. The IT indicators are showing improvement, but remember the ITBM/ITVM are overbought. I suspect this is the fulfillment of the upside initiation from Friday when our climactic indicators popped. Currently short-term indicators like the STOs are confirming this rally, but confirmations aren't as powerful as positive divergences. I spotted a few new positive divergences, but I would still play defense right now. This could be an excellent opportunity to sell into strength or adjust your stop levels to a higher price point to preserve profits.
Have you subscribed the DecisionPoint Diamonds yet? DP does the work for you by providing handpicked stocks/ETFs from exclusive DP scans! Add it with a discount! Contact support@decisionpoint.com for more information!
BITCOIN
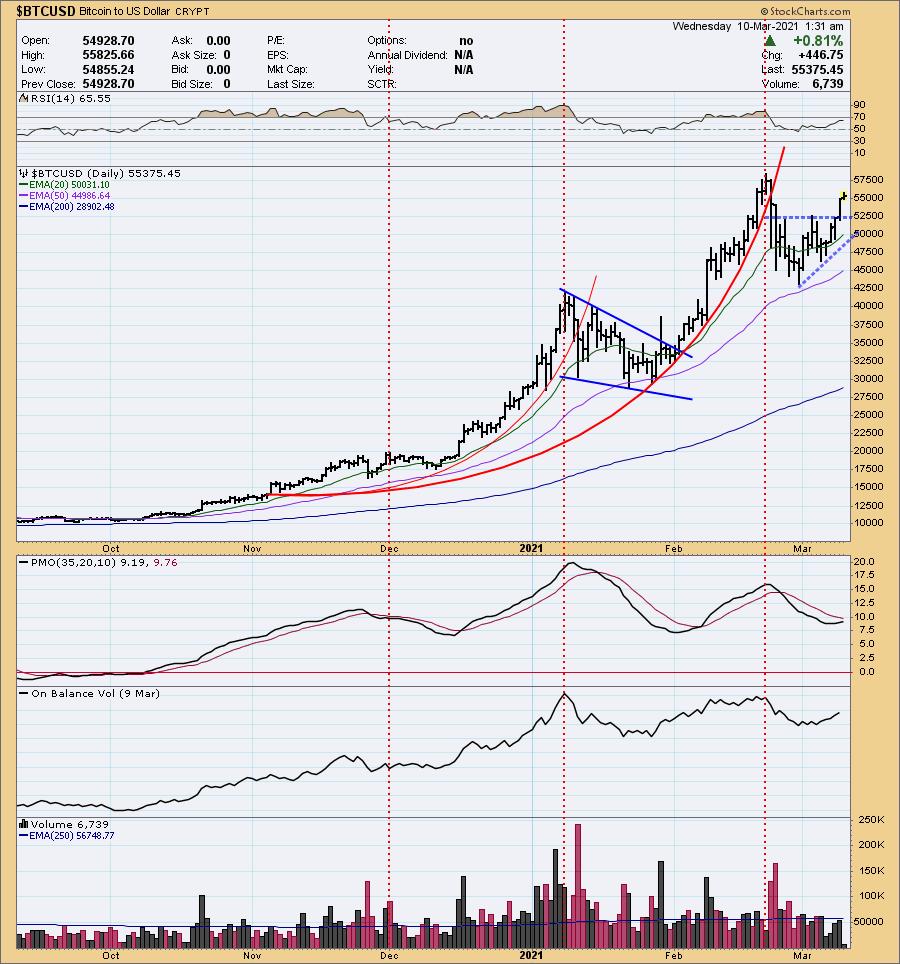
The rally is resuming in Bitcoin. It has now broken out above a bullish ascending triangle and the PMO has turned back up.
INTEREST RATES
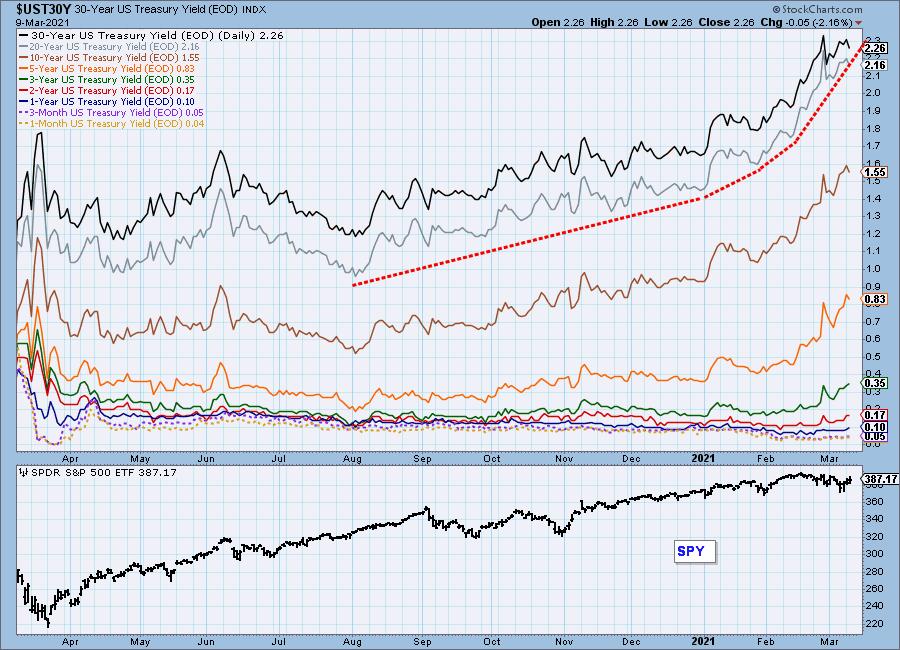
Interest rates are seeing steeper and steeper rising bottoms trend lines. Carl and I aren't looking at this as a bearish parabolic move. It isn't that likely we will see yields drop as quickly as a parabolic formation would suggest. The rising rate environment is likely to continue, leaving Bonds nowhere to go but down.
DOLLAR (UUP)
IT Trend Model: NEUTRAL as of 5/28/2020
LT Trend Model: SELL as of 7/10/2020
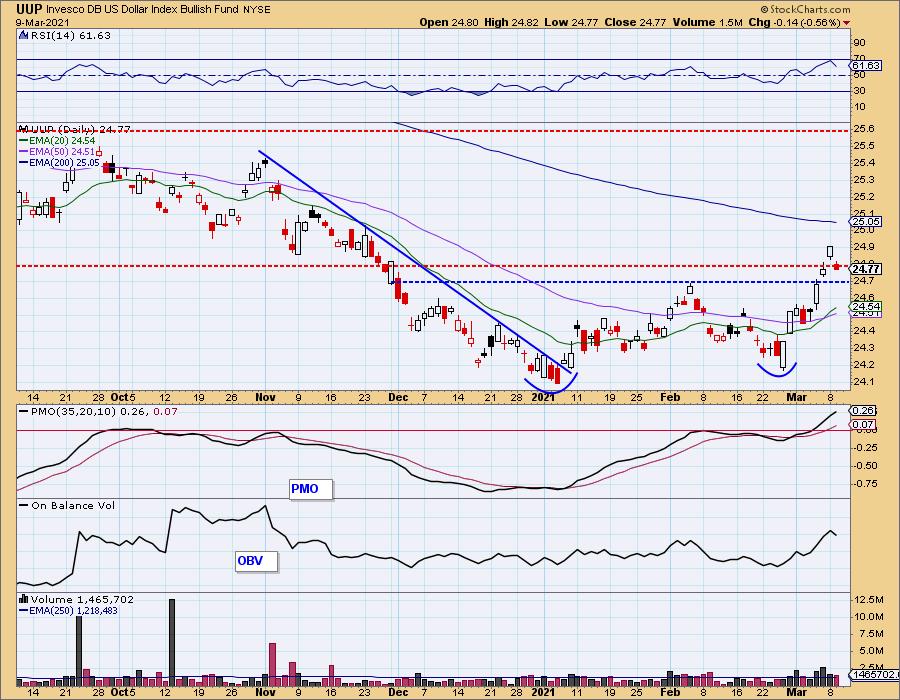
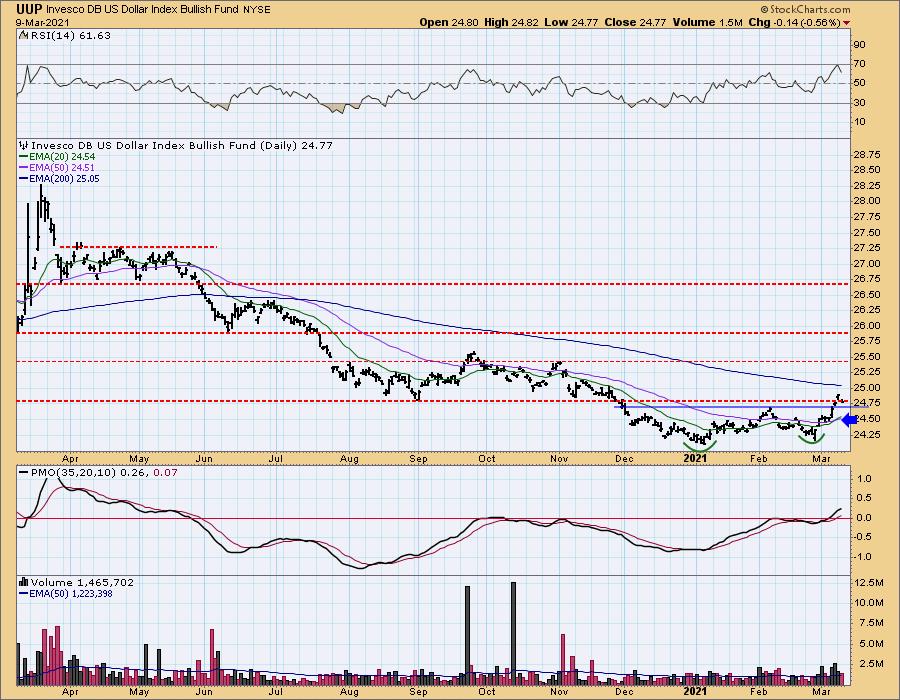
UUP Daily Chart: UUP pulled back today toward the breakout from the confirmation line of the bullish double-bottom. The PMO continues to rise strongly and it is not overbought. The RSI is positive and no longer overbought. This seems a natural pullback after a breakout. I'd expect to see the rally continue.
GOLD
IT Trend Model: NEUTRAL as of 1/14/2021
LT Trend Model: SELL as of 3/4/2021
GLD Daily Chart: It was now or never for Gold as it sat upon strong support yesterday. We finally saw a strong gain for Gold. The Dollar was down -0.56% today, but Gold was up +2.32% which tells us there was a large influx of buyers. Discounts spiked lower telling us participants are more bearish. Given sentiment is contrarian, we want to see higher discounts. The RSI is negative, but rising out of oversold territory. The PMO is bottoming. The outlook for Gold has improved greatly, but given the bearish EMAs, this may be short-lived.
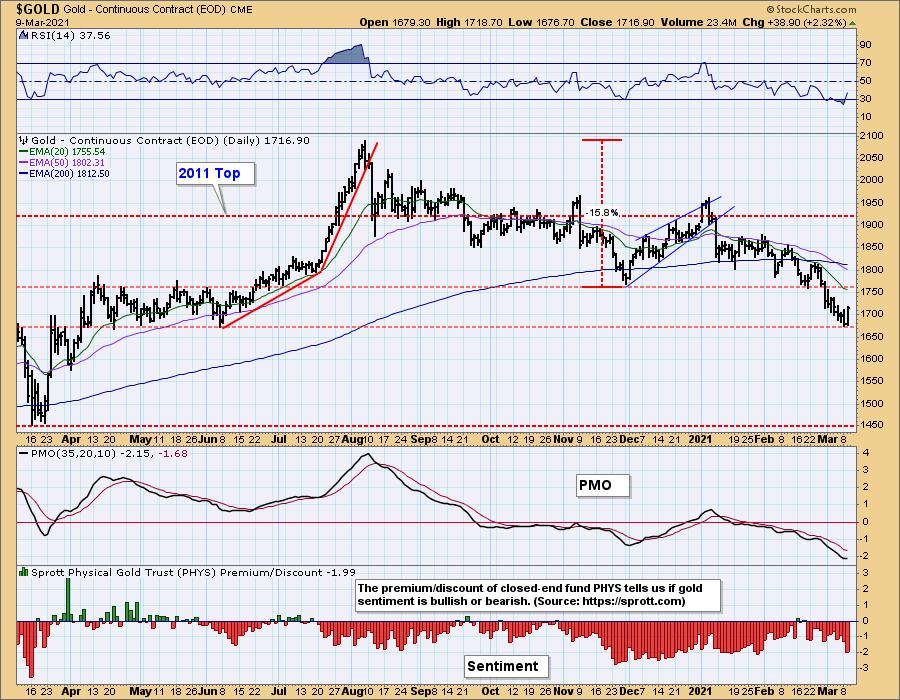
Full disclosure: I own GLD.
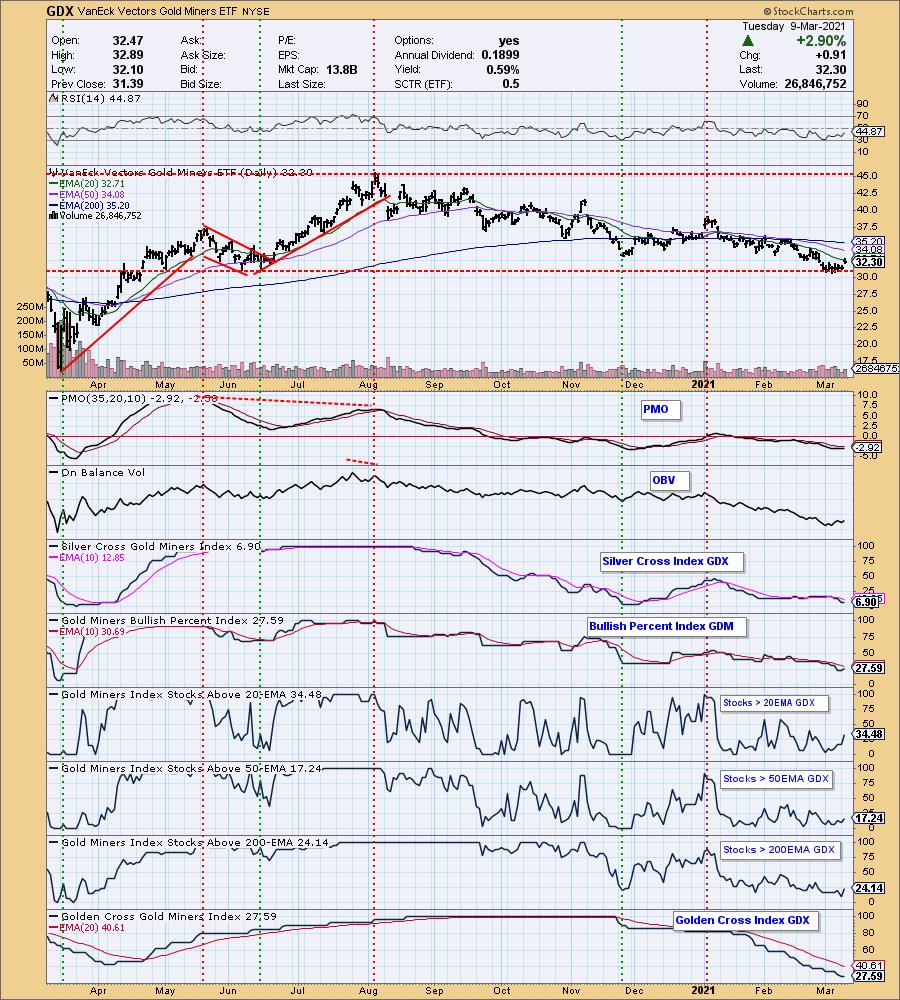
GOLD MINERS Golden and Silver Cross Indexes: Nice rally on the Gold Miners. However, I'm not seeing this as a bottom, today's action looks more like a reverse island formation. The reverse island formation tells us to expect a gap down back to support near term. Indicators are improving, but not enough for me to get bullish on Gold Miners. They likely benefited from Gold's strong rally.
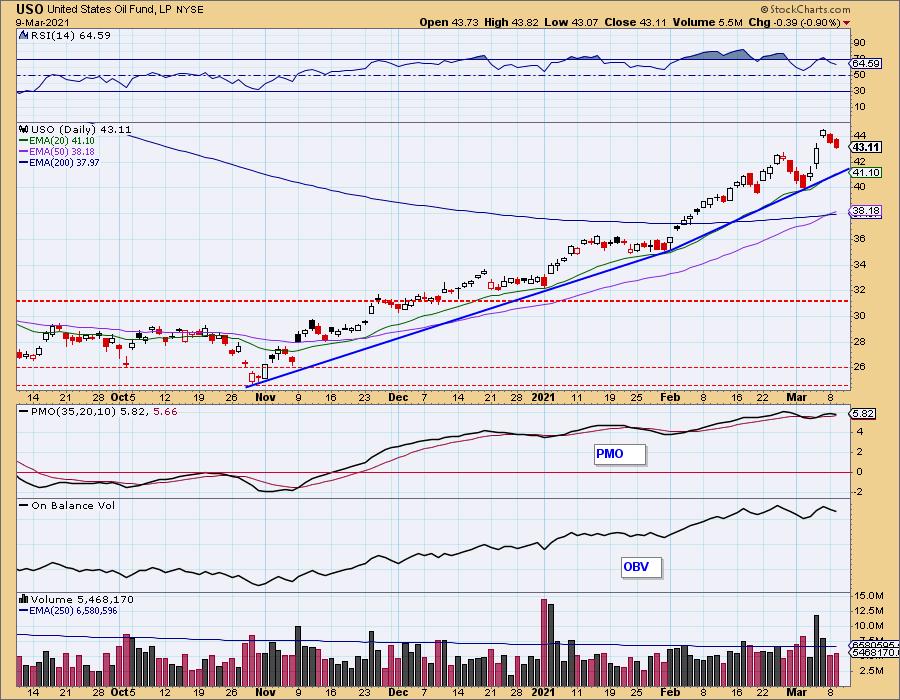
CRUDE OIL (USO)
IT Trend Model: BUY as of 10/20/2020
LT Trend Model: SELL as of 2/3/2020
USO Daily Chart: The pullback continues for USO. The PMO has now topped and could be headed for a crossover SELL signal. Overall I'm still bullish on crude oil, but I would expect a drop to test the new rising trend before it pops higher.
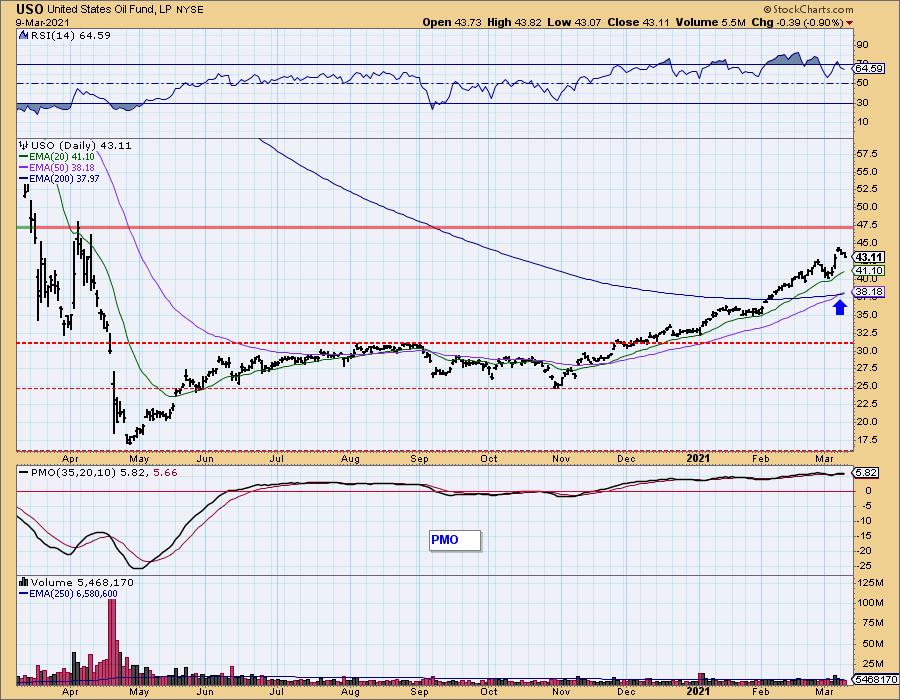
The USO 1-year daily chart suggests overhead resistance could arrive around $47.50. I'll be watching for USO to pullback to support at $42.50--that could be an interesting buy point.
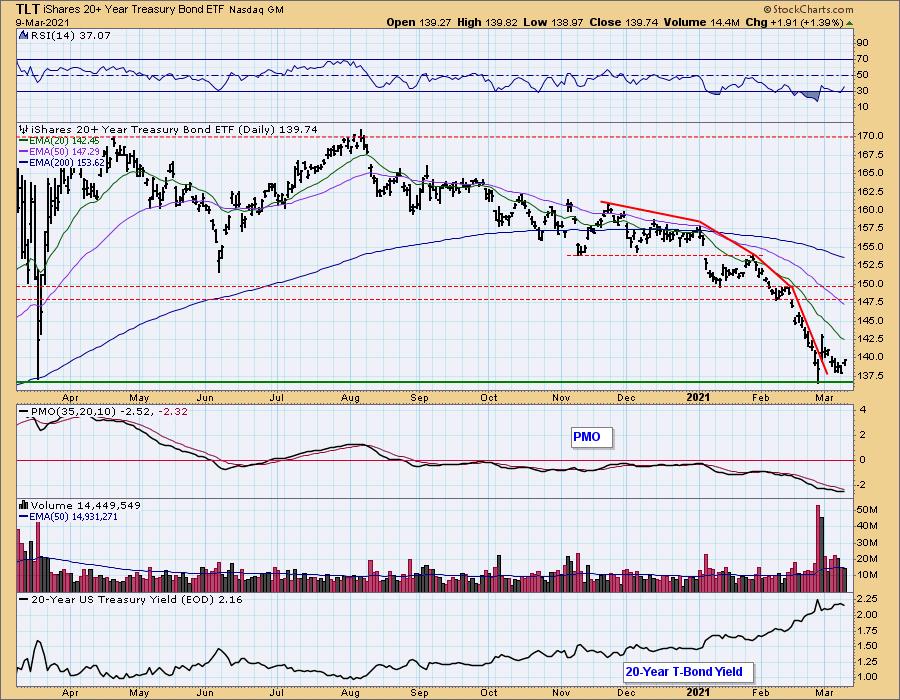
BONDS (TLT)
IT Trend Model: NEUTRAL as of 8/27/2020
LT Trend Model: SELL as of 1/8/2021
TLT Daily Chart: TLT broke out from its short-term declining trend as it did at the end of February. What could become interesting is a possible double-bottom developing. Yields are turning down, but their rising trend is still intact. This rising rate environment will continue to put downward pressure on Bonds.
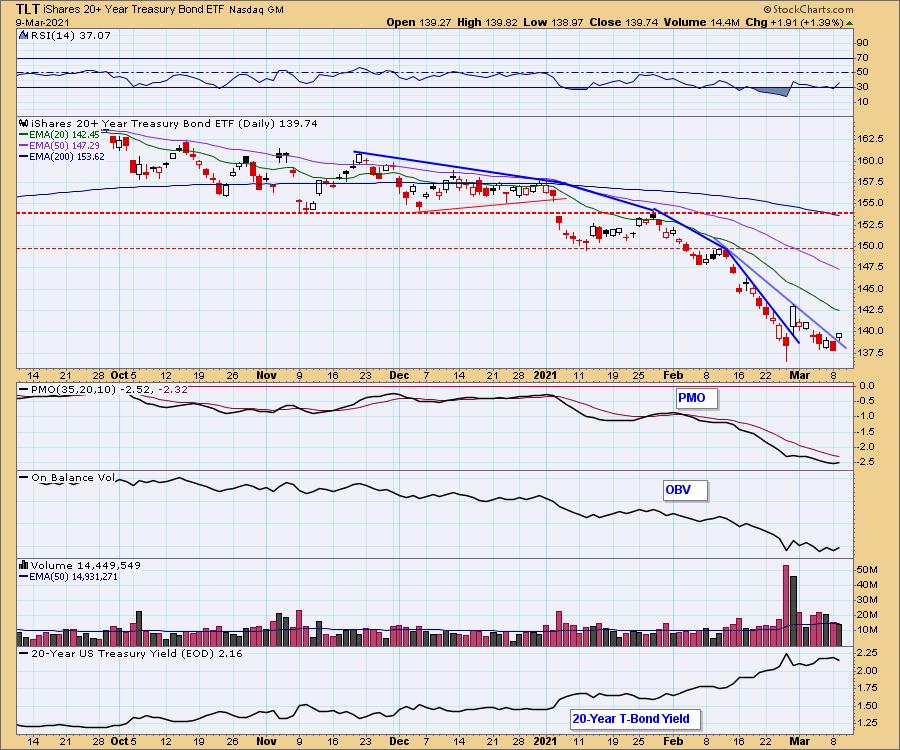
The RSI and PMO are beginning to move higher, but we've been fooled before on a short-term breakout (see end of February).
Technical Analysis is a windsock, not a crystal ball.
Happy Charting! - Erin
Disclaimer: This blog is for educational purposes only and should not be construed as financial advice. The ideas and strategies should never be used without first assessing your own personal and financial situation, or without consulting a financial professional. Any opinions expressed herein are solely those of the author, and do not in any way represent the views or opinions of any other person or entity.
NOTE: The signal status reported herein is based upon mechanical trading model signals, specifically, the DecisionPoint Trend Model. They define the implied bias of the price index based upon moving average relationships, but they do not necessarily call for a specific action. They are information flags that should prompt chart review. Further, they do not call for continuous buying or selling during the life of the signal. For example, a BUY signal will probably (but not necessarily) return the best results if action is taken soon after the signal is generated. Additional opportunities for buying may be found as price zigzags higher, but the trader must look for optimum entry points. Conversely, exit points to preserve gains (or minimize losses) may be evident before the model mechanically closes the signal.
Helpful DecisionPoint Links:
DecisionPoint Alert Chart List
DecisionPoint Golden Cross/Silver Cross Index Chart List
DecisionPoint Sector Chart List
Price Momentum Oscillator (PMO)
Swenlin Trading Oscillators (STO-B and STO-V)
DecisionPoint is not a registered investment advisor. Investment and trading decisions are solely your responsibility. DecisionPoint newsletters, blogs, trading rooms or website materials should NOT be interpreted as a recommendation or solicitation to buy or sell any security or to take any specific action.