
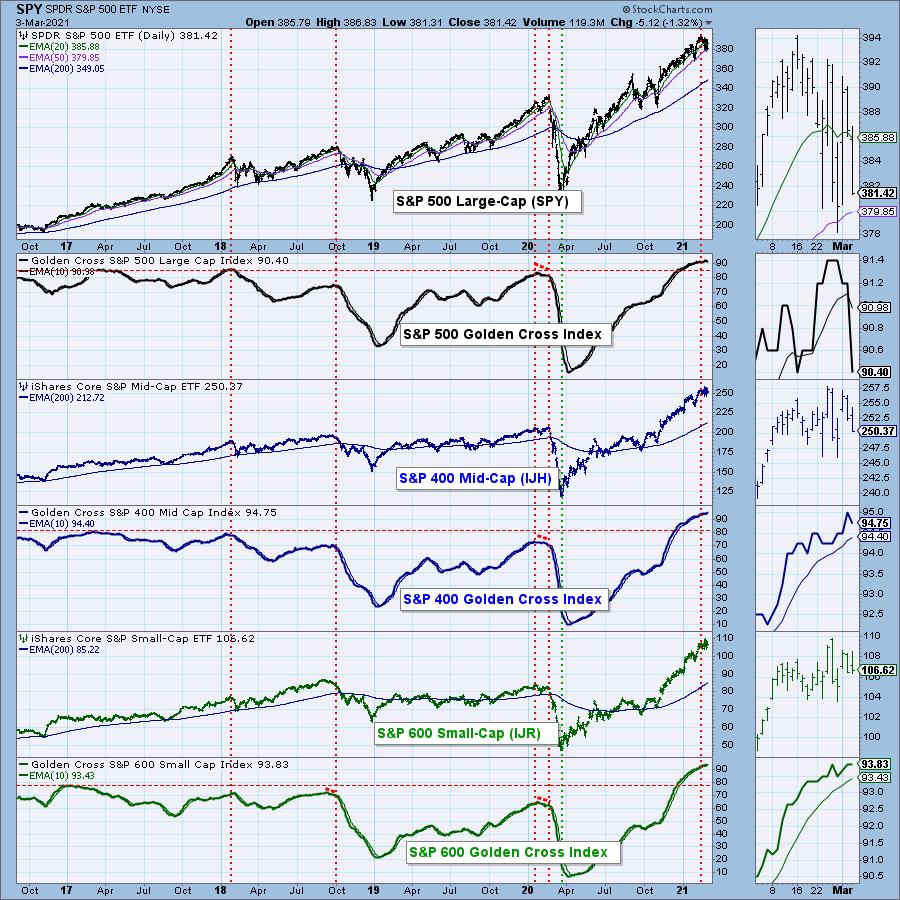
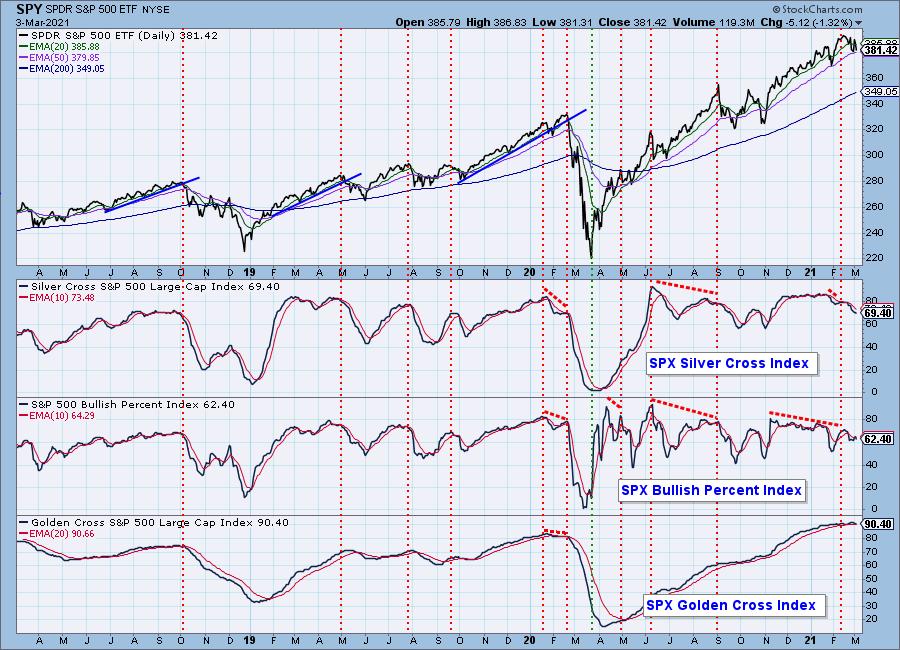
We have seen the Golden Cross Index (GCI) sitting at its "all-time high" (data since 2017) for some time. Today it dropped a full percentage point. It moves fairly slowly, so this decline was significant in my estimation. Below I have the Golden Cross Index chart for the major indexes. Notice all of them are extremely overbought. The SP600 has the healthiest as it only moving sideways. This isn't surprising as small-caps have been outperforming the large-caps. It appears the longer-term foundation of the SPX is beginning to show small cracks. Note that cardinal tops (marked with the red vertical line) typically arrive when the GCI tops. I don't think this is over just yet.
The DecisionPoint Alert Weekly Wrap presents an end-of-week assessment of the trend and condition of the Stock Market, the U.S. Dollar, Gold, Crude Oil, and Bonds. The DecisionPoint Alert daily report (Monday through Thursday) is abbreviated and gives updates on the Weekly Wrap assessments.
Watch the latest episode of DecisionPoint on StockCharts TV's YouTube channel here!
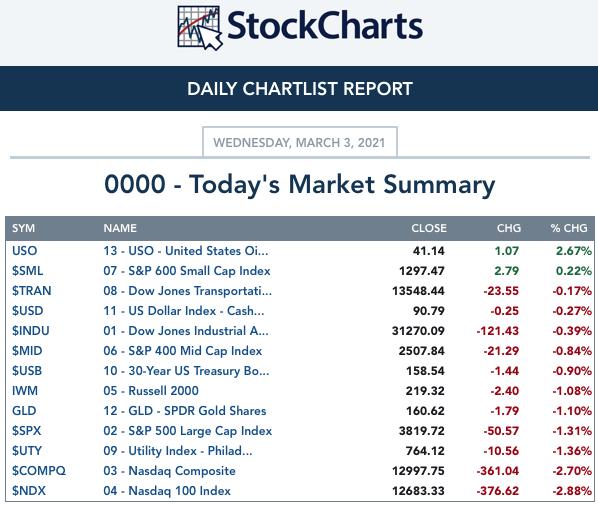
MAJOR MARKET INDEXES
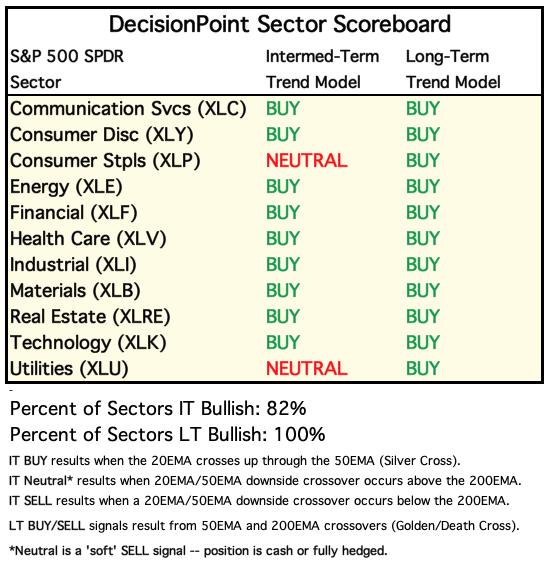
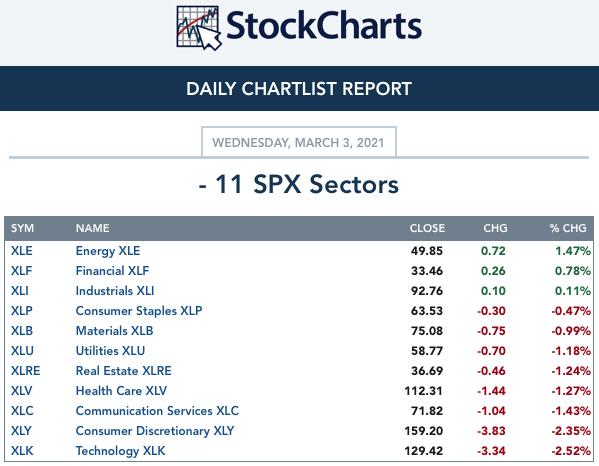
SECTORS
Each S&P 500 Index component stock is assigned to one, and only one, of 11 major sectors. This is a snapshot of the Intermediate-Term (Silver Cross) and Long-Term (Golden Cross) Trend Model signal status for those sectors.
CLICK HERE for Carl's annotated Sector charts.
THE MARKET (S&P 500)
IT Trend Model: BUY as of 5/8/2020
LT Trend Model: BUY as of 6/8/2020
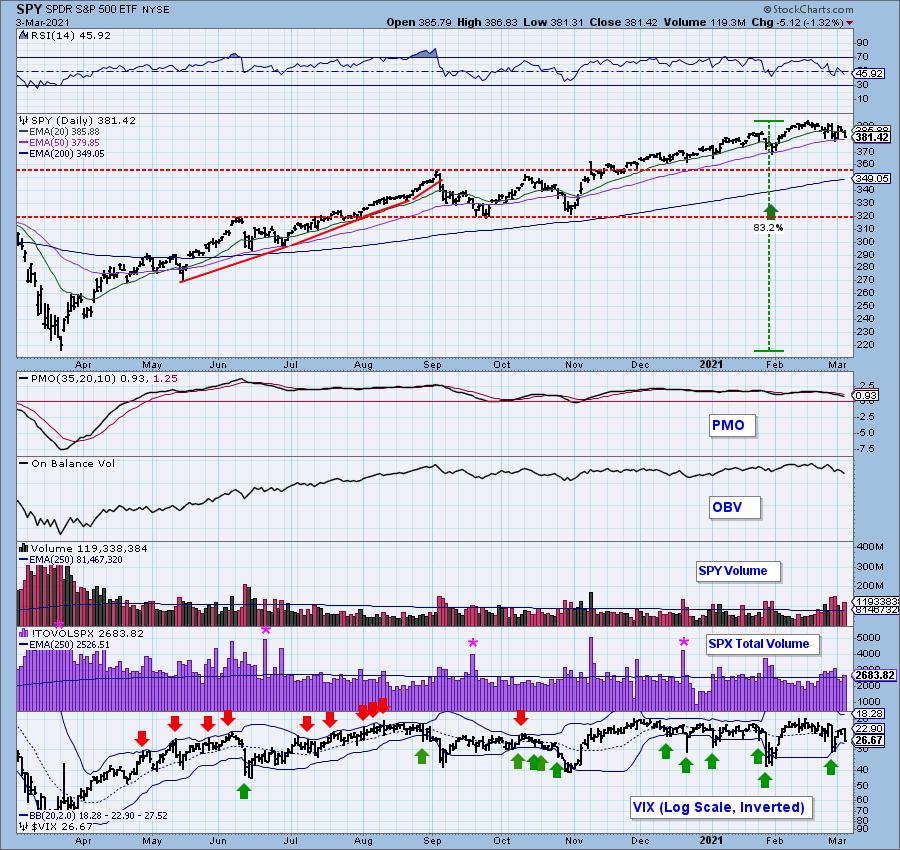
SPY Daily Chart: I wrote about the VIX turning down below its EMA yesterday. Today it dove lower on the inverted scale into oversold territory. We didn't see it penetrate the lower Bollinger Band, so more downside is likely. The 50-EMA is still holding as support even as price begins to drop below the bottom of the bearish rising wedge. The PMO continues to decline.
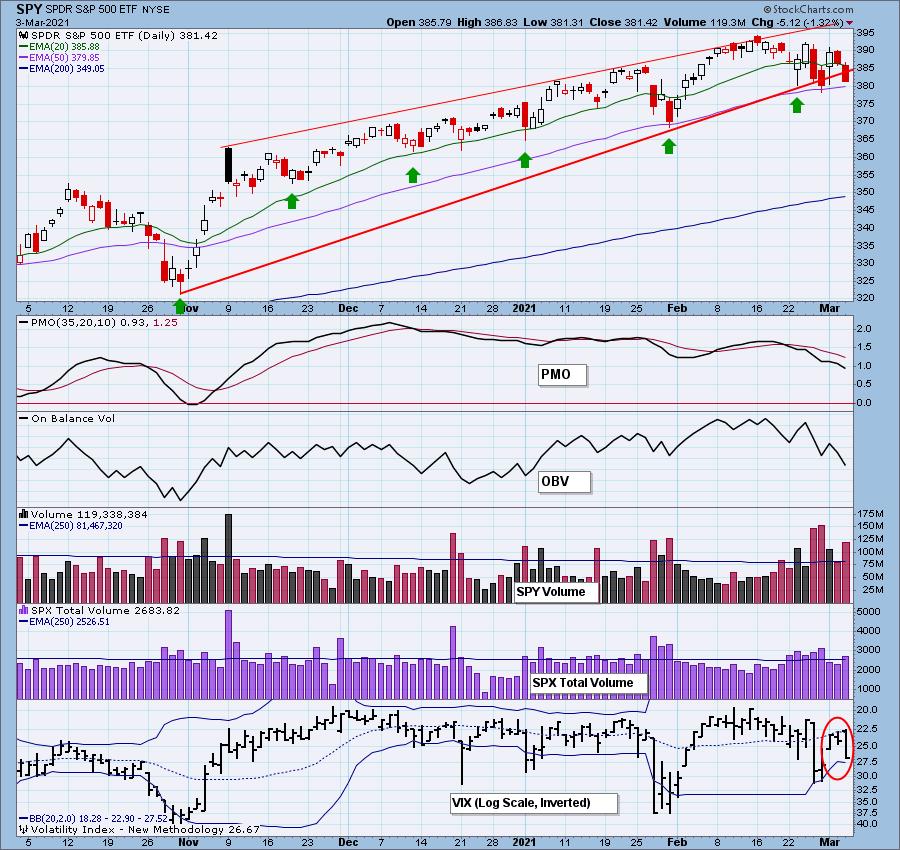
The RSI moved into negative territory on today's strong decline. Total volume was above the annual average on a 1%+ decline.
Free DecisionPoint Trading Room on Mondays, Noon ET

*Click here to register for this recurring free DecisionPoint Trading Room on Mondays at Noon ET!*
=======================================
DID YOU MISS GUEST, DAVID KELLER IN THE DP TRADING ROOM March 1st?
BELOW is a link to the trading room recording:
Topic: DecisionPoint Trading Room
Start Time : Mar 1, 2021 08:44 AM
Meeting Recording:
Access Passcode: tdd*4nNS
For best results, copy and paste the access code to avoid typos.
Participation: The following chart uses different methodologies for objectively showing the depth and trend of participation for intermediate- and long-term time frames.
- The Silver Cross Index (SCI) shows the percentage of SPX stocks on IT Trend Model BUY signals (20-EMA > 50-EMA).
- The Golden Cross Index (GCI) shows the percentage of SPX stocks on LT Trend Model BUY signals (50-EMA > 200-EMA).
- The Bullish Percent Index (BPI) shows the percentage of SPX stocks on Point & Figure BUY signals.
I already discussed the negative crossover on the GCI. The BPI also had a negative crossover today. The SCI was already in decline. Near-term oversold territory for the SCI is around 60%. That's about 10% more losing their 'silver crosses'. That will wreak some major price damage.
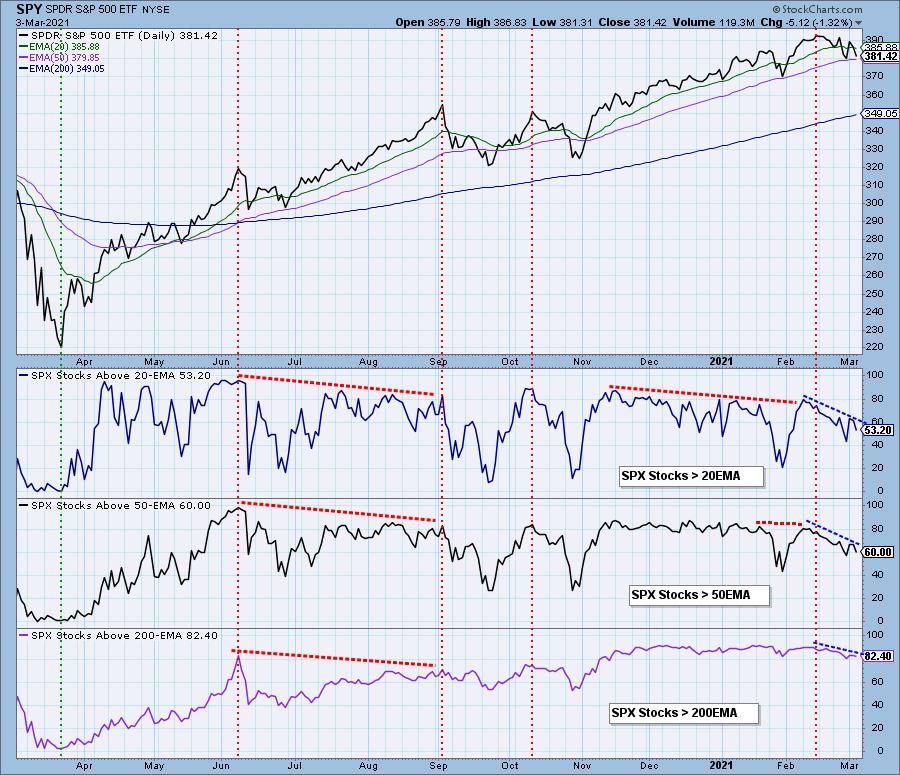
Participation is confirming the decline with their own declines. We're also seeing some deterioration on the SPX Stocks > 200-EMA.
Climactic Market Indicators: No climaxes today. Interestingly we saw an expansion of New Highs, but as with yesterday, if a stock hits a new 52-week high, it is logged. It doesn't have to close on that high.
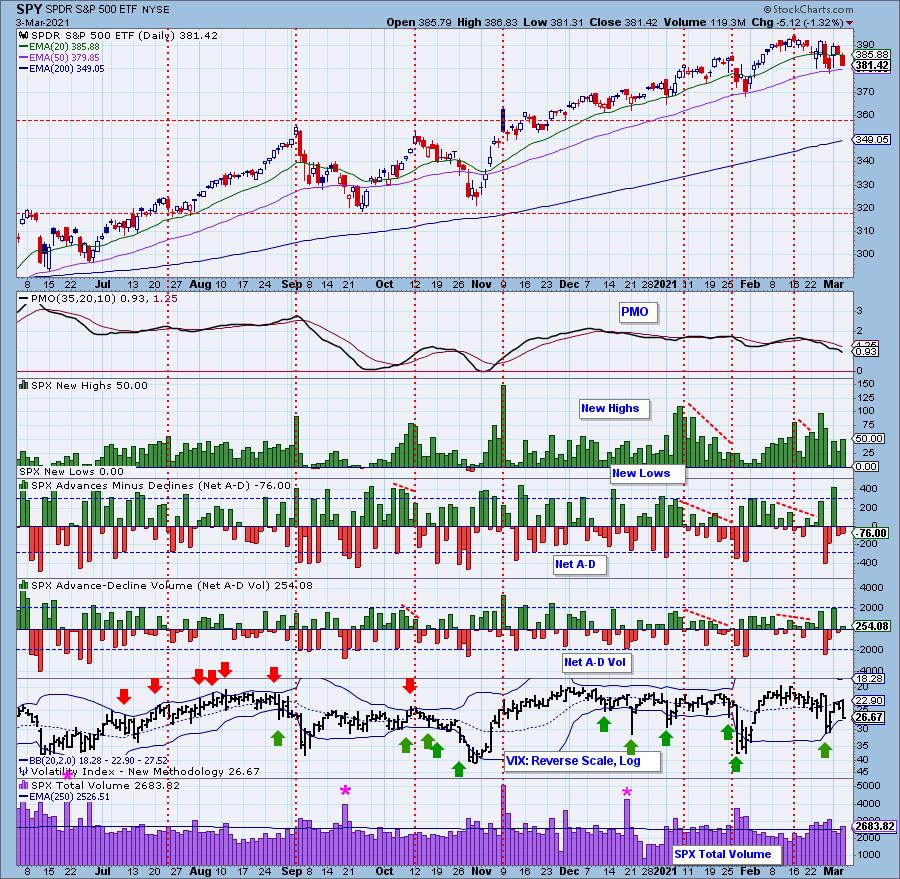
Short-Term Market Indicators: The short-term market trend is DOWN and the condition is NEUTRAL.
The STO-B is back in negative territory. It isn't particularly oversold so it can certainly accommodate more downside in the market. We now have negative momentum on the majority of stocks. Additionally more and more are losing support at the 20-EMA which we all know is an important support level.
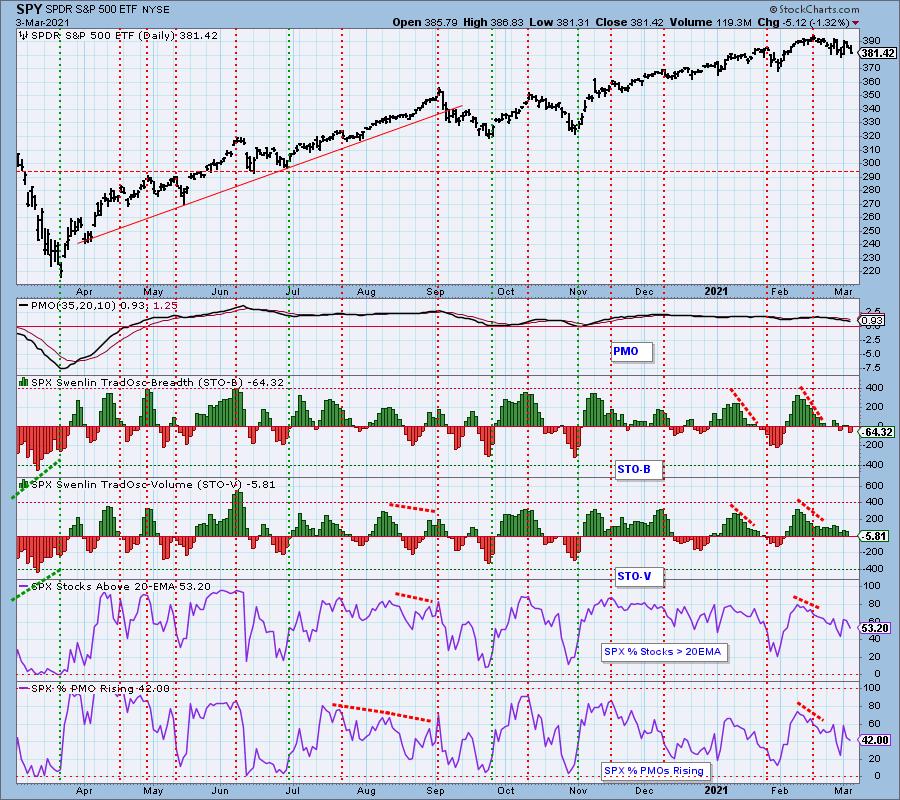
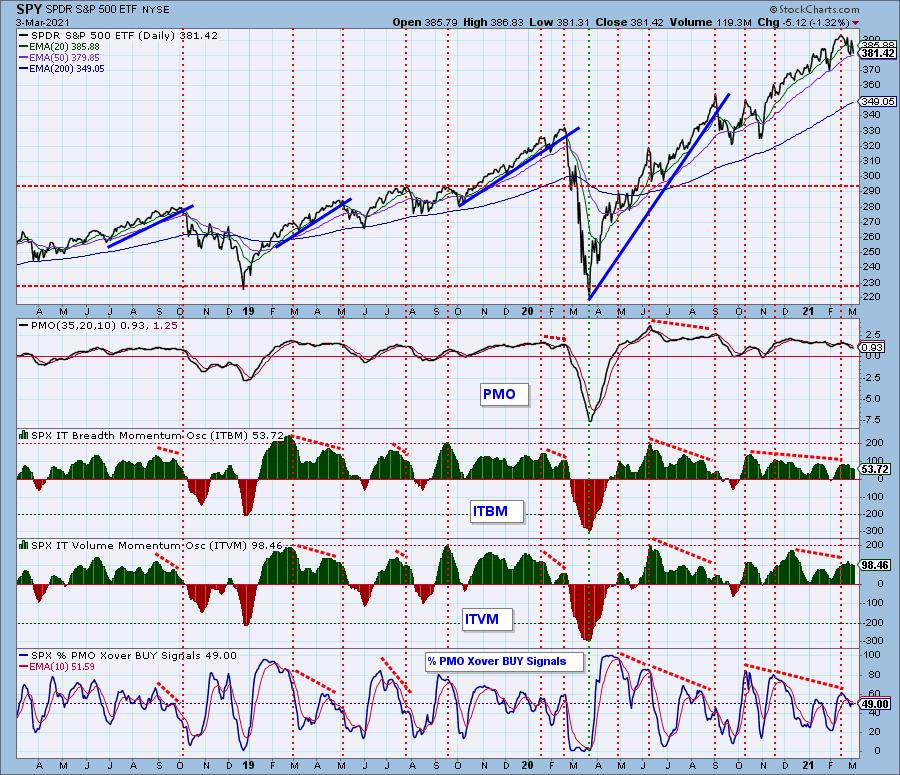
Intermediate-Term Market Indicators: The intermediate-term market trend is UP and the condition is OVERBOUGHT. The intermediate-term market bias is BULLISH.
The IT indicators continue their decline. They remain overbought.
CONCLUSION: The negative crossover on the GCI is significant, setting the stage for a more voracious intermediate- to long-term decline. Intermediate term, price is flirting with a rising wedge breakdown, but it continues to hold important support at the 50-EMA. This was a reversal point previously. The VIX nearly punctured the lower Bollinger Band. A puncture nearly always results in an upside day or two in the very short term. If we see that puncture tomorrow it could indicate an exhaustion of this decline right at the 50-EMA, but remember, this is a very short-term condition. In the meantime I'd prepare for another down day.
Have you subscribed the DecisionPoint Diamonds yet? DP does the work for you by providing handpicked stocks/ETFs from exclusive DP scans! Add it with a discount! Contact support@decisionpoint.com for more information!
BITCOIN
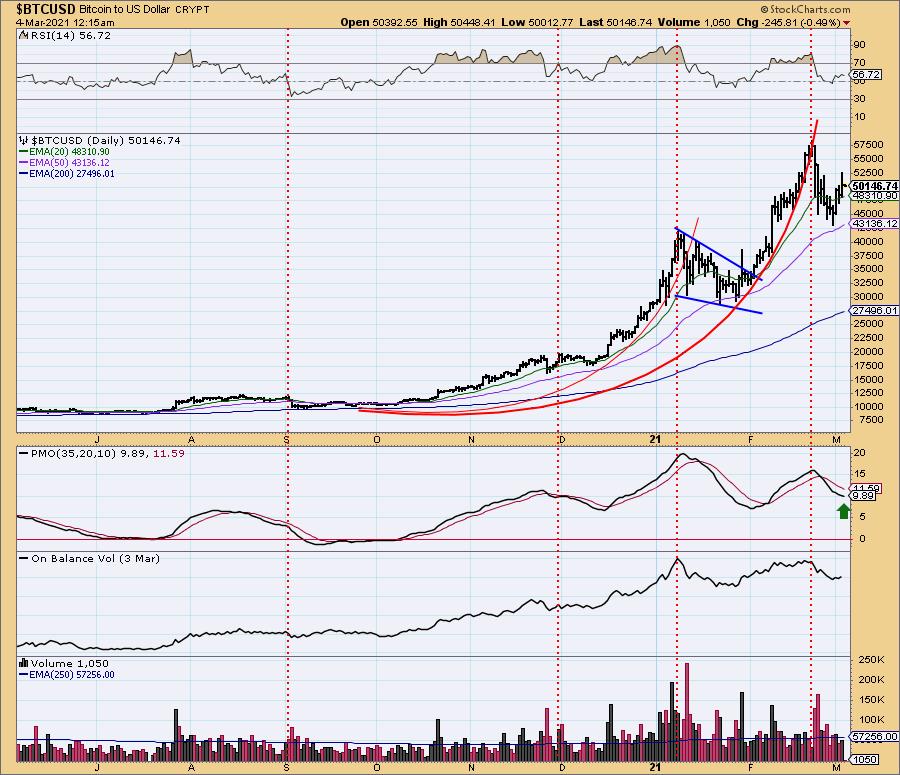
Yesterday's comments still apply:
"Bitcoin bounced off the 50-EMA and support at the 42,000 level. Price is now above the 20-EMA and the PMO has begun to decelerate. The RSI turned up in near-term oversold territory. Looks like Bitcoin is ready to test its all-time high."
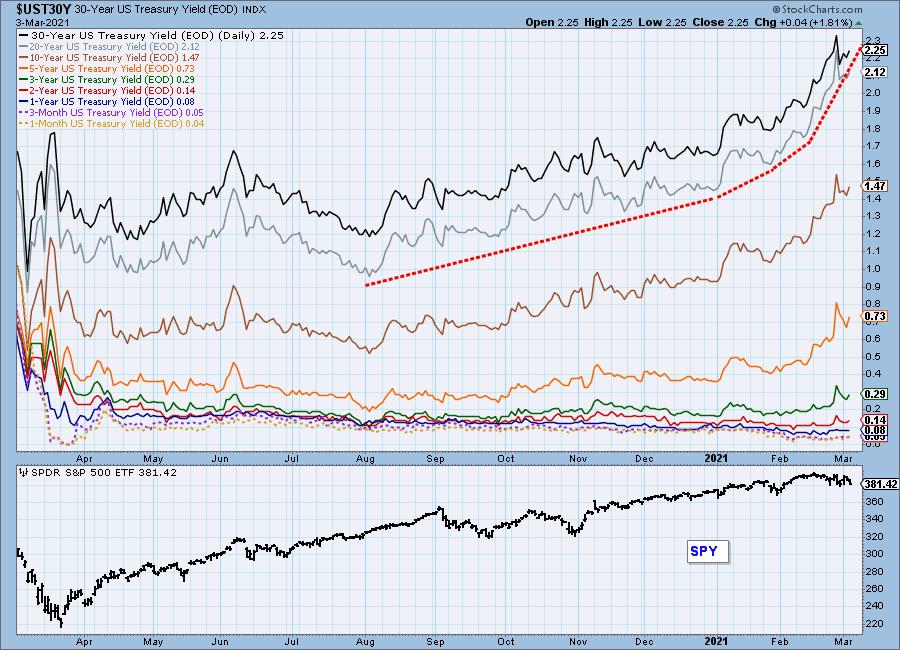
INTEREST RATES
This chart is included so we can monitor rate inversions. In normal circumstances the longer money is borrowed the higher the interest rate that must be paid. When rates are inverted, the reverse is true.
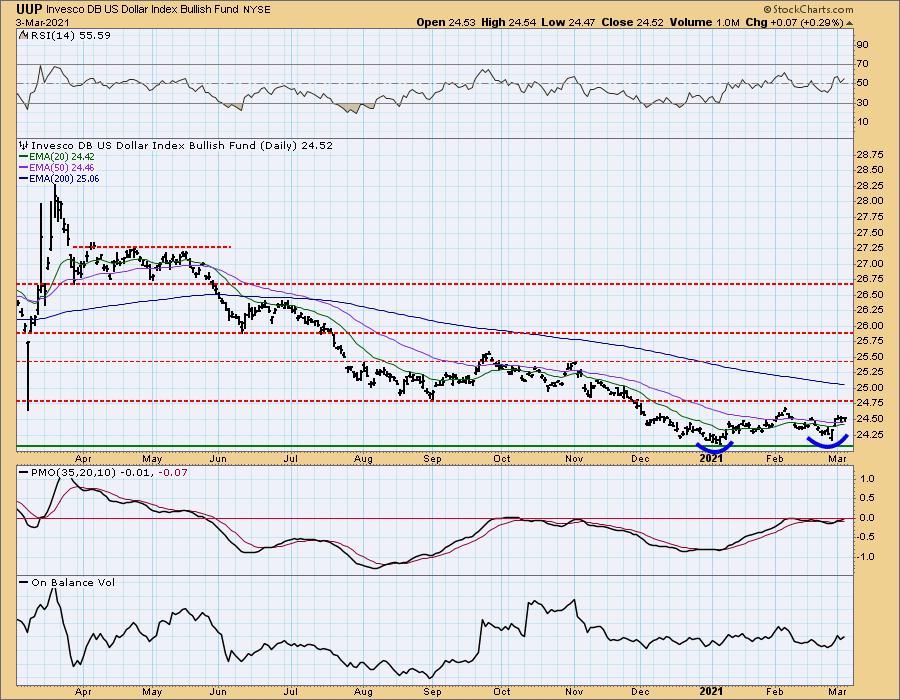
DOLLAR (UUP)
IT Trend Model: NEUTRAL as of 5/28/2020
LT Trend Model: SELL as of 7/10/2020
UUP Daily Chart: The Dollar continues to move sideways. Price is holding the 50-EMA and the RSI just turned up. We've seen failure here before, but it does appear that we have a strong momentum shift that we saw previously. The PMO will be above the zero line tomorrow.
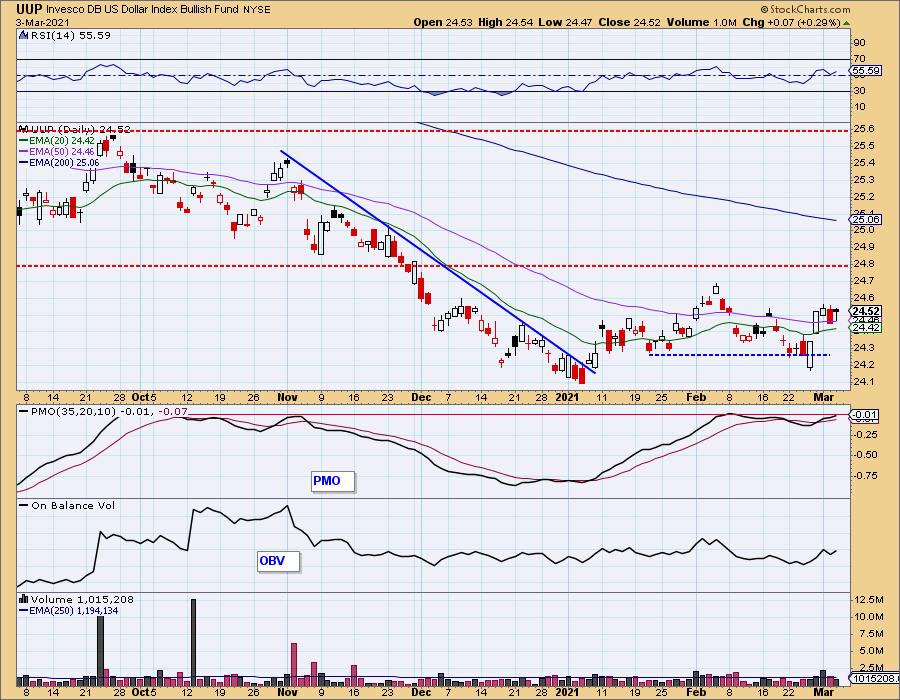
The bullish double-bottom looks good, but it will require UUP to breakout above resistance which it seems loathe to do. Watch the 20/50-EMAs. Looks like we cold get a "silver cross", triggering an intermediate-term BUY signal. That would convince me this time will be different and we will get that breakout.
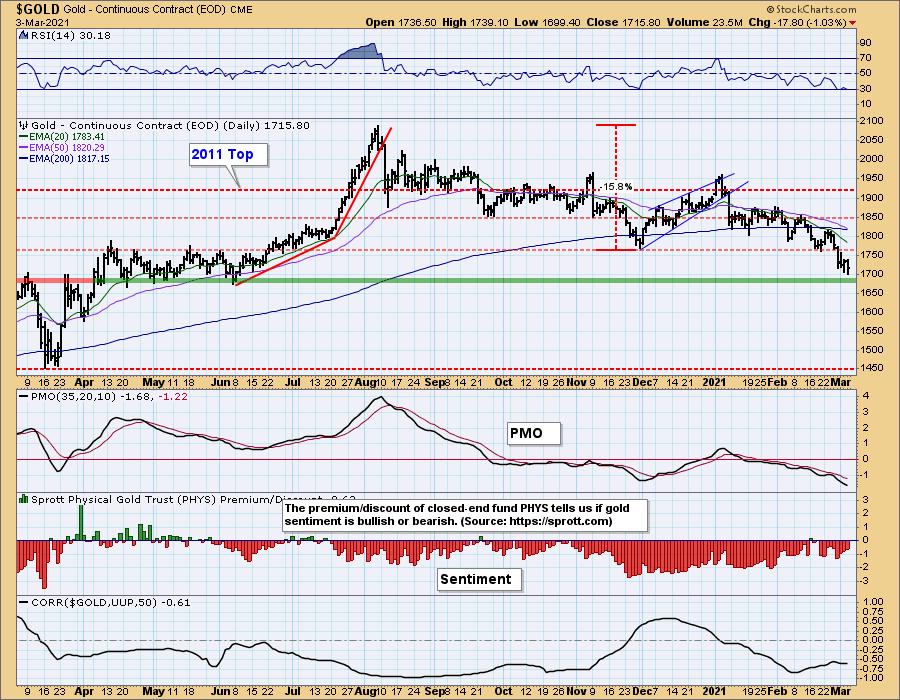
GOLD
IT Trend Model: NEUTRAL as of 1/14/2021
LT Trend Model: BUY as of 1/8/2019
GLD Daily Chart: Gold continued lower today. The RSI is now officially in oversold territory. While that generally is a good thing, Gold will have a "death cross" very soon. That gives the chart an even more bearish bias.
Full disclosure: I own GLD.
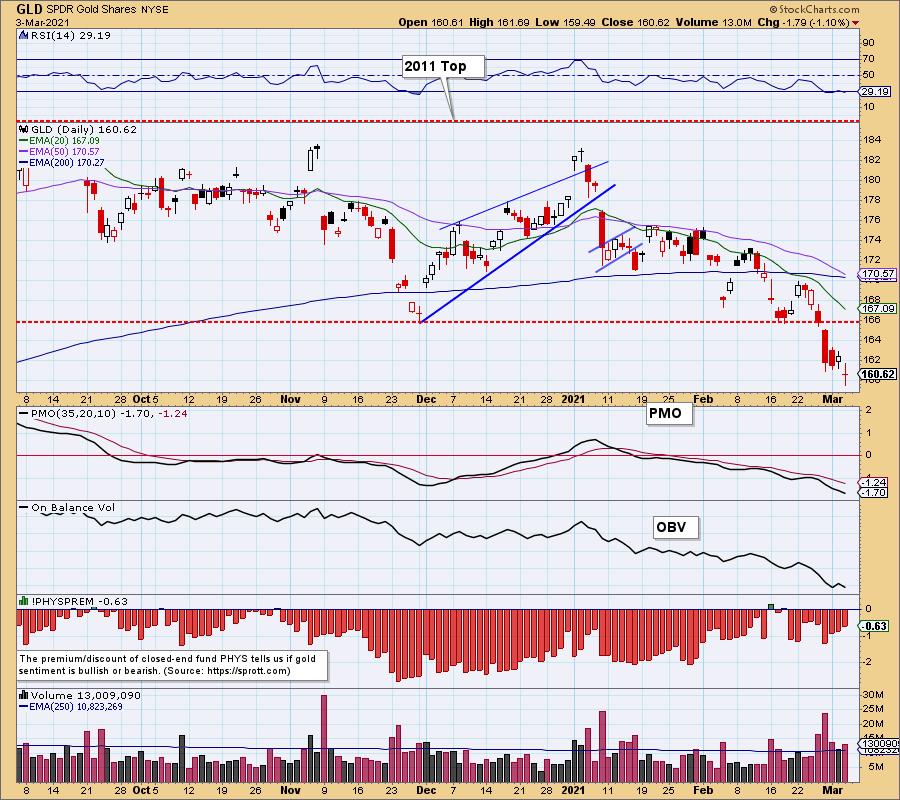
Gold is still holding above support and it is very oversold. However, I don't see anything here to suggest Gold will bounce. The inverse correlation with the Dollar is still strong. If the Dollar executes that double-bottom pattern, Gold will be in serious trouble.
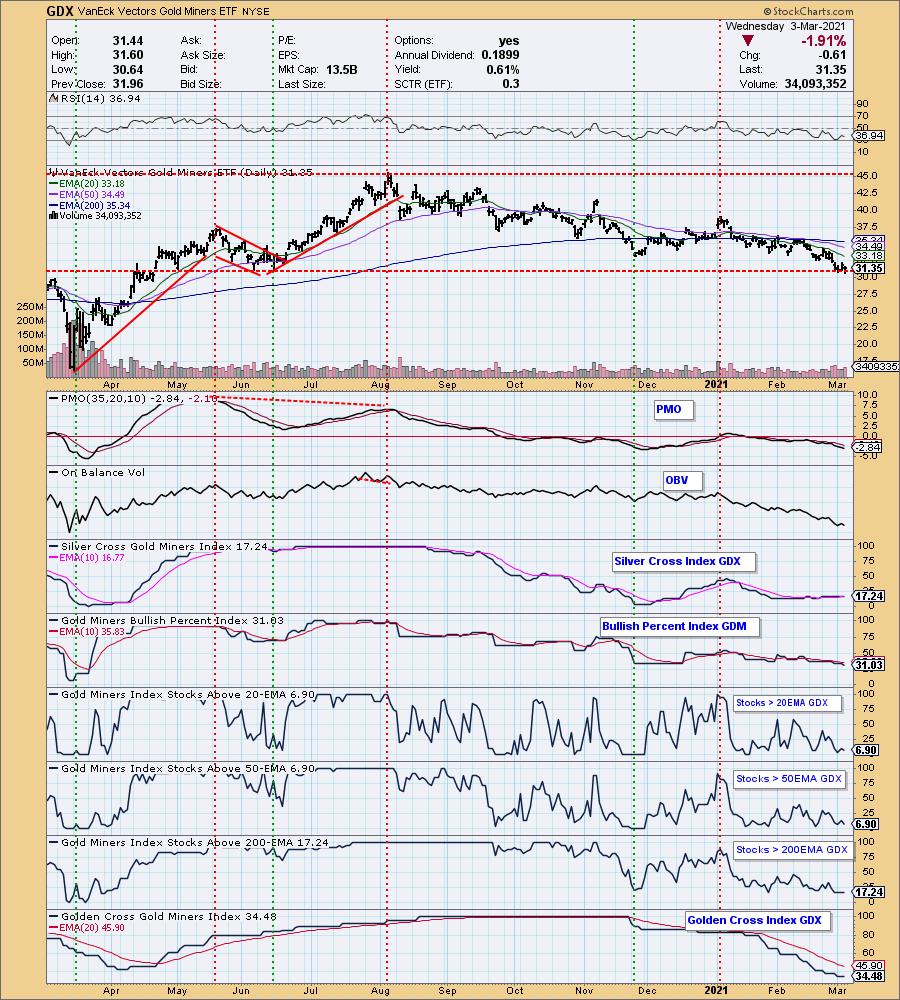
GOLD MINERS Golden and Silver Cross Indexes: GDX continues to cling to support at the June low. Given the bearishness of Gold right now, I am not confident it will hold this support level. Indicators are very oversold, but I don't see any signs of life there.
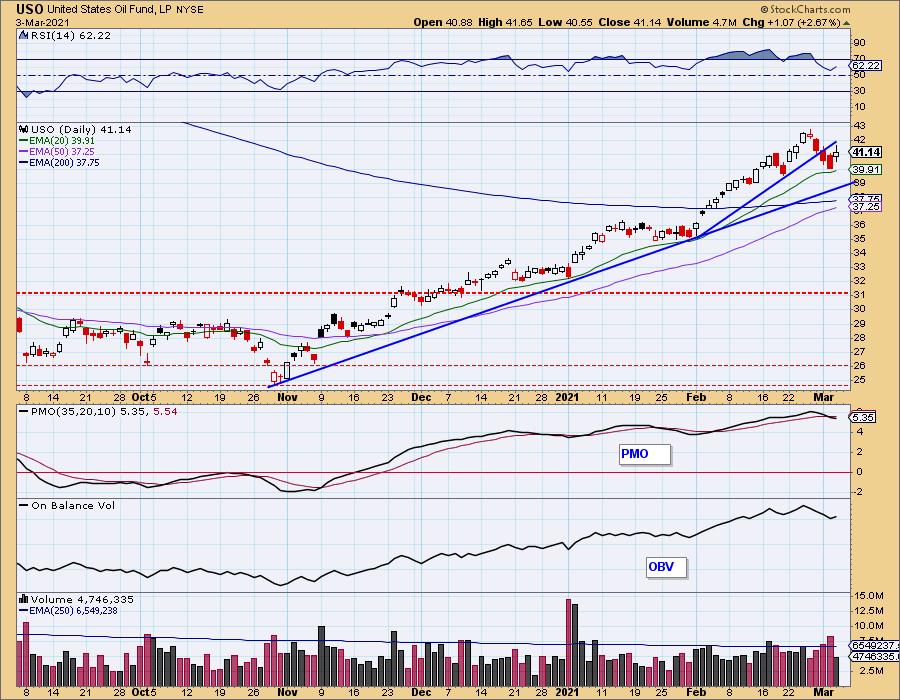
CRUDE OIL (USO)
IT Trend Model: BUY as of 10/20/2020
LT Trend Model: SELL as of 2/3/2020
USO Daily Chart: Perfect bounce off the 20-EMA today. The RSI is positive and not overbought. The PMO looks bearish, but it is already flattening. Interestingly, volume was very low on USO today given the strong rally. I still like Crude, especially now with this bounce off support. As noted yesterday, like clockwork, USO has been bouncing off the 20-EMA since its October low. I'm looking for a continuation.
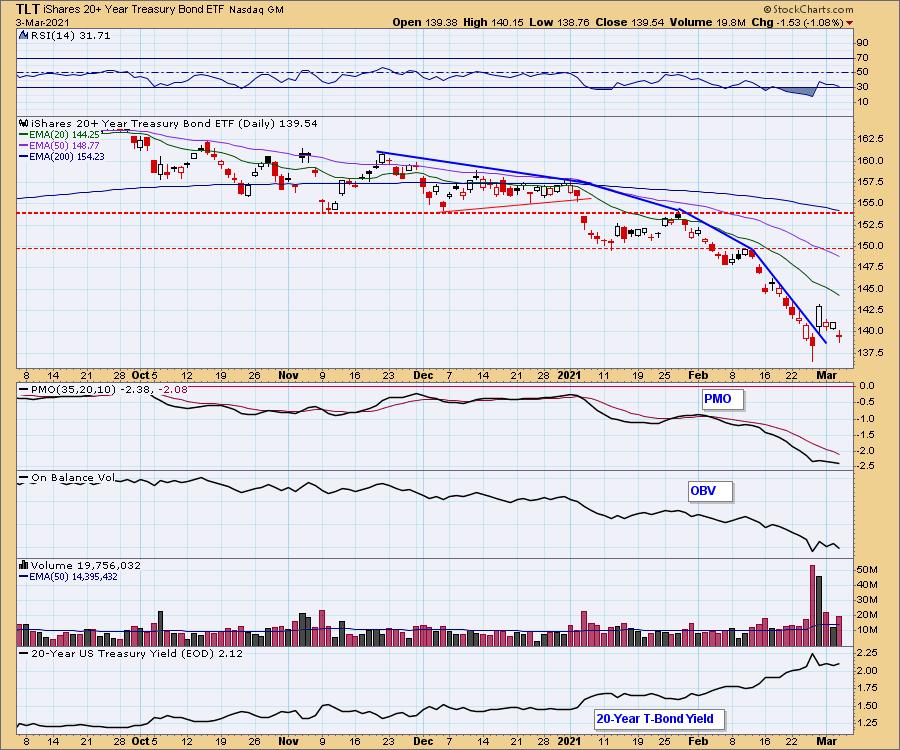
BONDS (TLT)
IT Trend Model: NEUTRAL as of 8/27/2020
LT Trend Model: SELL as of 1/8/2021
TLT Daily Chart: TLT broke out but quickly began another pullback. Yields and interest rates are likely to continue higher putting more pressure on Bonds. The RSI is oversold, though not as oversold as we've seen it previously. The PMO made an attempt to reverse on the breakout, but is topping again beneath the signal line.
Technical Analysis is a windsock, not a crystal ball.
Happy Charting! - Erin
Disclaimer: This blog is for educational purposes only and should not be construed as financial advice. The ideas and strategies should never be used without first assessing your own personal and financial situation, or without consulting a financial professional. Any opinions expressed herein are solely those of the author, and do not in any way represent the views or opinions of any other person or entity.
NOTE: The signal status reported herein is based upon mechanical trading model signals, specifically, the DecisionPoint Trend Model. They define the implied bias of the price index based upon moving average relationships, but they do not necessarily call for a specific action. They are information flags that should prompt chart review. Further, they do not call for continuous buying or selling during the life of the signal. For example, a BUY signal will probably (but not necessarily) return the best results if action is taken soon after the signal is generated. Additional opportunities for buying may be found as price zigzags higher, but the trader must look for optimum entry points. Conversely, exit points to preserve gains (or minimize losses) may be evident before the model mechanically closes the signal.
Helpful DecisionPoint Links:
DecisionPoint Alert Chart List
DecisionPoint Golden Cross/Silver Cross Index Chart List
DecisionPoint Sector Chart List
Price Momentum Oscillator (PMO)
Swenlin Trading Oscillators (STO-B and STO-V)
DecisionPoint is not a registered investment advisor. Investment and trading decisions are solely your responsibility. DecisionPoint newsletters, blogs, trading rooms or website materials should NOT be interpreted as a recommendation or solicitation to buy or sell any security or to take any specific action.