
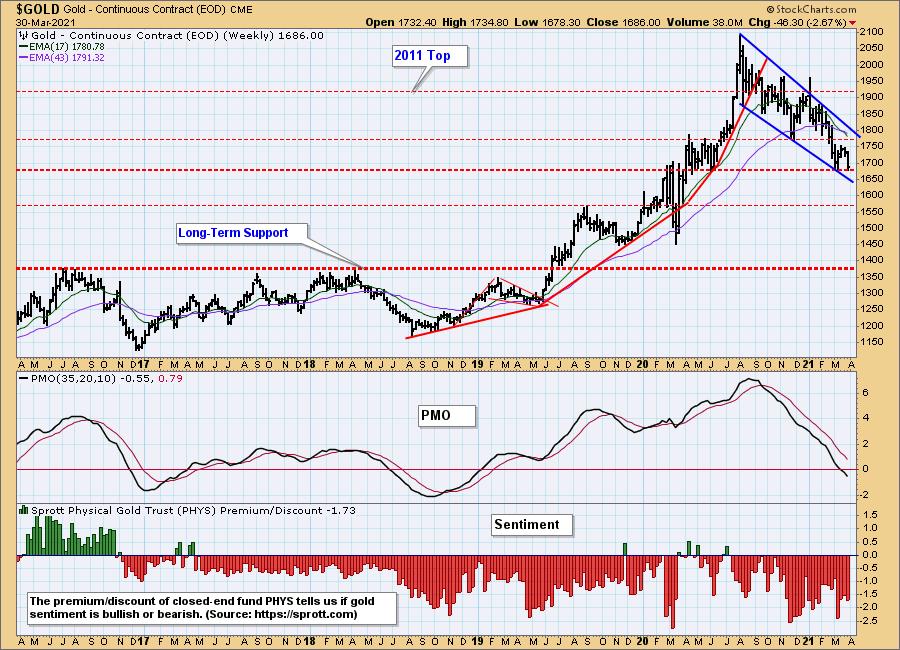
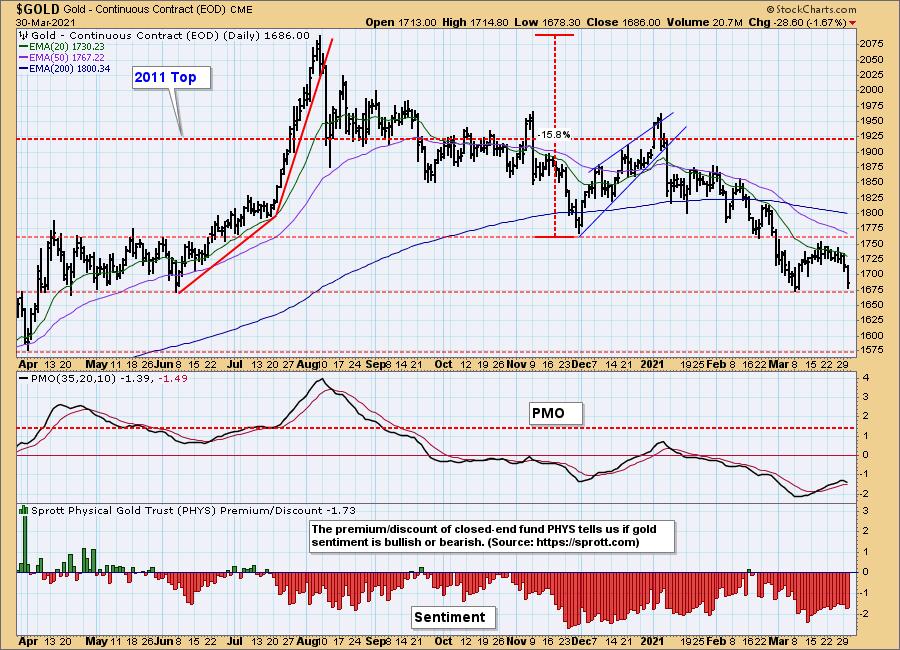
Gold plummeted today and that has it down -2.67% for the week. I decided to open with the weekly chart so we can see longer-term support levels. Currently price is seated right on support at about 1675. This is where it needs to rebound. We have a bullish falling wedge, but notice that the last rally didn't come close to tapping the declining tops trendline. Additionally, we have a negative 17/43-week crossover. The weekly PMO has dropped below the zero line. While discounts are high (meaning bearish sentiment), they aren't high enough to look for a reversal. I doubt this support level will hold.
The DecisionPoint Alert Weekly Wrap presents an end-of-week assessment of the trend and condition of the Stock Market, the U.S. Dollar, Gold, Crude Oil, and Bonds. The DecisionPoint Alert daily report (Monday through Thursday) is abbreviated and gives updates on the Weekly Wrap assessments.
Watch the latest episode of DecisionPoint on StockCharts TV's YouTube channel here!
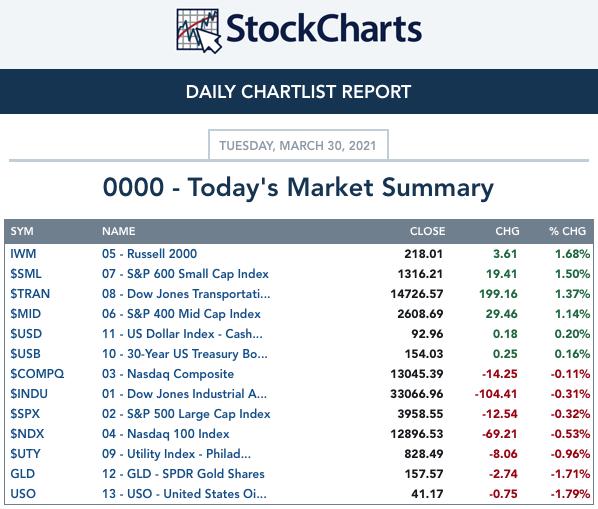
MAJOR MARKET INDEXES
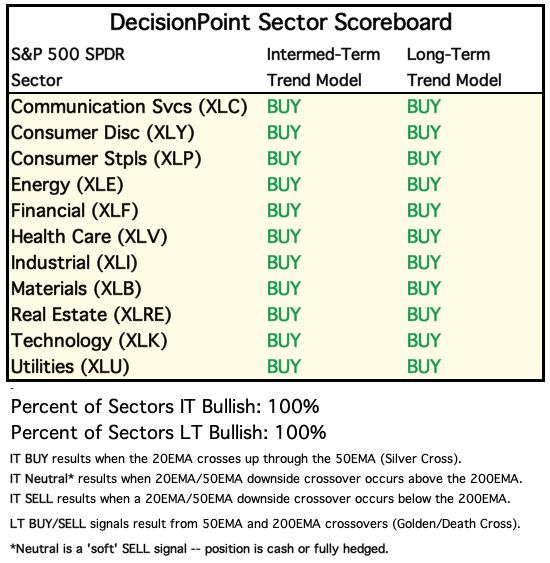
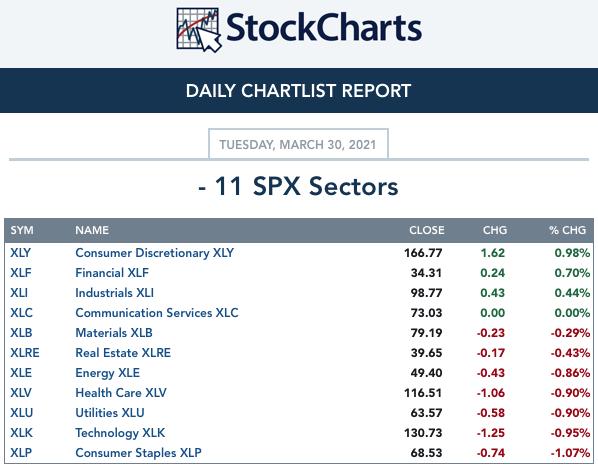
SECTORS
Each S&P 500 Index component stock is assigned to one, and only one, of 11 major sectors. This is a snapshot of the Intermediate-Term (Silver Cross) and Long-Term (Golden Cross) Trend Model signal status for those sectors.
CLICK HERE for Carl's annotated Sector charts.
THE MARKET (S&P 500)
IT Trend Model: BUY as of 5/8/2020
LT Trend Model: BUY as of 6/8/2020
SPY Daily Chart: Despite yesterday's new PMO crossover BUY signal and the positive RSI, the market closed lower. Overhead resistance at all-time highs is posing difficult resistance. Total volume shrunk today on the decline which is good and interestingly, the VIX readings were lower than yesterday's which suggests bullish sentiment is enduring in spite of failure to reach all-time highs.
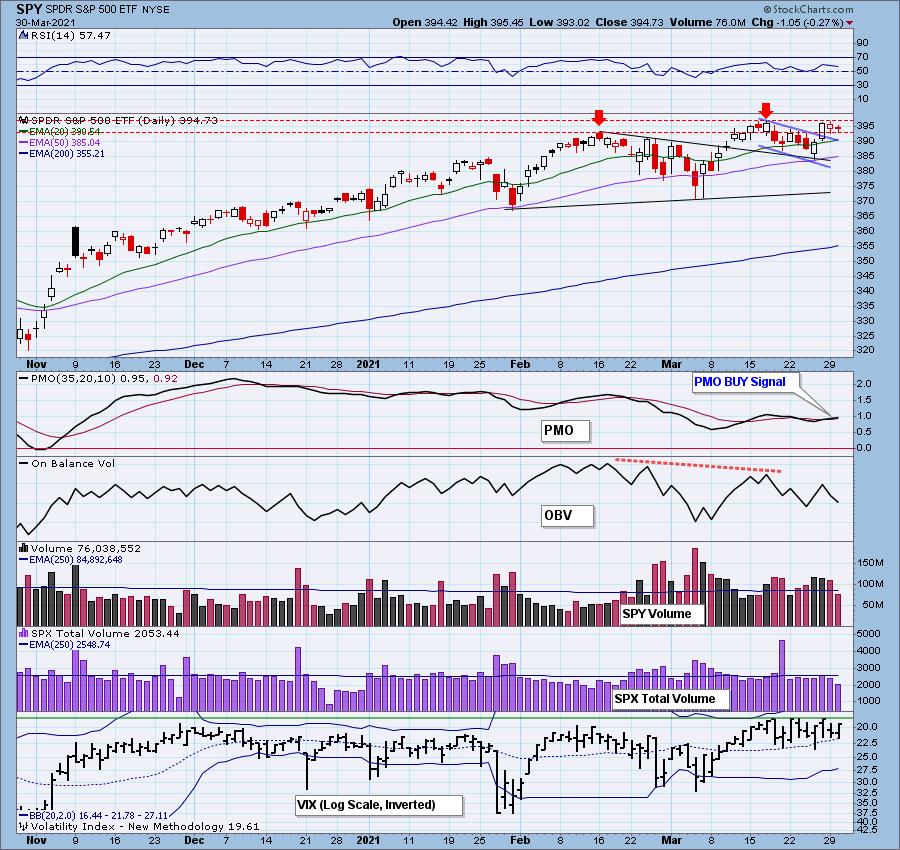
The bearish rising wedge suggests we should see the intermediate-term rising trend broken. Notice that price wasn't able to reach the top of the wedge before turning down.

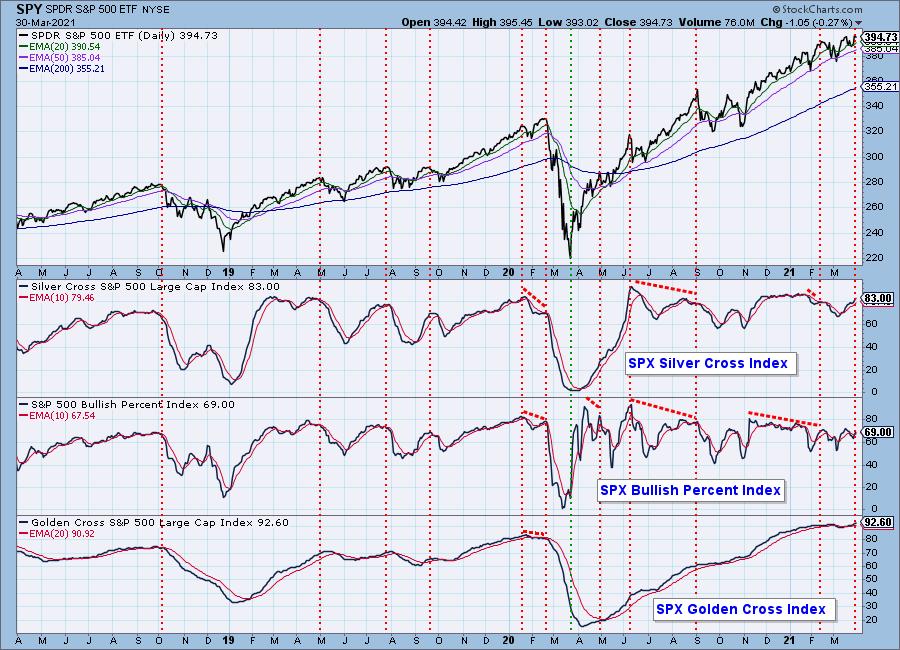
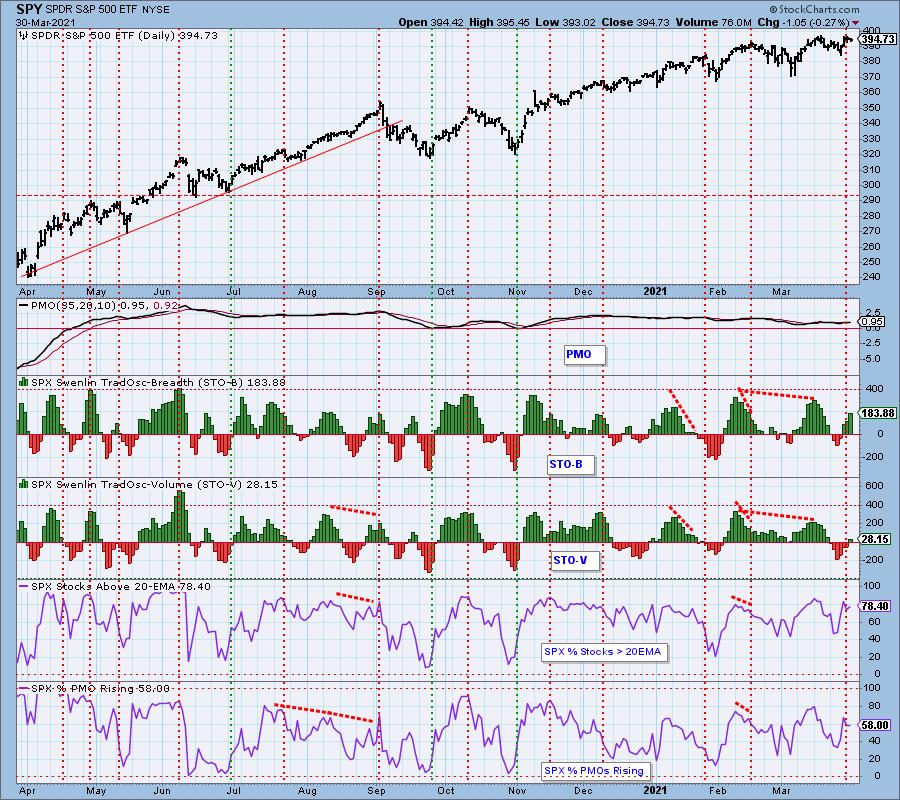
Participation: The following chart uses different methodologies for objectively showing the depth and trend of participation for intermediate- and long-term time frames.
- The Silver Cross Index (SCI) shows the percentage of SPX stocks on IT Trend Model BUY signals (20-EMA > 50-EMA).
- The Golden Cross Index (GCI) shows the percentage of SPX stocks on LT Trend Model BUY signals (50-EMA > 200-EMA).
- The Bullish Percent Index (BPI) shows the percentage of SPX stocks on Point & Figure BUY signals.
The SCI was stagnant today, holding the same reading as yesterday. The BPI and GCI are both still rising, but it isn't helping price.
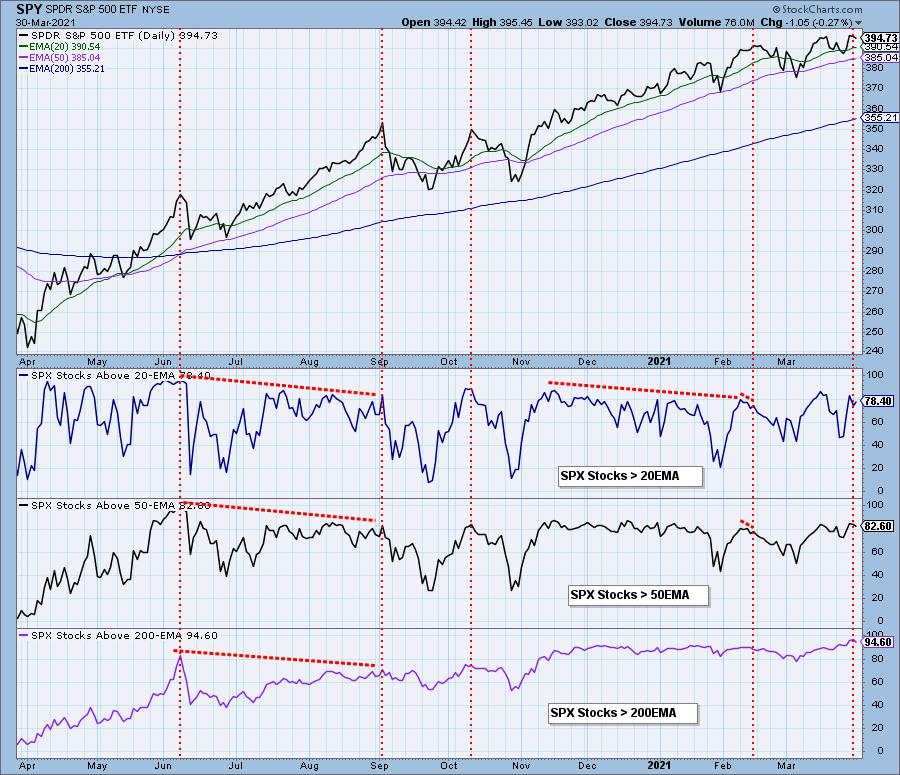
Interestingly on today's decline, we saw an expansion of stocks above their 20-EMA. While the %Stocks > 50/200-EMAs declined, they are both extremely overbought right now.
Climax Analysis: No climaxes today. New Highs pared back as expected on a decline.
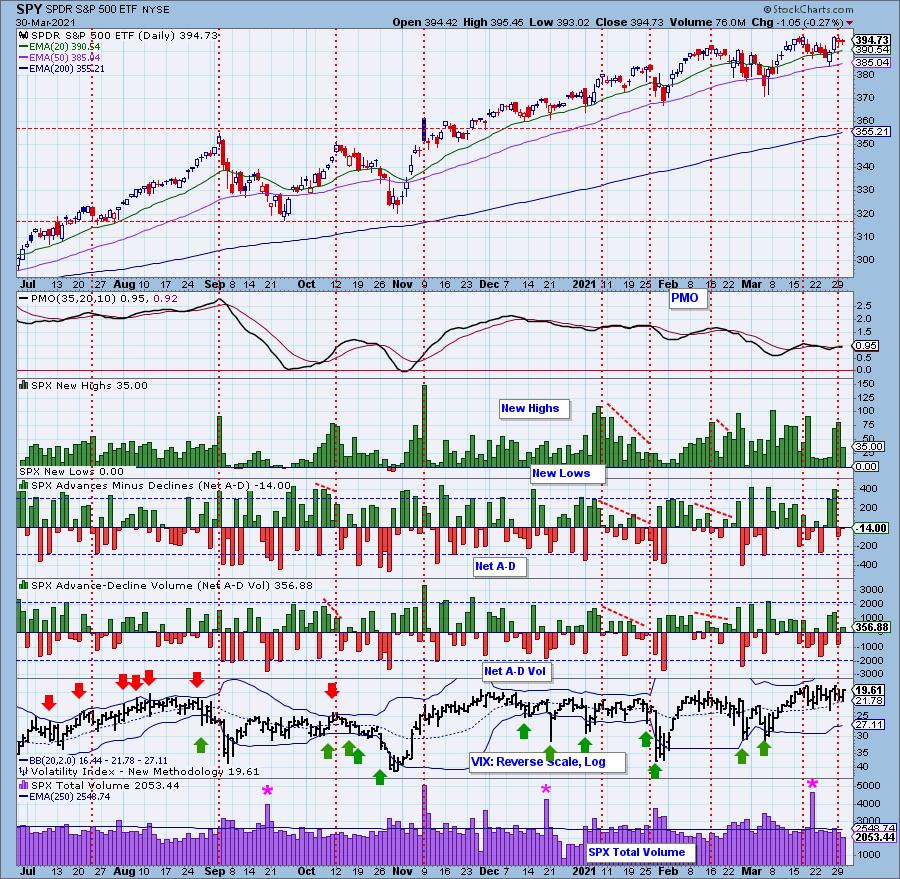
Short-Term Market Indicators: The short-term market trend is DOWN and the condition is NEUTRAL to OVERBOUGHT.
Both of these indicators are continuing to rise which suggests we should see higher prices or at least consolidation.
Intermediate-Term Market Indicators: The intermediate-term market trend is UP and the condition is OVERBOUGHT. The market bias is BULLISH.
Very strange that these indicators still traveling in different directions. The ITBM is near overbought and rising, while the ITVM is falling and nearing neutral territory. As I mentioned yesterday, this is telling us that there is a problem with volume support. This could indicate that we won't see a breakout to new all-time highs, but consolidation instead.
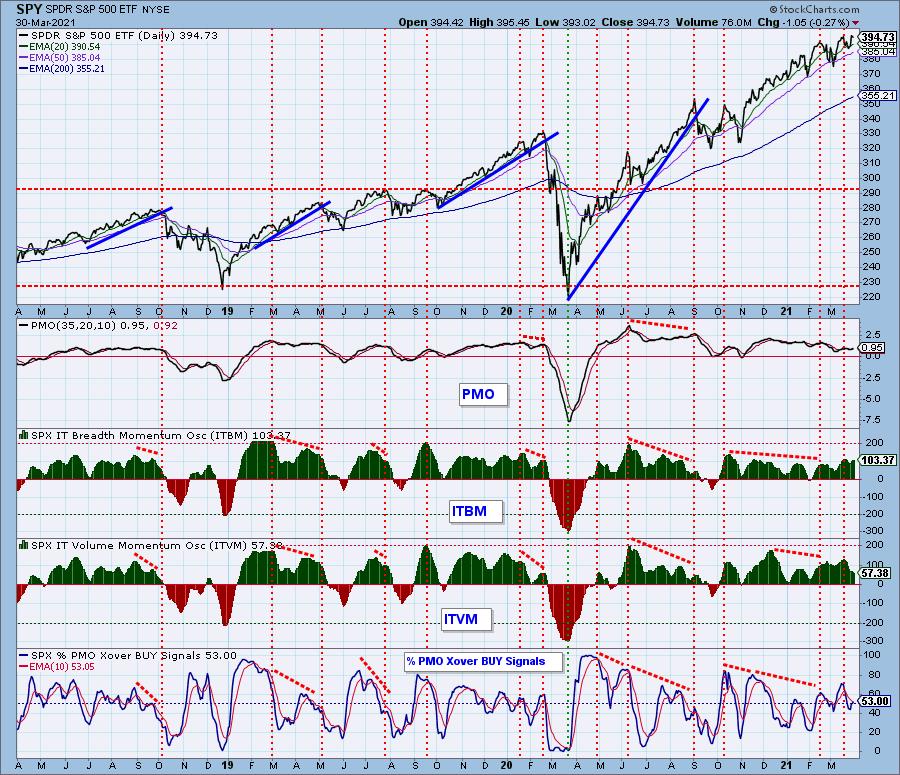
CONCLUSION: The STOs are continuing to rise and they really aren't overbought yet. This is accompanied by a new PMO BUY signal yesterday and a positive RSI. Short-term participation continued to improve as more stocks moved above their 20-EMAs. There is a strong bullish bias so we should be seeing higher prices. Since we are not, the bullishness of market participants (remember, lower VIX reading?) is likely preventing a stronger decline. If prices continue to fall, that bullish bias will likely disintegrate and a pullback or correction will start in earnest. Continue to proceed with caution.
Have you subscribed the DecisionPoint Diamonds yet? DP does the work for you by providing handpicked stocks/ETFs from exclusive DP scans! Add it with a discount! Contact support@decisionpoint.com for more information!
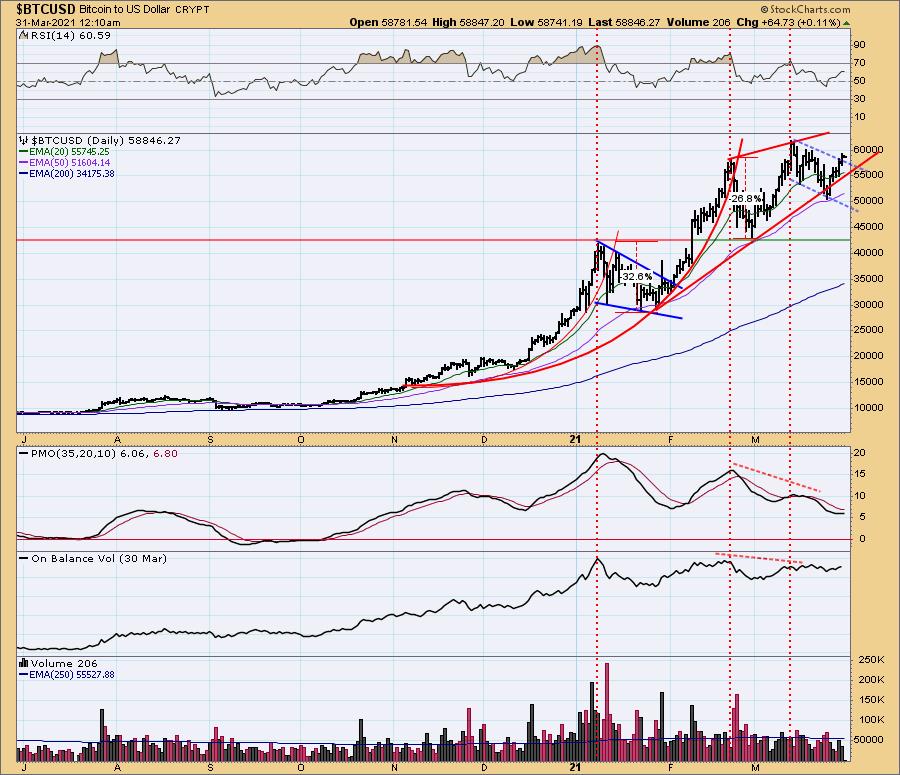
BITCOIN
Bitcoin broke out from its declining trend channel and is making its way up to the top of the bearish rising wedge. Given the PMO is turning up and there is a positive RSI, I would expect it to at least test all-time highs, if not vault them.
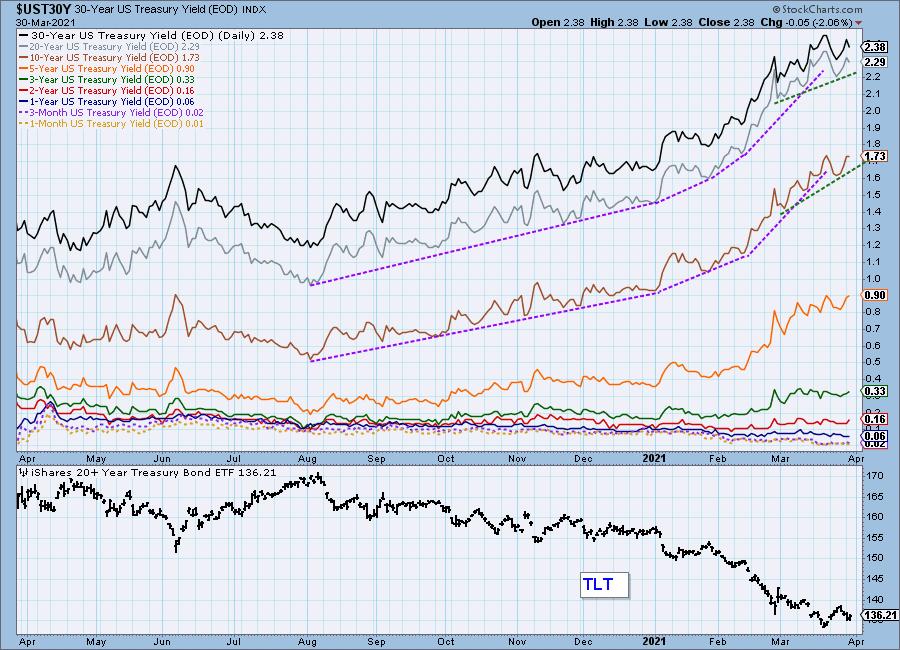
INTEREST RATES
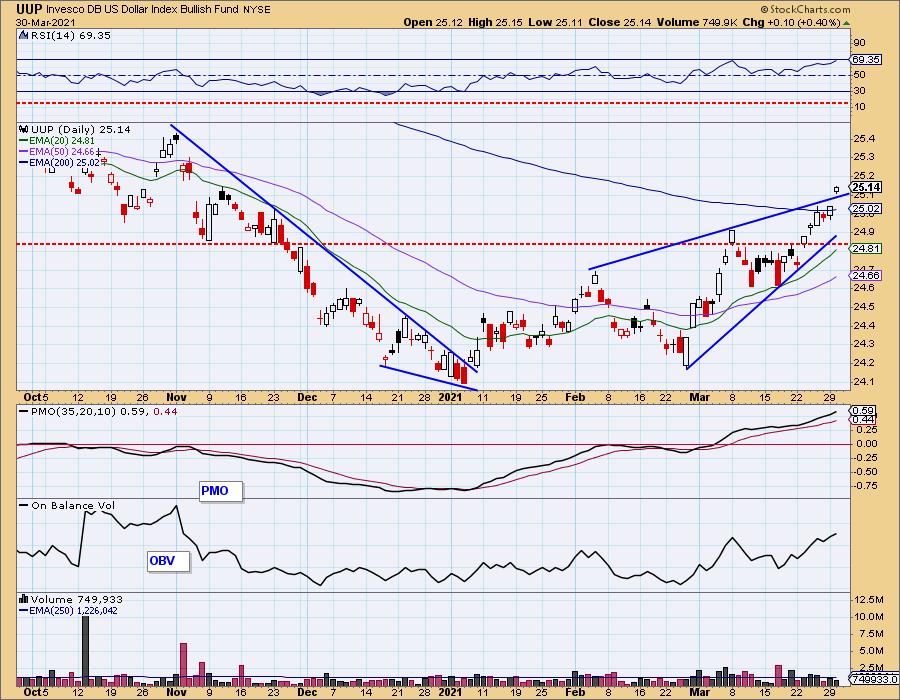
DOLLAR (UUP)
IT Trend Model: BUY as of 3/5/2021
LT Trend Model: SELL as of 7/10/2020
UUP Daily Chart: The rising wedge is disintegrating as price broke out above it rather than breakdown below it as the pattern suggests. Today's rally finally got price above the 200-EMA. The PMO and RSI are rising but both are getting overbought.
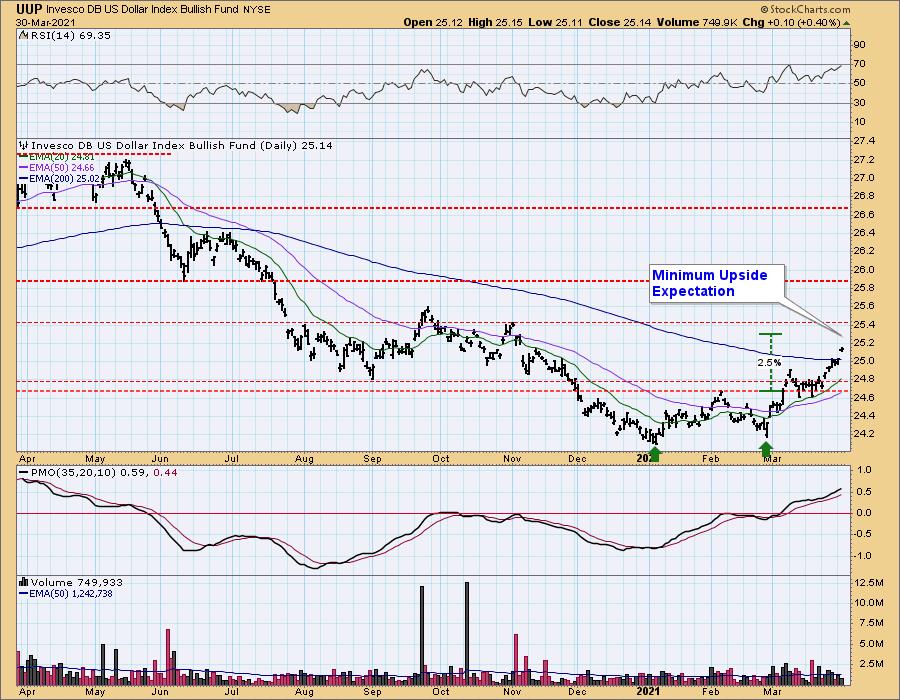
It appears this rally is fulfilling the upside expectation of the bullish double-bottom. Remember that pattern targets are minimum upside targets. We should see a test of overhead resistance at $25.40.
GOLD
IT Trend Model: NEUTRAL as of 1/13/2021
LT Trend Model: SELLas of 3/4/2021
GLD Daily Chart: As noted in the opening, Gold was hit hard today. The PMO is now poised to give us a crossover SELL signal which is only made worse by a PMO that is well below the zero line. The RSI is negative and not really oversold yet.
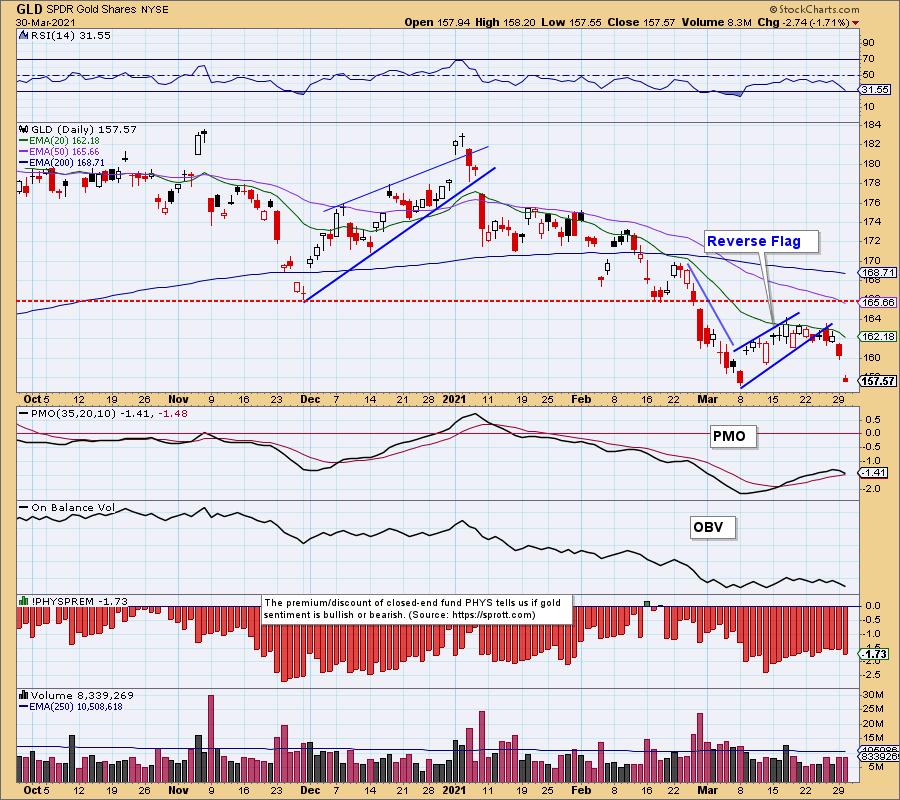
GOLD Daily Chart: The only good news would be that, at least today, price is holding above support at the June 2020 and March 2021 low. There was a slight increase in discounts, but we aren't seeing oversold readings just yet.
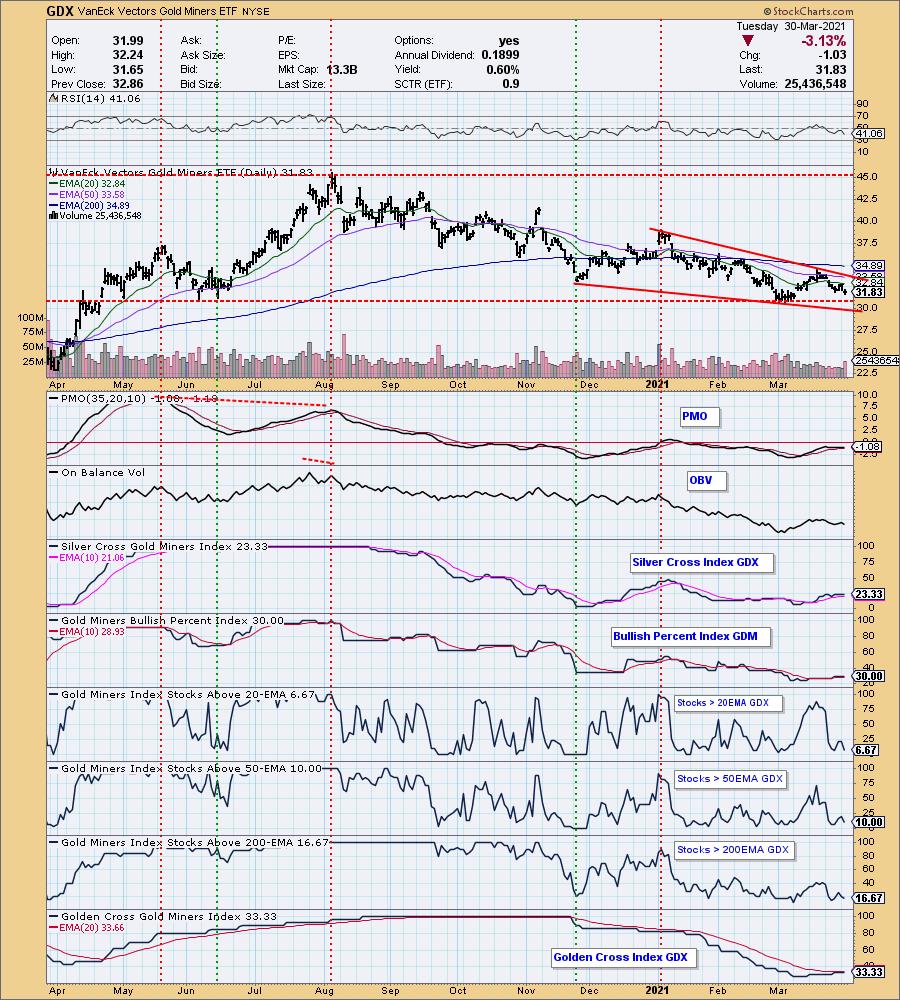
GOLD MINERS Golden and Silver Cross Indexes: The drop in Gold was too much for Miners which fell even harder. The 'under the hood' indicators had been showing improvement, but no longer. Thankfully support is nearing at this month's low. If it can hold that support and rally again, I would look for a breakout. For now, probably best to leave them alone.
CRUDE OIL (USO)
IT Trend Model: BUY as of 11/23/2020
LT Trend Model: BUY as of 3/9/2021
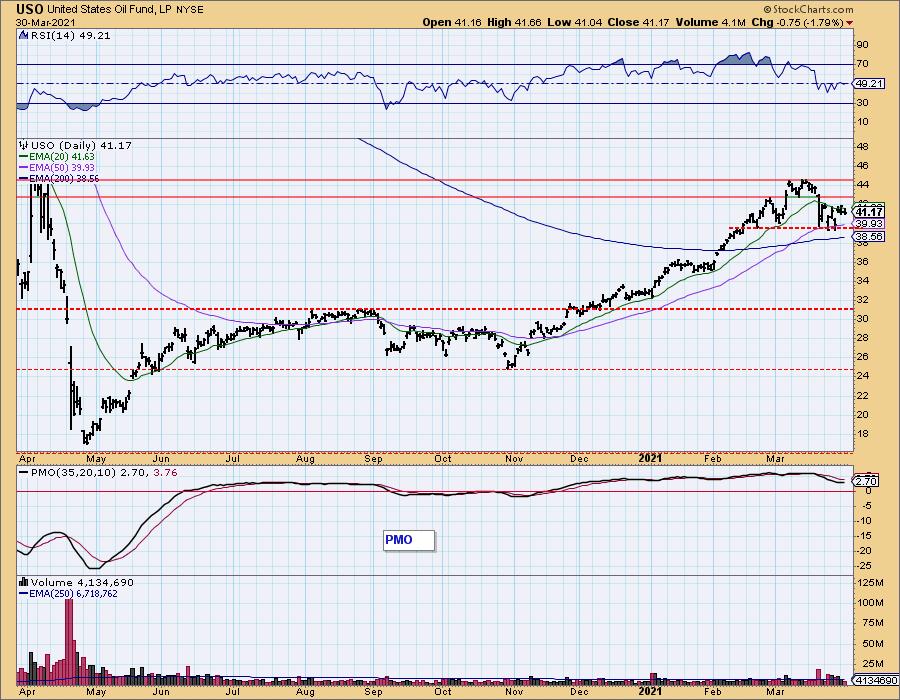
USO Daily Chart: USO is struggling to keep its intermediate-term rising trend alive. Given the now negative RSI and declining PMO, I would look for a test of this month's low.
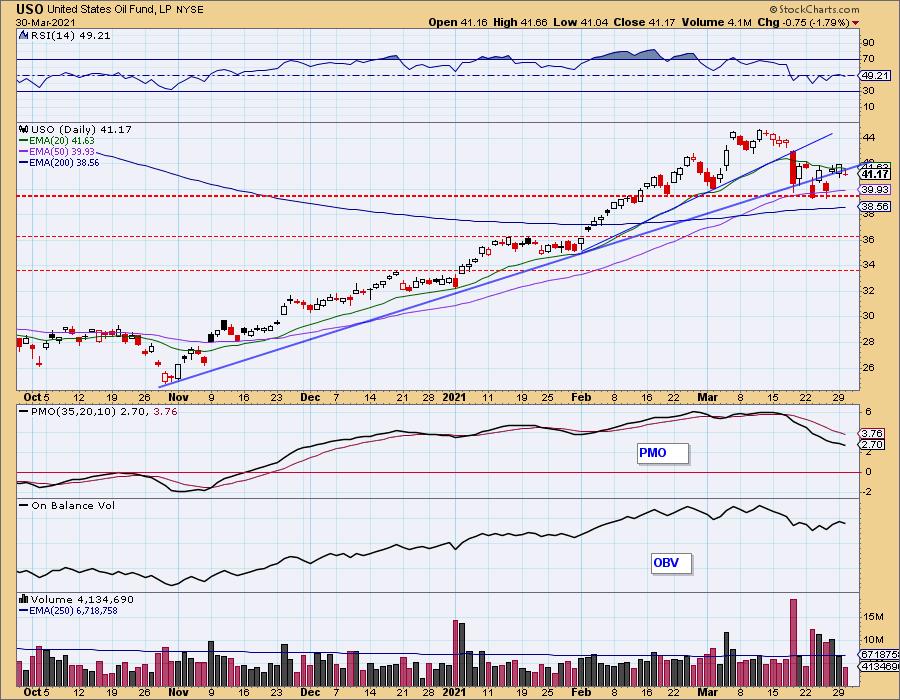
My concern is a possible complex head and shoulders pattern developing. If it is what I think it is, we should prepare ourselves for a possible breakdown below the 200-EMA.
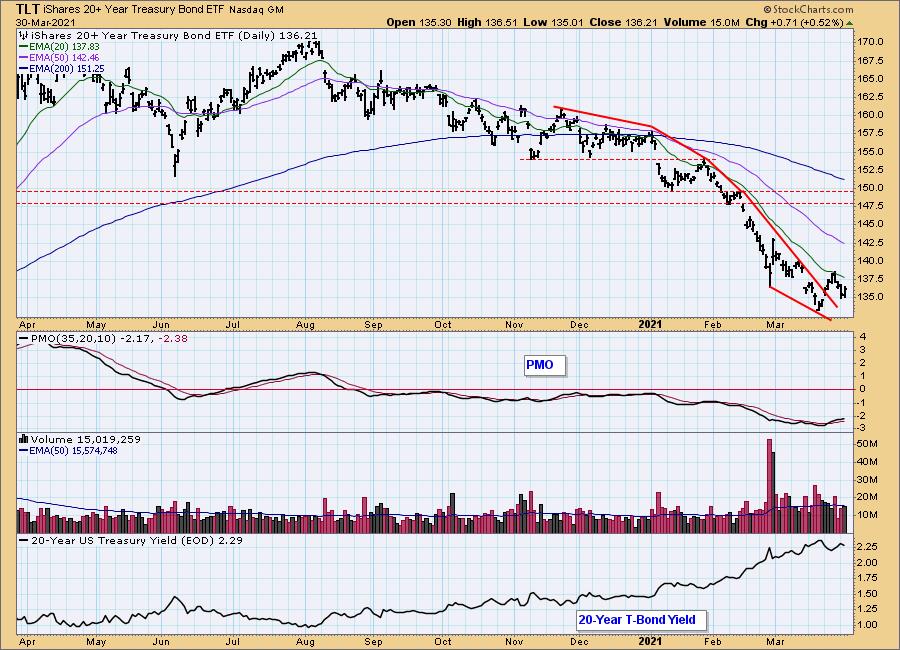
BONDS (TLT)
IT Trend Model: NEUTRALas of 8/27/2020
LT Trend Model: SELLas of 1/8/2021
TLT Daily Chart: Yesterday's comments still apply:
"TLT had just broken out of a bullish falling wedge, only to be turned away at the 20-EMA. Support has now been lost again at the February low. The PMO is positive, but the RSI remains below net neutral (50). Yields broke down last week, but they have quickly recaptured that level. As noted on the yield array above, there is still a rising trend in yields, it just isn't as steep."
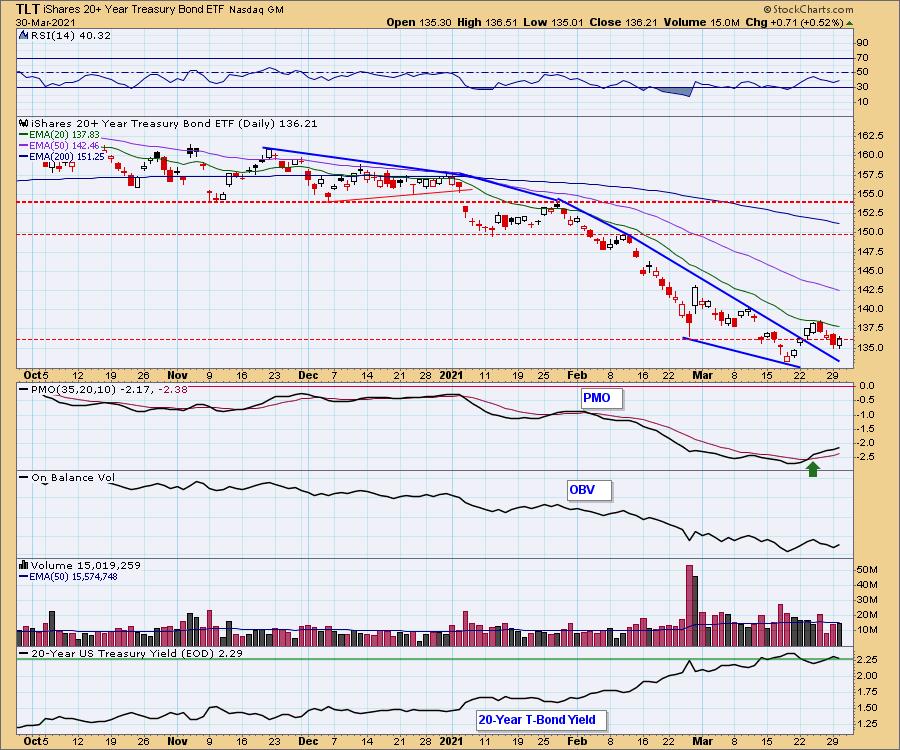
We would expect to see TLT test support at this month's low.
Technical Analysis is a windsock, not a crystal ball.
Disclaimer: This blog is for educational purposes only and should not be construed as financial advice. The ideas and strategies should never be used without first assessing your own personal and financial situation, or without consulting a financial professional. Any opinions expressed herein are solely those of the author, and do not in any way represent the views or opinions of any other person or entity.
NOTE: The signal status reported herein is based upon mechanical trading model signals, specifically, the DecisionPoint Trend Model. They define the implied bias of the price index based upon moving average relationships, but they do not necessarily call for a specific action. They are information flags that should prompt chart review. Further, they do not call for continuous buying or selling during the life of the signal. For example, a BUY signal will probably (but not necessarily) return the best results if action is taken soon after the signal is generated. Additional opportunities for buying may be found as price zigzags higher, but the trader must look for optimum entry points. Conversely, exit points to preserve gains (or minimize losses) may be evident before the model mechanically closes the signal.
Helpful DecisionPoint Links:
DecisionPoint Alert Chart List
DecisionPoint Golden Cross/Silver Cross Index Chart List
DecisionPoint Sector Chart List
Price Momentum Oscillator (PMO)
Swenlin Trading Oscillators (STO-B and STO-V)
DecisionPoint is not a registered investment advisor. Investment and trading decisions are solely your responsibility. DecisionPoint newsletters, blogs or website materials should NOT be interpreted as a recommendation or solicitation to buy or sell any security or to take any specific action.