
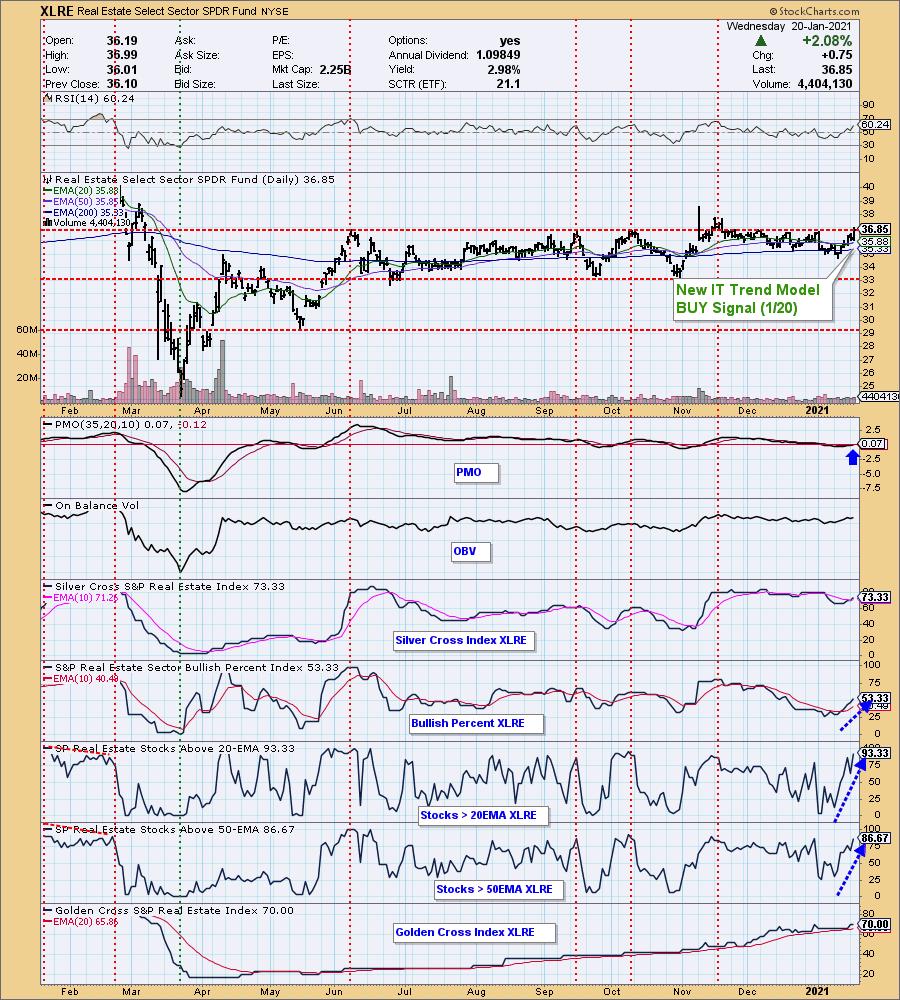
Two big signal changes today. I'll look at the SPY's new PMO BUY signal in the "Market" section. Let's talk real estate. XLRE has enjoyed a rally this past week. Today our Intermediate-Term Trend Model triggered a BUY signal as the 20-EMA crossed above the 50-EMA. XLRE is working on a breakout from the very strong overhead resistance area at $36.80. It tried back in November to sustain a move outside of the trading range but failed. We saw similar participation back then with an increase of stocks gaining price support at the 20/50-EMAs. After so many attempts to breakout, it is certainly poised to attempt it again.
The indicators under the hood show increased participation, although those readings are already overbought.
The DecisionPoint Alert Weekly Wrap presents an end-of-week assessment of the trend and condition of the Stock Market, the U.S. Dollar, Gold, Crude Oil, and Bonds. The DecisionPoint Alert daily report (Monday through Thursday) is abbreviated and gives updates on the Weekly Wrap assessments.
Watch the latest episode of DecisionPoint on StockCharts TV's YouTube channel here!
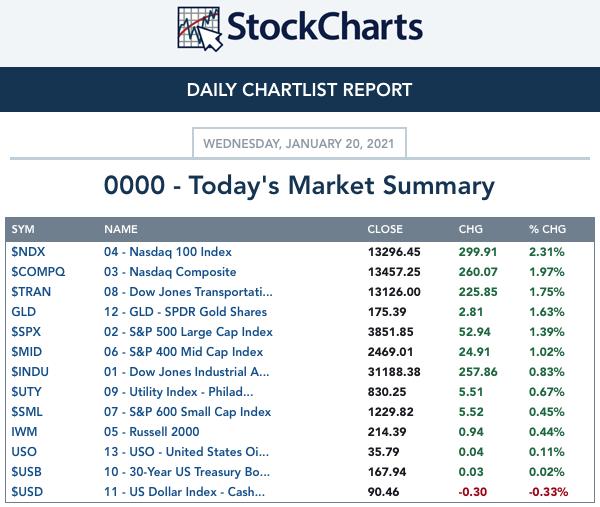
MAJOR MARKET INDEXES
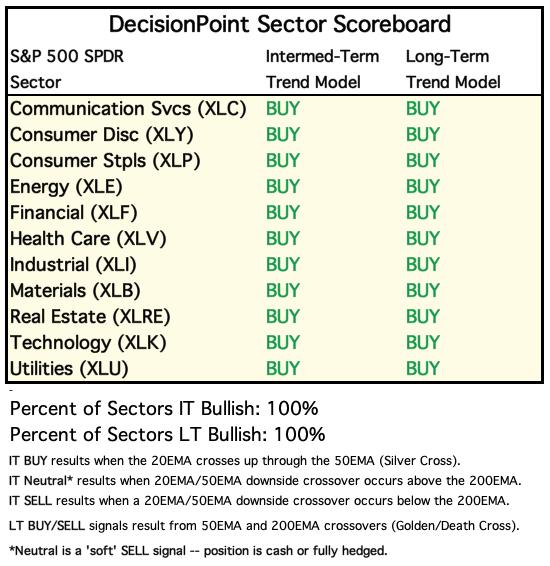
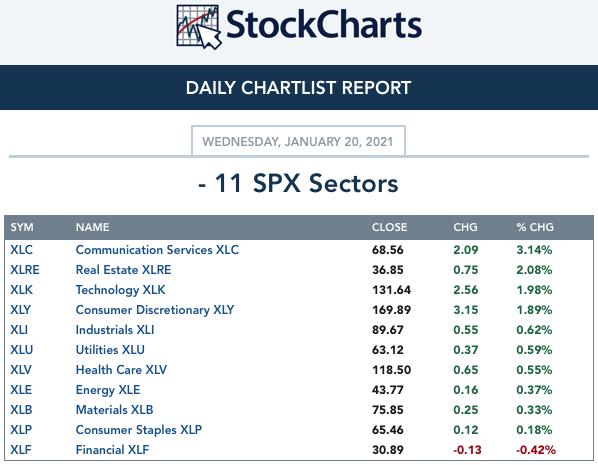
SECTORS
Each S&P 500 Index component stock is assigned to one, and only one, of 11 major sectors. This is a snapshot of the Intermediate-Term (Silver Cross) and Long-Term (Golden Cross) Trend Model signal status for those sectors.
CLICK HERE for Carl's annotated Sector charts.
THE MARKET (S&P 500)
IT Trend Model: BUY as of 5/8/2020
LT Trend Model: BUY as of 6/8/2020
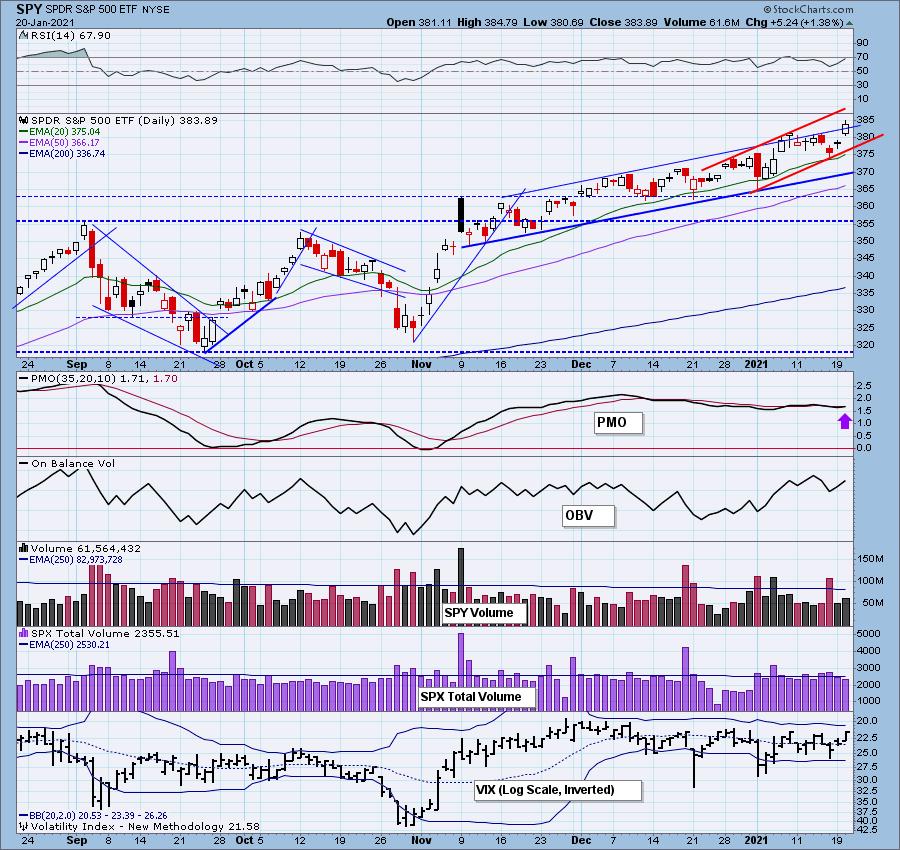
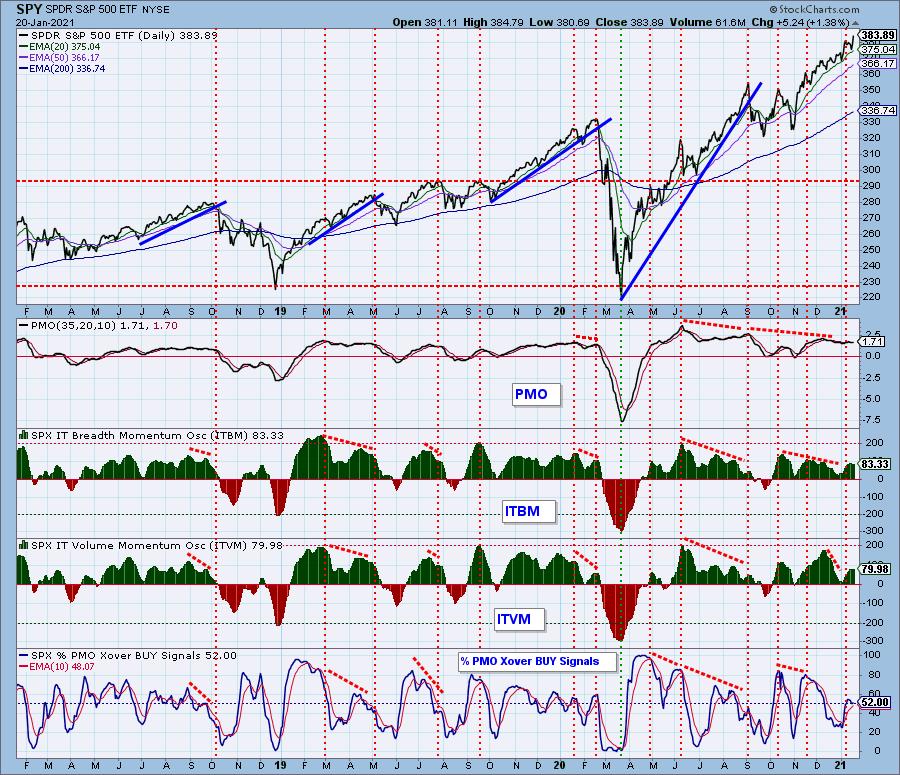
SPY Daily Chart: Today the PMO crossed above its signal line to give us a new PMO BUY signal on the SPY and SPX. I was looking at it and I decided to annotate a new rising trend channel in the shorter term. The RSI is positive and not quite overbought yet.

It's Free!
***Click here to register for this recurring free DecisionPoint Trading Room on Mondays at Noon ET!***
We didn't hold a 1/18 Trading Room. Did you miss the 1/11 trading room? Here is a link to the recording -- access code: ?H++t+d5
For best results, copy and paste the access code to avoid typos.
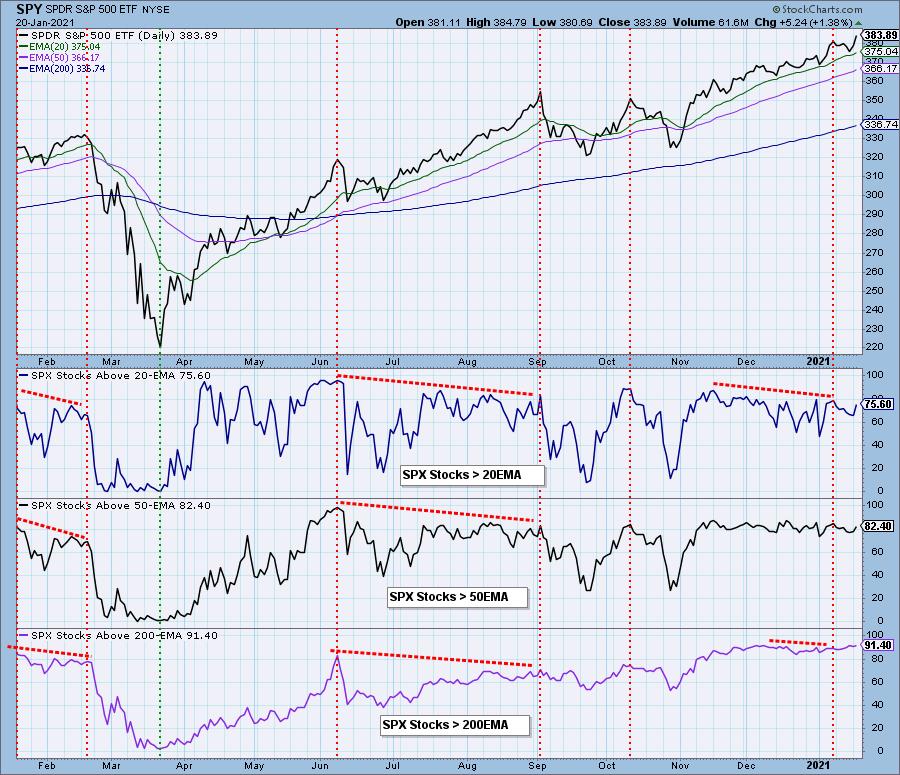
Participation: The following chart uses different methodologies for objectively showing the depth and trend of participation for intermediate- and long-term time frames.
- The Silver Cross Index (SCI) shows the percentage of SPX stocks on IT Trend Model BUY signals (20-EMA > 50-EMA).
- The Golden Cross Index (GCI) shows the percentage of SPX stocks on LT Trend Model BUY signals (50-EMA > 200-EMA).
- The Bullish Percent Index (BPI) shows the percentage of SPX stocks on Point & Figure BUY signals.
The BPI and SCI switched places today with the BPI rising and the SCI falling. Overall they are moving mostly sideways. The GCI topped today which was a surprise on a 1.38% rally. It is highly overbought. We will watch for declining tops on this indicator similar to February 2020 if it decides to pullback a bit more before turning back up.
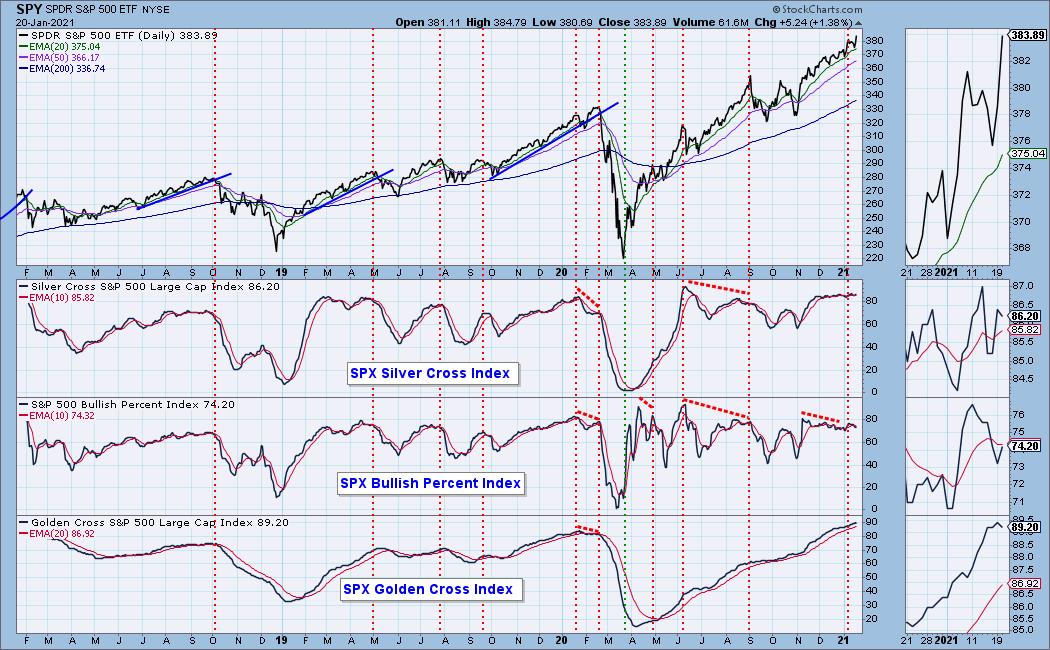
Participation was sound on today's rally. The readings are somewhat overbought, but could accommodate more upside.
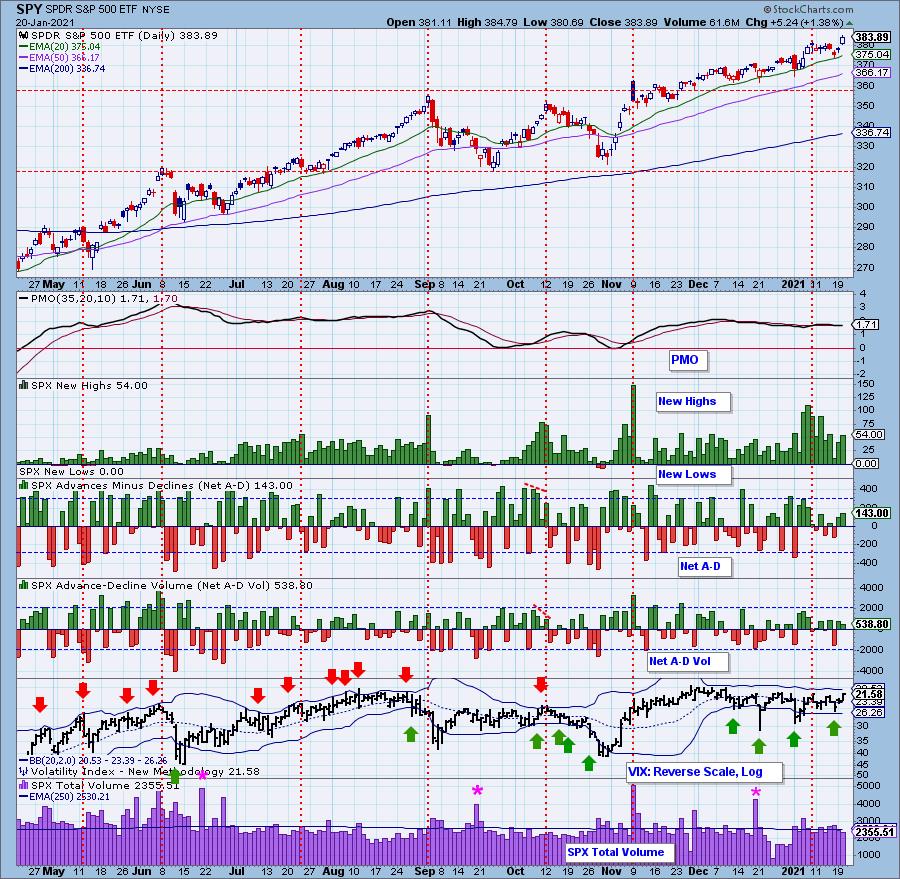
Climactic Market Indicators: I was somewhat surprised not to see a climax on this chart given today's strong rally. We did see an increase in New Highs, but nothing climactic. The VIX is working its way to the top Bollinger Band on the inverted scale. A VIX reading less than 20 would concern me and likely signal a short-term decline. Total volume was a bit below average which is also surprising given today's big rally.
Short-Term Market Indicators: The short-term market trend is UP and the condition is NEUTRAL.
The STOs were mixed today with the STO-B rising slightly and the STO-V dropping slightly. Overall I read them as neutral. They never really reached oversold territory so if we continue to see them rise it would confirm that the bullish bias is strong and in force.
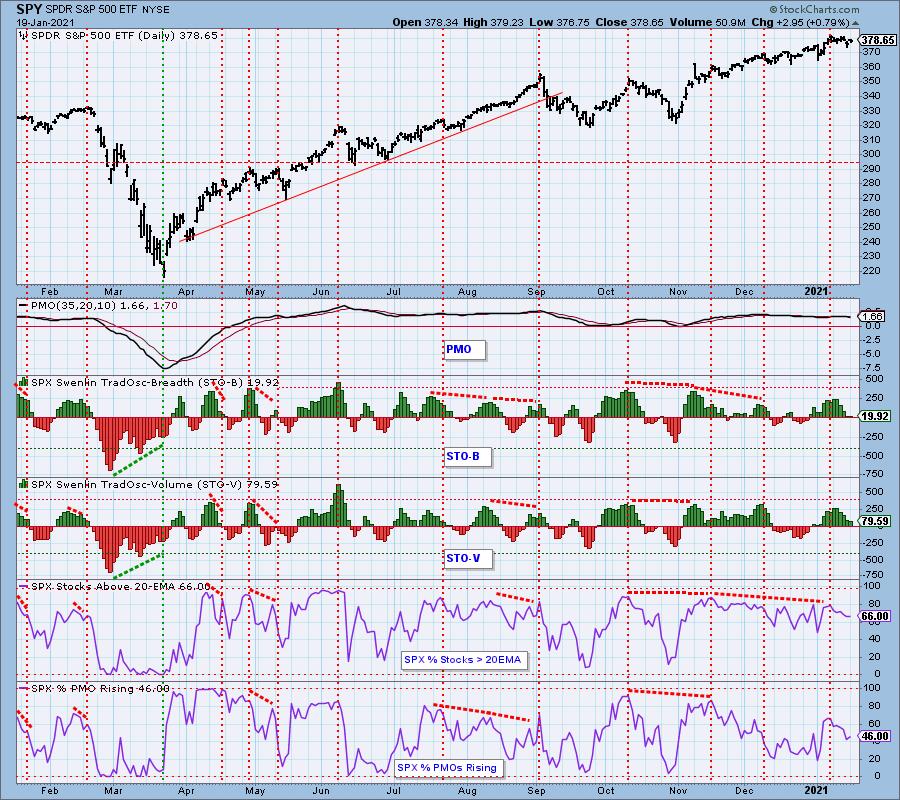
Intermediate-Term Market Indicators: The intermediate-term market trend is UP and the condition is SOMEWHAT OVERBOUGHT. The intermediate-term market bias is BULLISH.
Both of these indicators rose slightly on the day which is bullish for the intermediate term. We definitely want to see them continue to rise in order to avoid a negative divergence with price.
CONCLUSION: As expected, the market punctuated the new President's arrival with a strong rally. A new steeper rising trend channel has developed. I suspect a continuation of the rising trend will continue given the new PMO BUY signal on the SPY. The STOs have basically stopped their decline and the ITBM/ITVM are rising again. The VIX readings are getting lower and lower. In the short term, we will watch the VIX closely as a reading below 20 will likely signal a decline ahead.
Have you subscribed the DecisionPoint Diamonds yet? DP does the work for you by providing handpicked stocks/ETFs from exclusive DP scans! Add it with a discount! Contact support@decisionpoint.com for more information!
INTEREST RATES
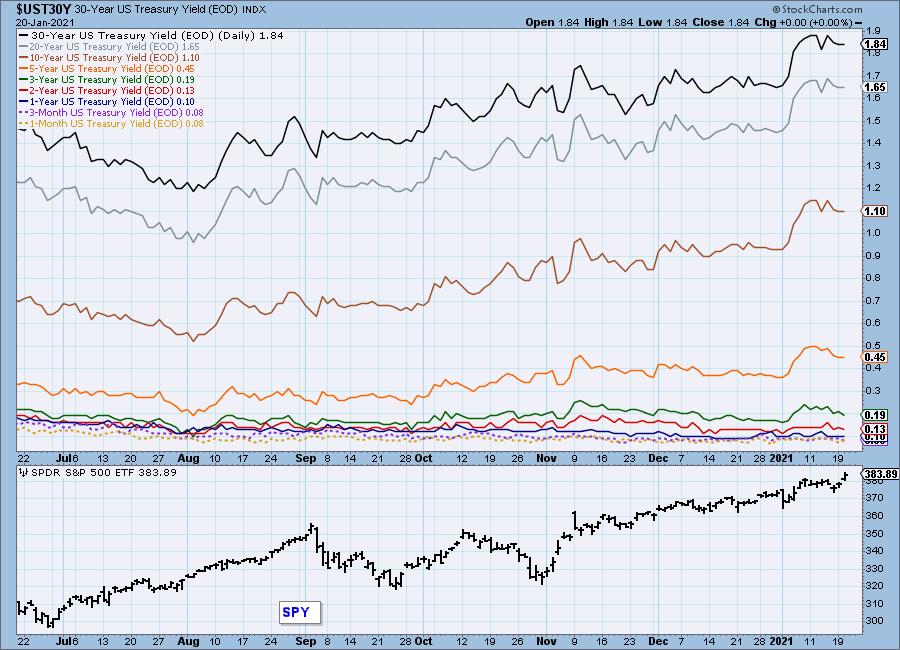
This chart is included so we can monitor rate inversions. In normal circumstances the longer money is borrowed the higher the interest rate that must be paid. When rates are inverted, the reverse is true.
DOLLAR (UUP)
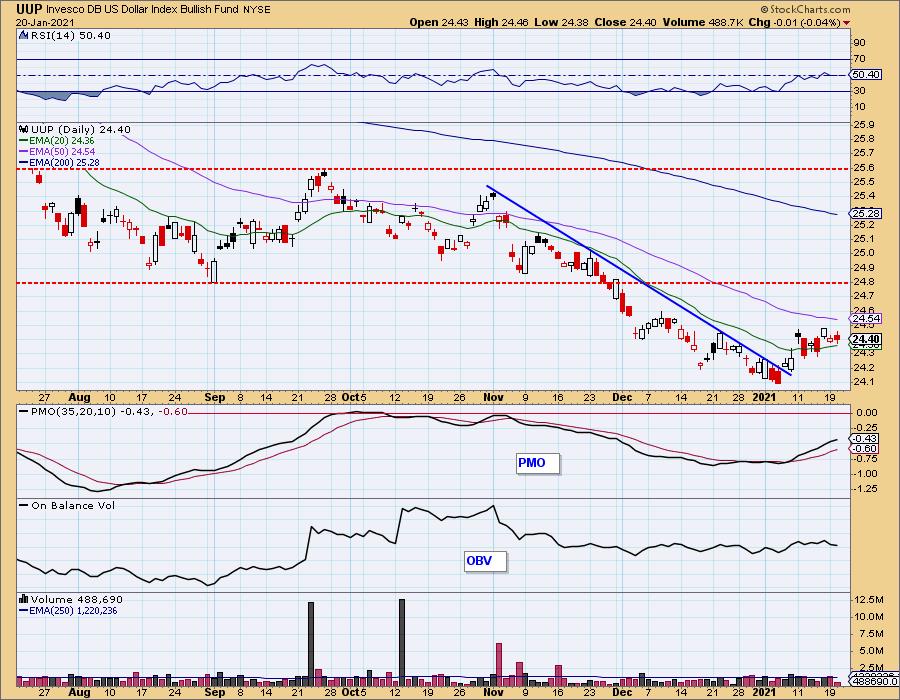
IT Trend Model: NEUTRAL as of 5/28/2020
LT Trend Model: SELL as of 7/10/2020
UUP Daily Chart: UUP is consolidating after breaking out of the declining trend. It's holding the 20-EMA which is bullish. The RSI is now positive and the PMO is rising. The 50-EMA will be the next struggle.
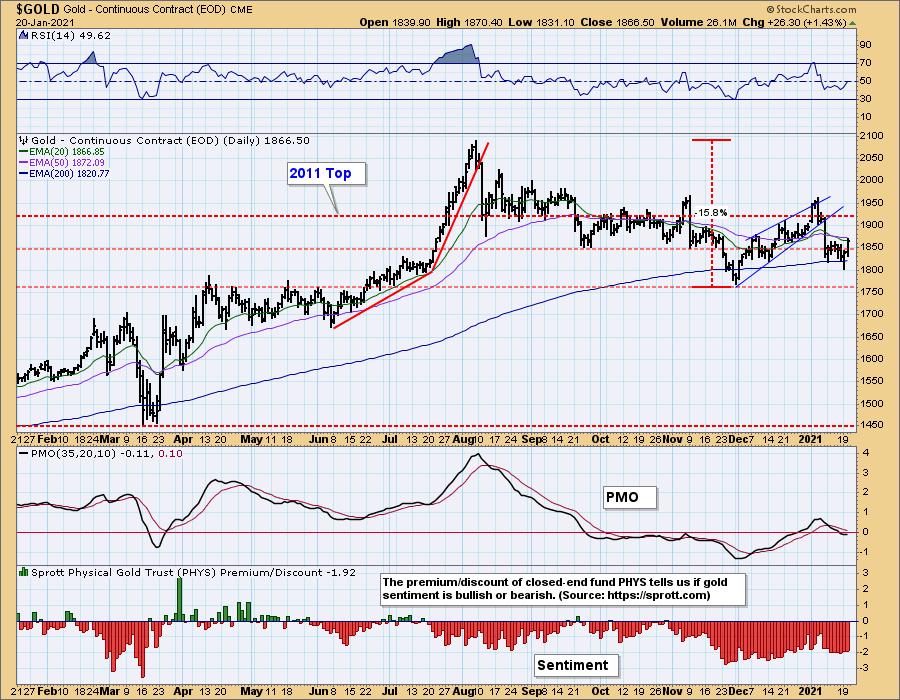
GOLD
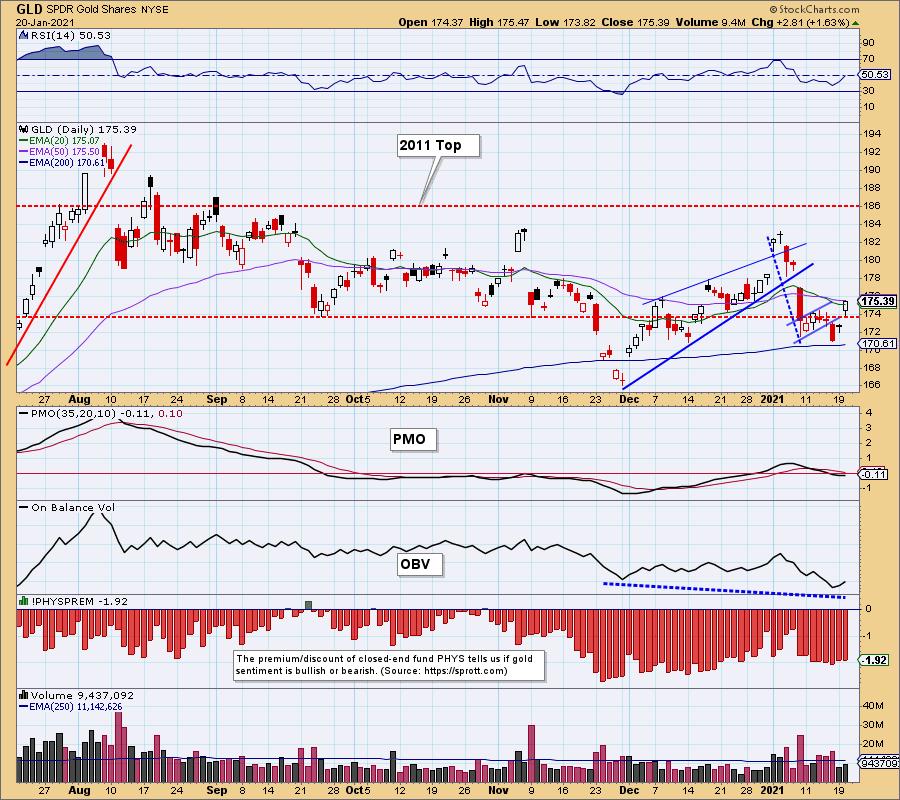
IT Trend Model: NEUTRAL as of 1/14/2021
LT Trend Model: BUY as of 1/8/2019
GLD Daily Chart: Huge rally on Gold today. It has changed the tenor of the chart. The RSI is now in positive territory and the PMO has slowed, ready to possibly turn back up. Discounts remain high which is bullish. The OBV is now sporting a reverse divergence with price bottoms. Despite a decrease in volume trends, price bottoms are rising. It was now or never for Gold which had just tested the 200-EMA. The 50-EMA could pose a problem, but the indicators sure look good right now.
Full disclosure: I own GLD.
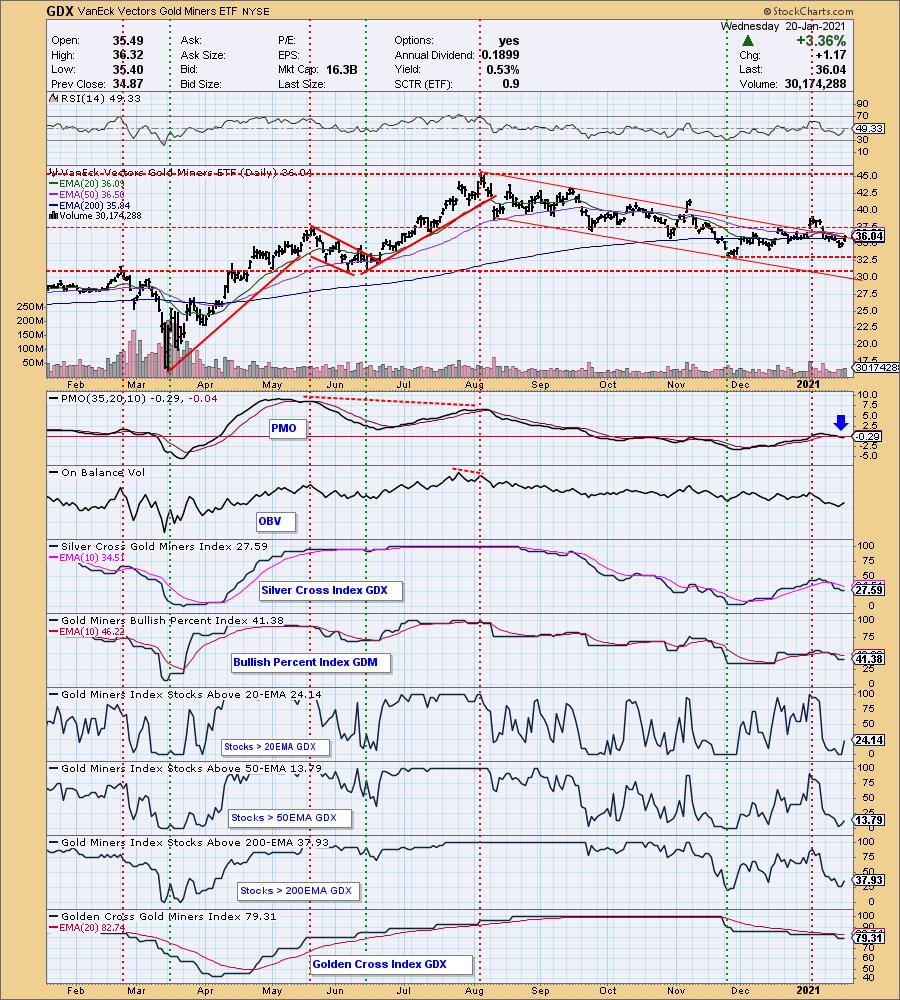
GOLD MINERS Golden and Silver Cross Indexes: With Gold getting a new lease on life, Gold Miners could awaken once again. Indicators are rising out of oversold territory and the PMO is attempting to turn around. The 50-EMA and the original declining trendline are the next test for GDX.
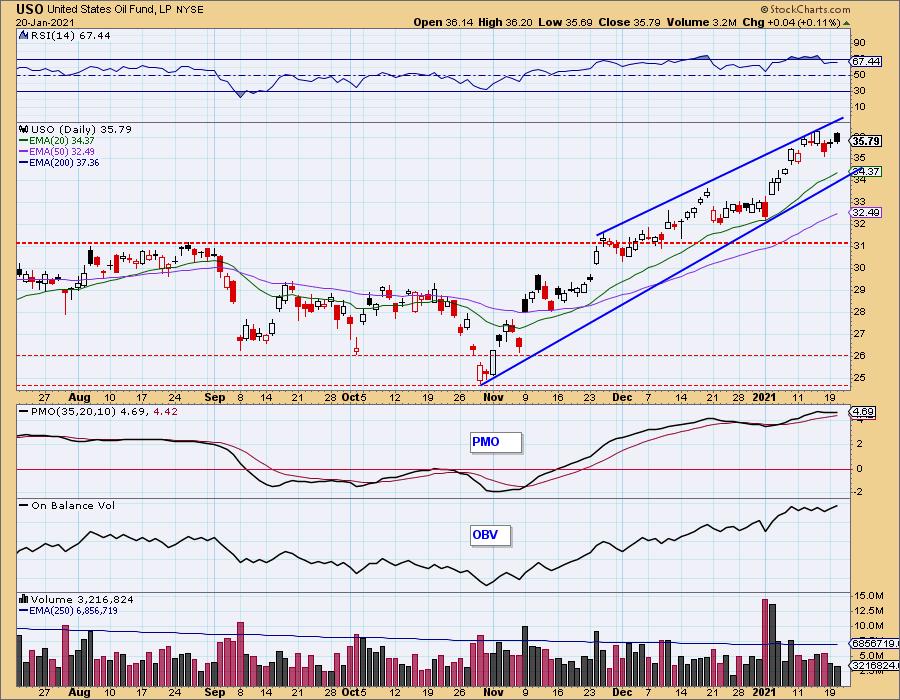
CRUDE OIL (USO)
IT Trend Model: BUY as of 10/20/2020
LT Trend Model: SELL as of 2/3/2020
USO Daily Chart: The rising trend continues for USO, but we do have a bearish rising wedge. The PMO has flattened on Monday's pullback. The RSI is now out of overbought territory and could support higher prices. The wedge bothers me. There is a strong possibility that price will need to test the 20-EMA and rising trend. Monday's pullback doesn't seem sufficient given how overbought the PMO is.
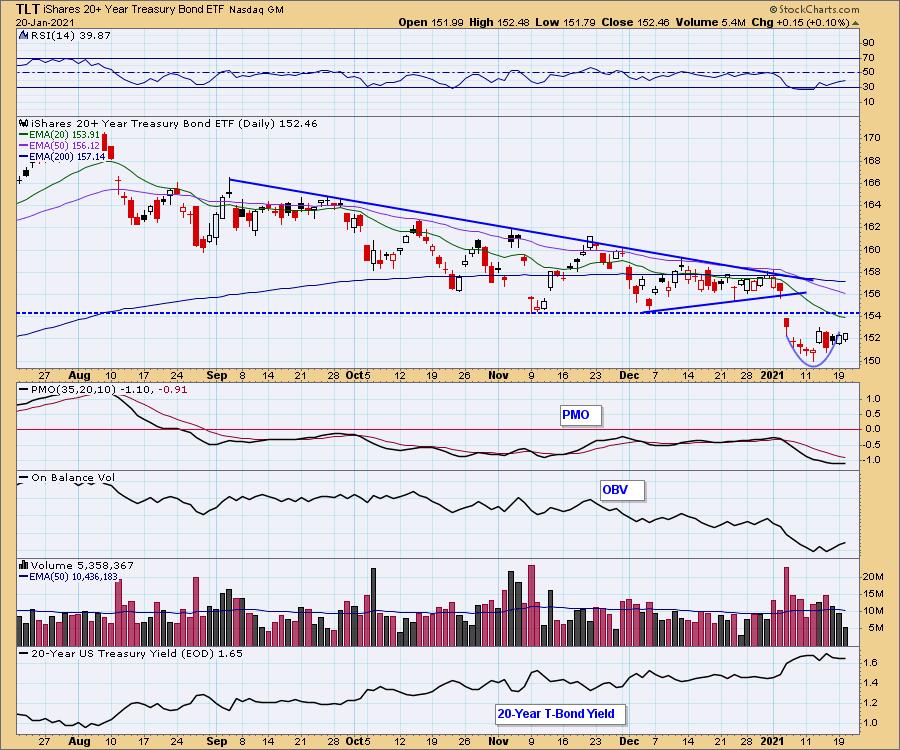
BONDS (TLT)
IT Trend Model: NEUTRAL as of 8/27/2020
LT Trend Model: SELL as of 1/8/2021
TLT Daily Chart: Yesterday's comments still apply:
"TLT has formed a bullish cup and seems to be now giving us a bit of a handle. The RSI is rising and the PMO appears ready to turn back up. I'm not particularly bullish as I would've preferred it to keep the short-term rising trend intact. Yields have topped, but have not actually broken down. For now I am optimistic."
Full Disclosure: I own TLT.
Technical Analysis is a windsock, not a crystal ball.
Happy Charting! - Erin
Disclaimer: This blog is for educational purposes only and should not be construed as financial advice. The ideas and strategies should never be used without first assessing your own personal and financial situation, or without consulting a financial professional. Any opinions expressed herein are solely those of the author, and do not in any way represent the views or opinions of any other person or entity.
NOTE: The signal status reported herein is based upon mechanical trading model signals, specifically, the DecisionPoint Trend Model. They define the implied bias of the price index based upon moving average relationships, but they do not necessarily call for a specific action. They are information flags that should prompt chart review. Further, they do not call for continuous buying or selling during the life of the signal. For example, a BUY signal will probably (but not necessarily) return the best results if action is taken soon after the signal is generated. Additional opportunities for buying may be found as price zigzags higher, but the trader must look for optimum entry points. Conversely, exit points to preserve gains (or minimize losses) may be evident before the model mechanically closes the signal.
Helpful DecisionPoint Links:
DecisionPoint Alert Chart List
DecisionPoint Golden Cross/Silver Cross Index Chart List
DecisionPoint Sector Chart List
Price Momentum Oscillator (PMO)
Swenlin Trading Oscillators (STO-B and STO-V)
DecisionPoint is not a registered investment advisor. Investment and trading decisions are solely your responsibility. DecisionPoint newsletters, blogs or website materials should NOT be interpreted as a recommendation or solicitation to buy or sell any security or to take any specific action.