
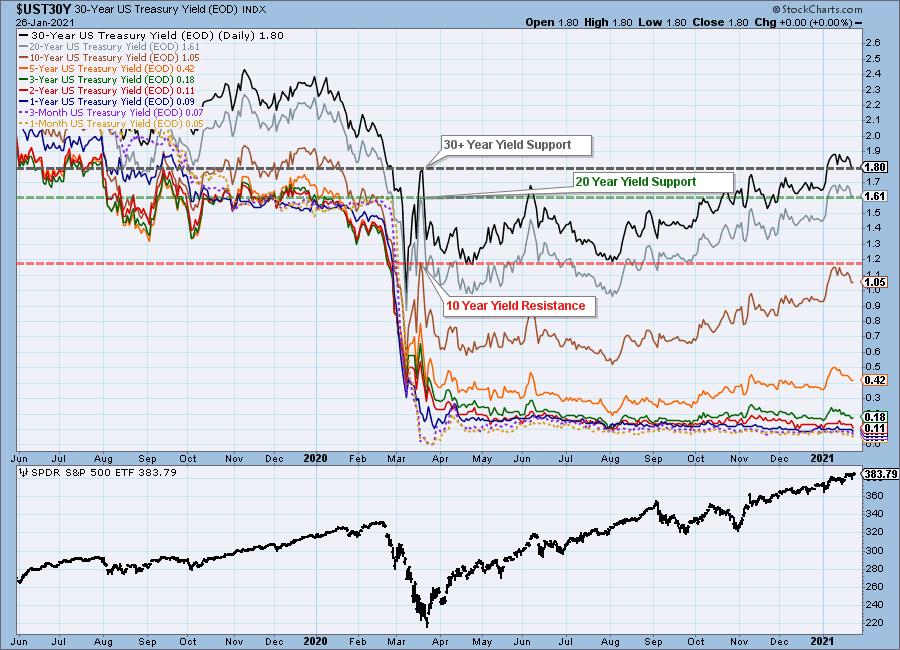
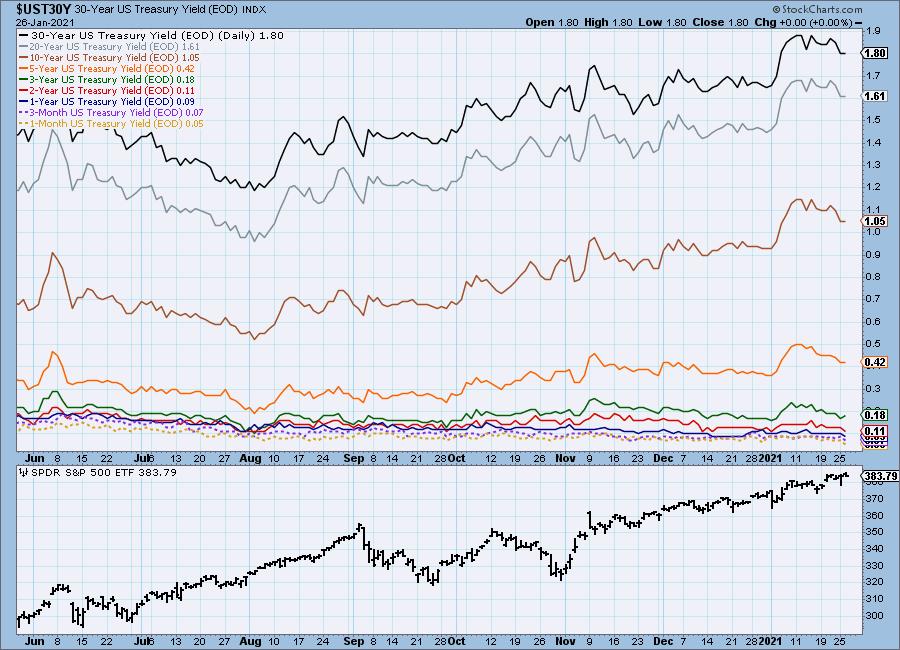
Although it is in every DP Alert report, we don't usually comment on the Yield chart. However, today we saw a new PMO BUY signal on TLT and I thought a short discussion was worthwhile. Put simply, when yields fall, Bonds rise. Since the beginning of August, we have basically been in a "rising rate" environment which has put long-term Bonds on a decline. Currently 20-year and 30+ year yields are hitting support after breaking out. Should this support level hold, the short-term rally in Bonds will likely disintegrate. However, the 10-year yield hit overhead resistance and is turning down. This suggests to me that longer-term yields could lose that support.
The DecisionPoint Alert Weekly Wrap presents an end-of-week assessment of the trend and condition of the Stock Market, the U.S. Dollar, Gold, Crude Oil, and Bonds. The DecisionPoint Alert daily report (Monday through Thursday) is abbreviated and gives updates on the Weekly Wrap assessments.
Watch the latest episode of DecisionPoint on StockCharts TV's YouTube channel here!
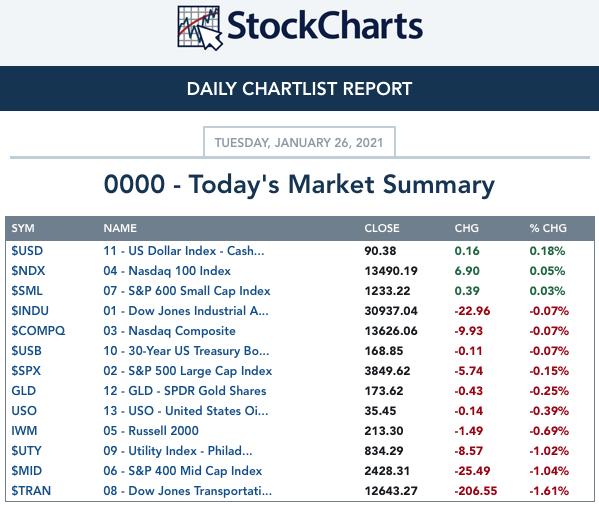
MAJOR MARKET INDEXES
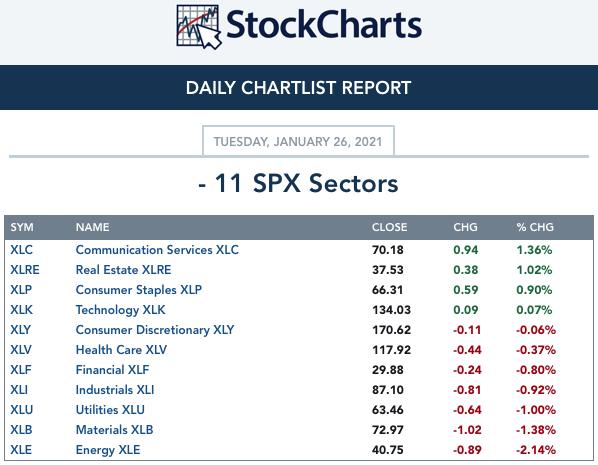
SECTORS
Each S&P 500 Index component stock is assigned to one, and only one, of 11 major sectors. This is a snapshot of the Intermediate-Term (Silver Cross) and Long-Term (Golden Cross) Trend Model signal status for those sectors.
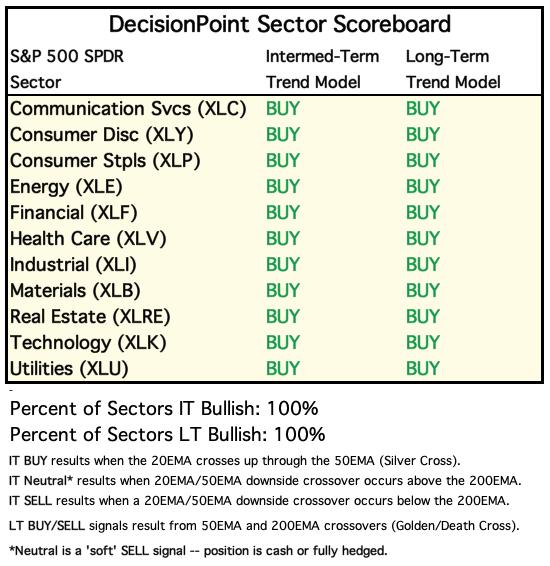
CLICK HERE for Carl's annotated Sector charts.
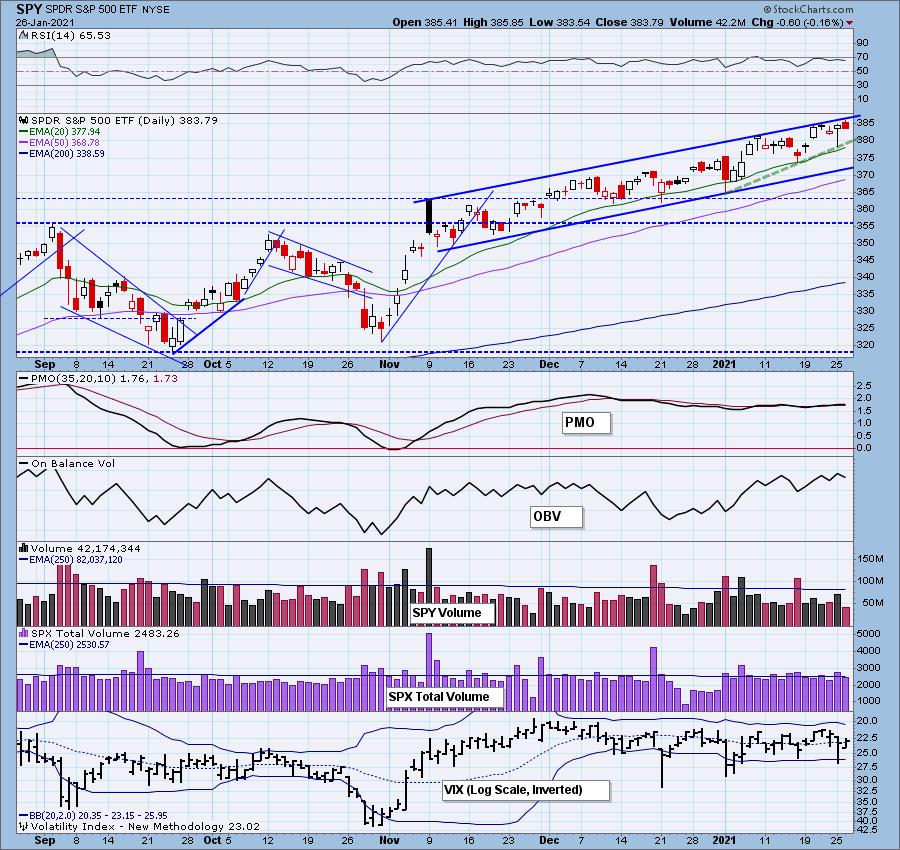
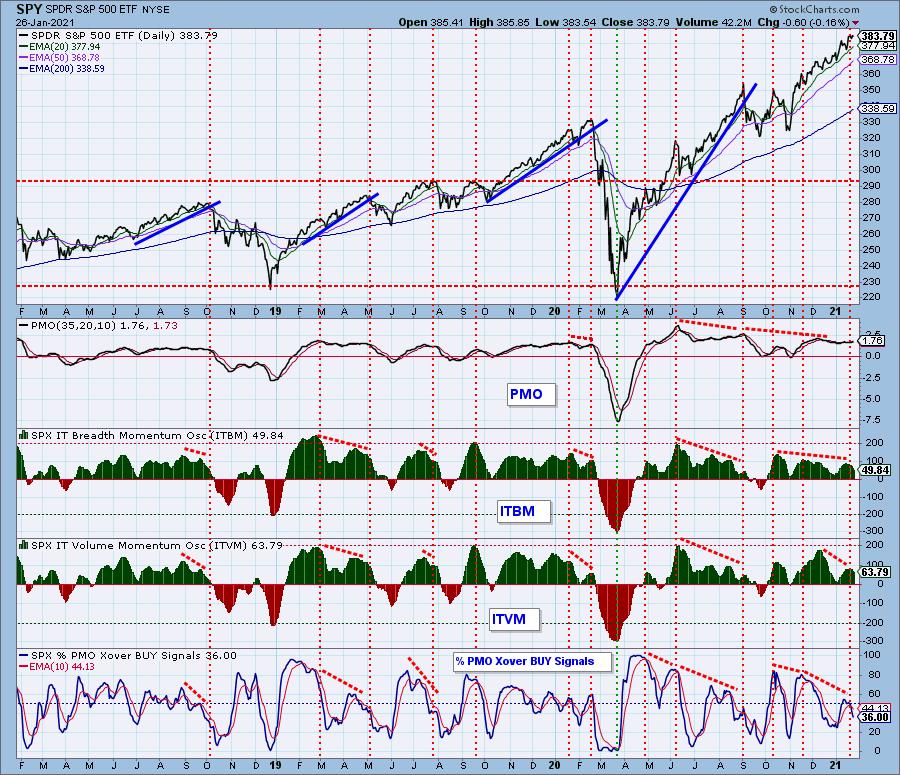
THE MARKET (S&P 500)
IT Trend Model: BUY as of 5/8/2020
LT Trend Model: BUY as of 6/8/2020
SPY Daily Chart: The market may've closed down today, but it set a much higher intraday low than yesterday. That puts a bullish bias on today's decline. The PMO is hanging onto its crossover BUY signal. In the short-term, using the green dotted rising bottoms trendline, there is a bearish rising wedge that implies a breakdown below the 20-EMA. Of course the intermediate-term rising trend channel would remain intact unless we break down to the 50-EMA. I believe that is entirely possible, but we need to see some tarnish on the current bullish bias.

It's Free!
 Mark Young, CMT of WallStreetSentiment.com will be joining me in the free trading room on February 1st! He has all the latest sentiment data and will give his opinion on your symbol requests too!
"Investor sentiment is one of the most powerful forces in the stock market. It can make the difference between selling out at a market low and buying there." -- Mark Young, CMT
***Click here to register for this recurring free DecisionPoint Trading Room on Mondays at Noon ET!***
Did you miss the 1/25 trading room? Here is a recording link to the recording -- access code: y&aLh1Xr
For best results, copy and paste the access code to avoid typos.
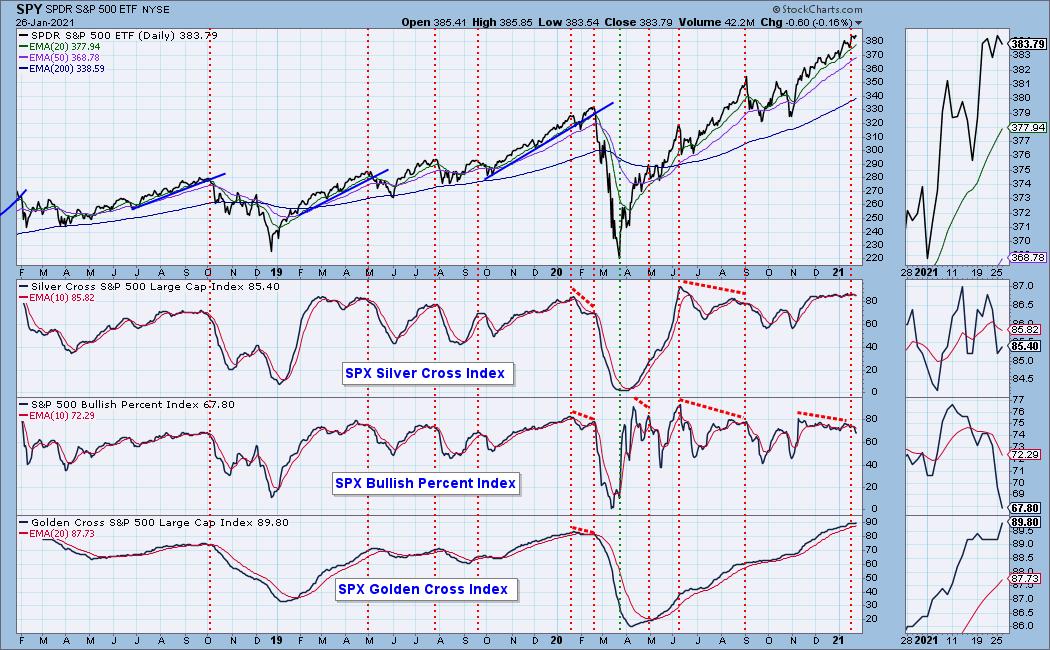
Participation: The following chart uses different methodologies for objectively showing the depth and trend of participation for intermediate- and long-term time frames.
- The Silver Cross Index (SCI) shows the percentage of SPX stocks on IT Trend Model BUY signals (20-EMA > 50-EMA).
- The Golden Cross Index (GCI) shows the percentage of SPX stocks on LT Trend Model BUY signals (50-EMA > 200-EMA).
- The Bullish Percent Index (BPI) shows the percentage of SPX stocks on Point & Figure BUY signals.
The BPI continues to accelerate lower in a clear negative divergence with price in the thumbnail. The SCI is mostly flat. This week we are seeing an increase on the GCI reading, moving it further into overbought extremes. The good news is that it is not in a negative divergence with price right now.
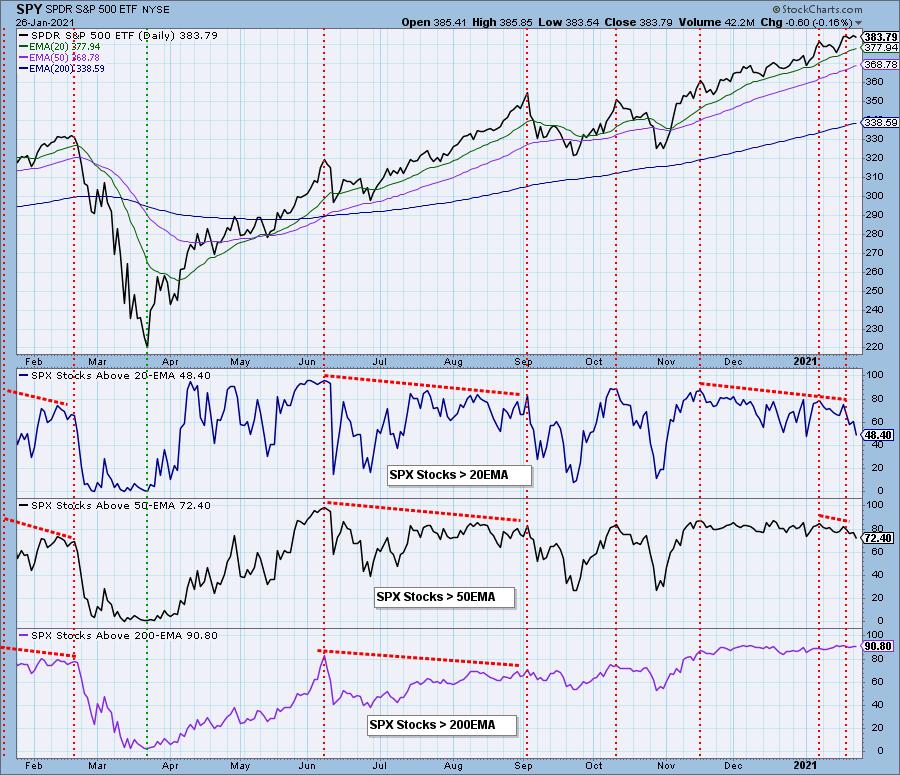
Participation is quickly diminishing with less than half of the SPX stocks having price above their 20-EMAs.
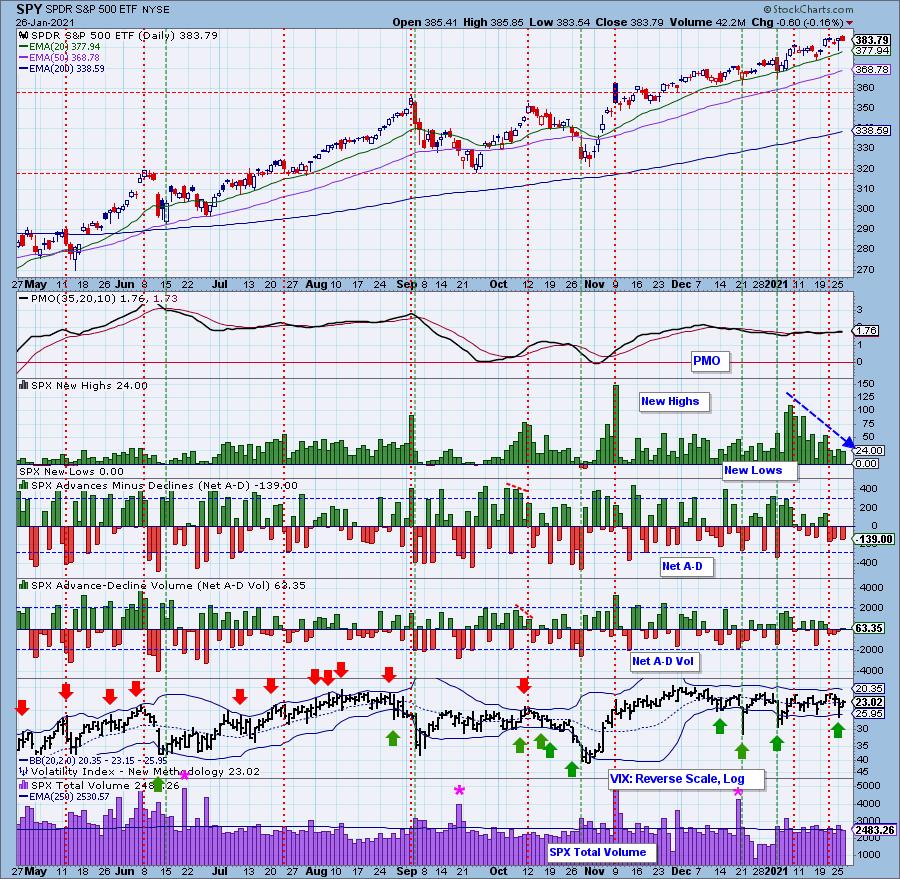
Climactic Market Indicators: Not a climax day. The VIX didn't do anything and is on its EMA, so it isn't hinting at anything right now. New Highs continue the declining trend. Total volume was average.
Short-Term Market Indicators: The short-term market trend is UP and the condition is NEAR-TERM OVERSOLD.
Well that was fast. We had the STOs rising yesterday, but they have quickly resumed their declines. We are in near-term oversold territory, but there is plenty of downside left when measured against the late October bottom. Less than one-third of the SPX stocks have rising momentum. That will not support a rally continuation for long.
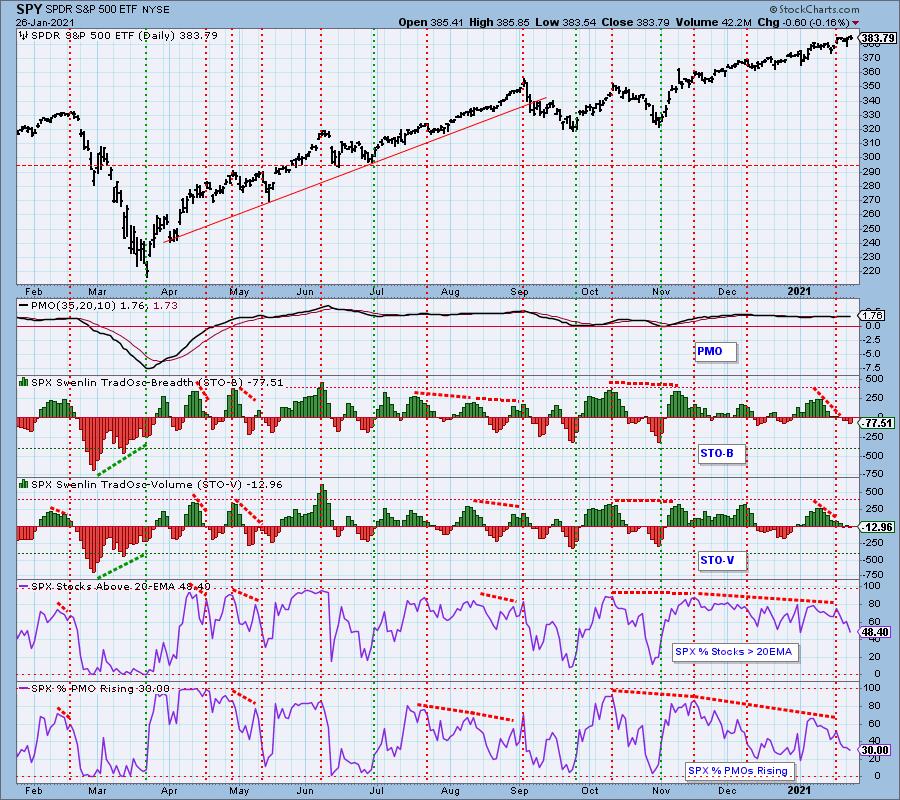
Intermediate-Term Market Indicators: The intermediate-term market trend is UP and the condition is SOMEWHAT OVERBOUGHT. The intermediate-term market bias is BULLISH.
Negative divergences persist as these indicators all continue to decline.
CONCLUSION: Given the STOs turning down and the numerous negative divergences accompanied by diminishing participation, I would expect a near-term decline that will test the bottom of the rising trend channel. Bulls will likely keep the rising trend alive, but it is time for a test of that IT rising bottoms trendline. That would mean a drop below the 20-EMA. Keep stops tight and keep your head down.
Have you subscribed the DecisionPoint Diamonds yet? DP does the work for you by providing handpicked stocks/ETFs from exclusive DP scans! Add it with a discount! Contact support@decisionpoint.com for more information!
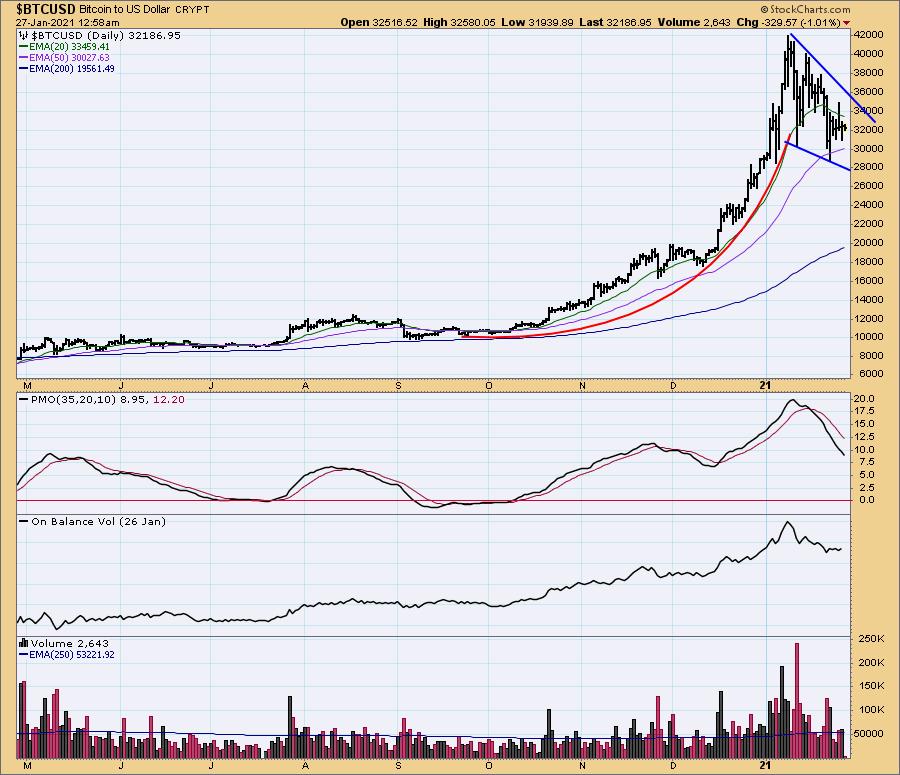
BITCOIN
There is a large bullish falling wedge which would suggest an upside breakout, but the PMO tells us it will likely take more time to turn it around.
INTEREST RATES
This chart is included so we can monitor rate inversions. In normal circumstances the longer money is borrowed the higher the interest rate that must be paid. When rates are inverted, the reverse is true.
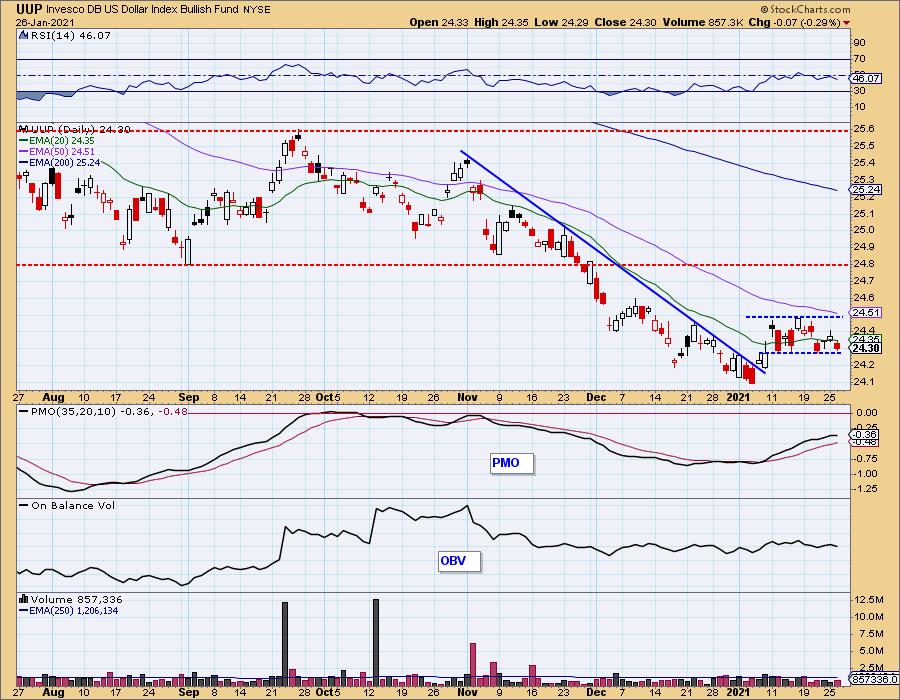
DOLLAR (UUP)
IT Trend Model: NEUTRAL as of 5/28/2020
LT Trend Model: SELL as of 7/10/2020
UUP Daily Chart: Just when the indicators started improving, UUP dropped again. Currently it is hugging the bottom of a trading channel, but the fact that we didn't see a test of the top of that trading range suggests a breakdown not a breakout.
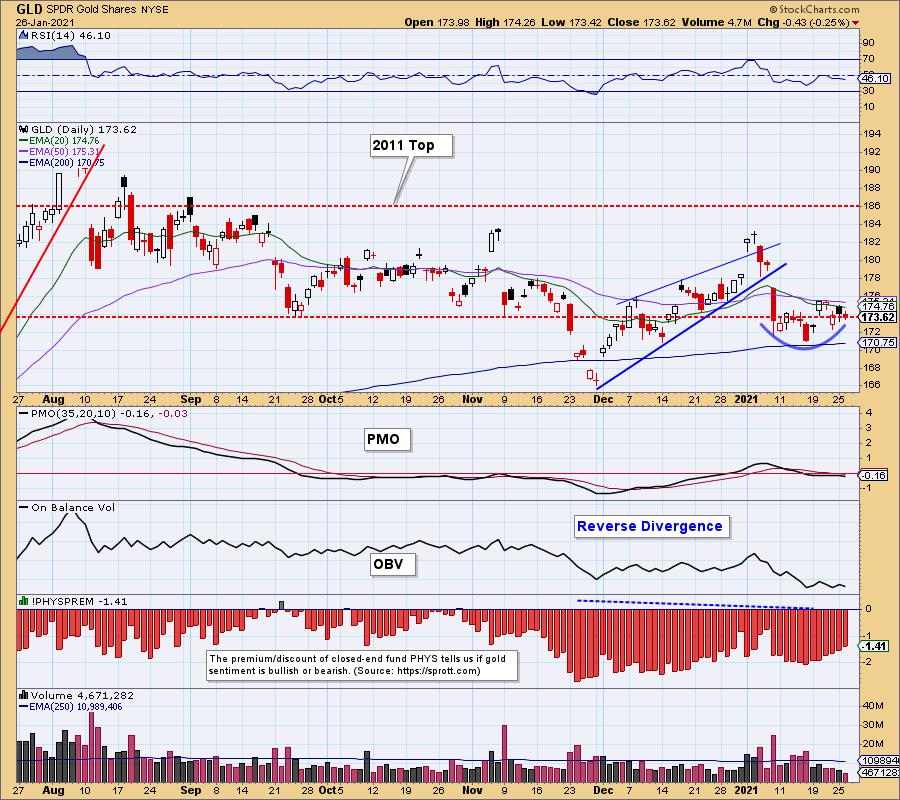
GOLD
IT Trend Model: NEUTRAL as of 1/14/2021
LT Trend Model: BUY as of 1/8/2019
GLD Daily Chart: Yesterday's comments still apply:
"Gold is being obstinate as usual. GLD is bounded by the 20/50-EMAs on top and the 200-EMA on the bottom. The PMO is flat and the RSI is negative. I have annotated a cup-like structure that is bullish. Discounts are paring back somewhat which tells us participants are slightly less bearish than previously, but overall this messy price action isn't particularly helpful."
Full disclosure: I own GLD.
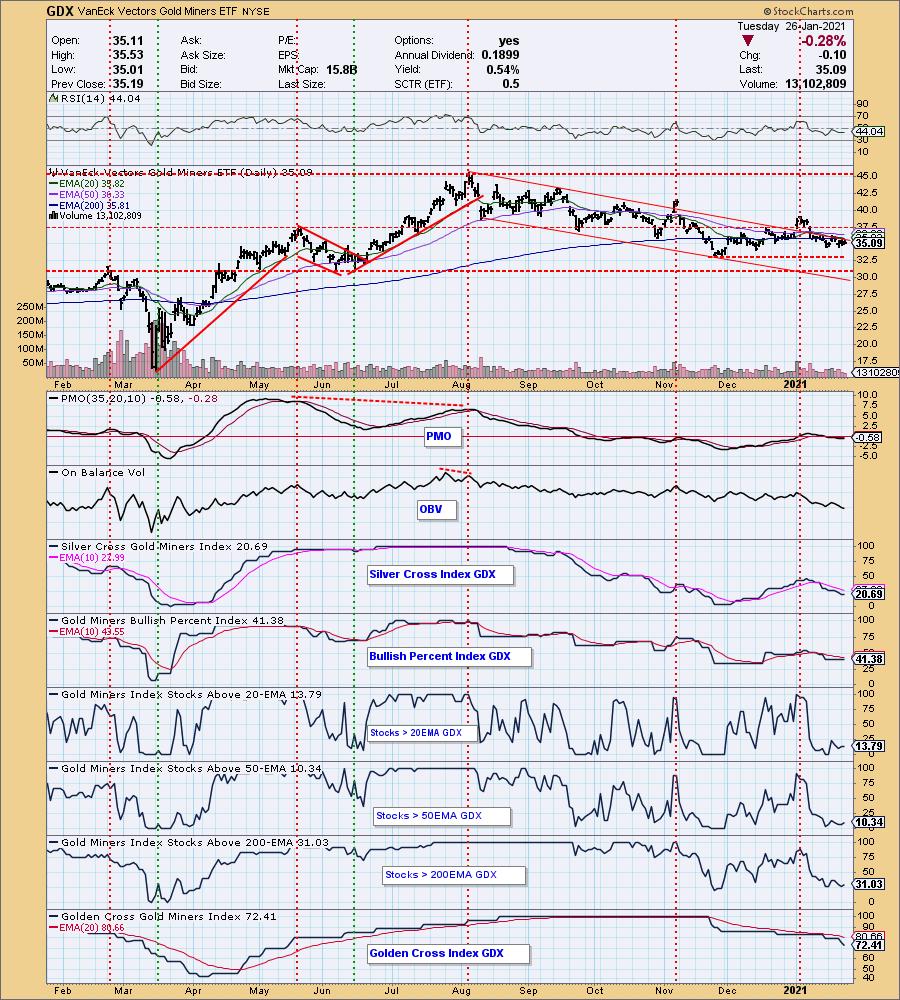
GOLD MINERS Golden and Silver Cross Indexes: Miners just aren't that interesting right now. They are completely stuck up against the EMAs and the declining trend. Indicators are oversold, but I don't like the damage on the GCI and its failure to turn it around. The other indicators are oversold, but given the declining SCI and GCI, I am not expecting a big breakout here yet.
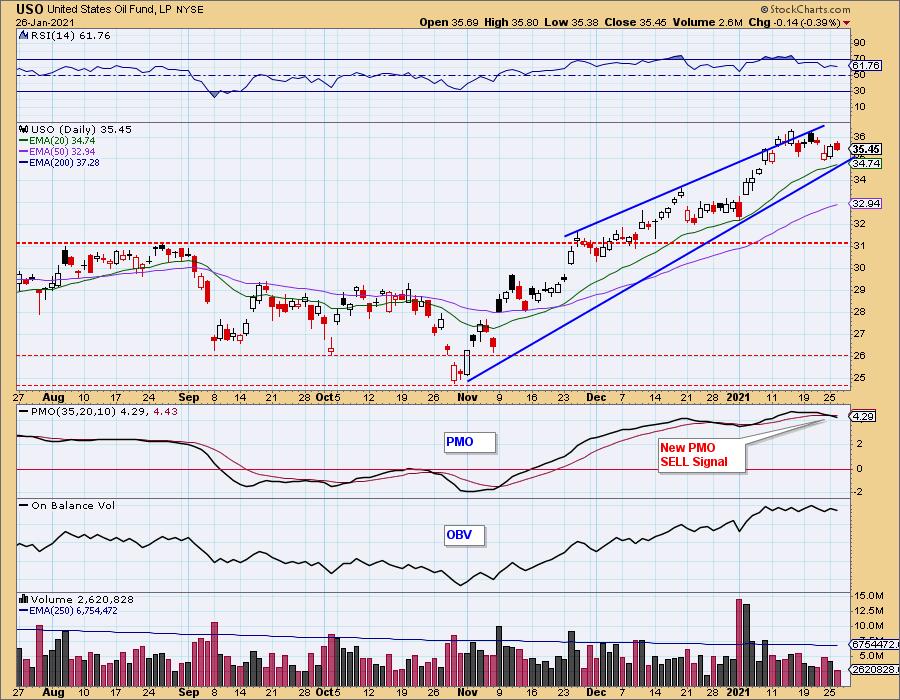
CRUDE OIL (USO)
IT Trend Model: BUY as of 10/20/2020
LT Trend Model: SELL as of 2/3/2020
USO Daily Chart: USO had a PMO crossover SELL signal yesterday, along with $WTIC. It was an orderly pullback that hasn't damaged the rising trend and the RSI is still positive. However, we do have a bearish rising wedge, so the expectation is an eventual breakdown.
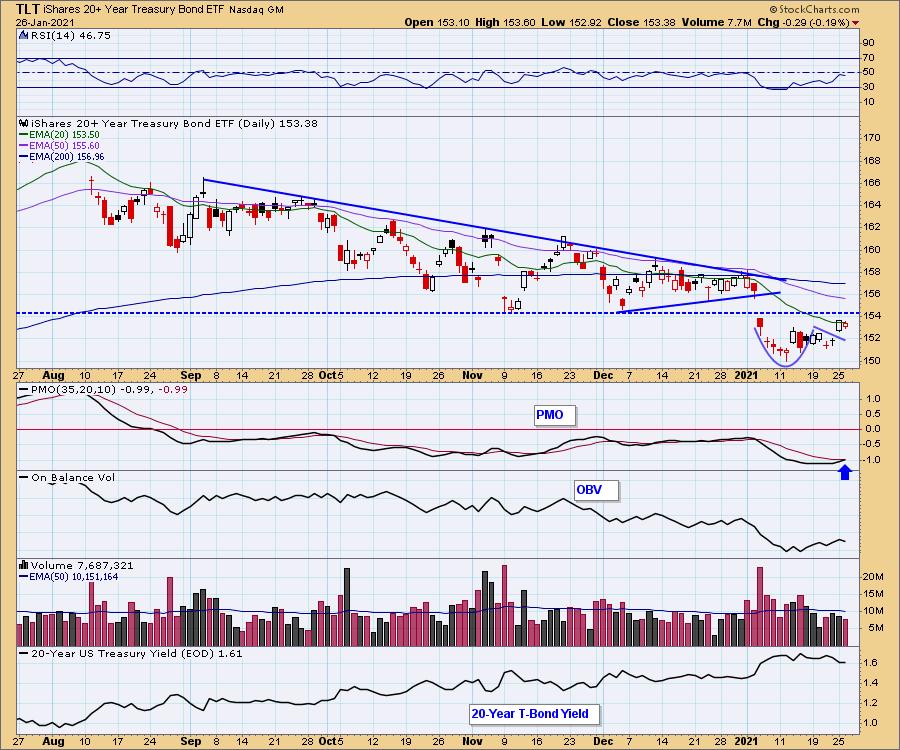
BONDS (TLT)
IT Trend Model: NEUTRAL as of 8/27/2020
LT Trend Model: SELL as of 1/8/2021
TLT Daily Chart: You can see the new PMO crossover BUY signal that was generated today on TLT. I've been watching a cup and handle pattern materialize with yesterday seeing the expected breakout. Not much happened today with price. We could have a reverse island for the whole formation, or, we have a short-term reverse island setting up with yesterday and today's candlesticks. As I wrote in the intro, yields do appear ready to break down. So the likely resolution is a closure of the early January gap. That would require a rally above the 50-EMA.
Full Disclosure: I own TLT.
Technical Analysis is a windsock, not a crystal ball.
Happy Charting! - Erin
Disclaimer: This blog is for educational purposes only and should not be construed as financial advice. The ideas and strategies should never be used without first assessing your own personal and financial situation, or without consulting a financial professional. Any opinions expressed herein are solely those of the author, and do not in any way represent the views or opinions of any other person or entity.
NOTE: The signal status reported herein is based upon mechanical trading model signals, specifically, the DecisionPoint Trend Model. They define the implied bias of the price index based upon moving average relationships, but they do not necessarily call for a specific action. They are information flags that should prompt chart review. Further, they do not call for continuous buying or selling during the life of the signal. For example, a BUY signal will probably (but not necessarily) return the best results if action is taken soon after the signal is generated. Additional opportunities for buying may be found as price zigzags higher, but the trader must look for optimum entry points. Conversely, exit points to preserve gains (or minimize losses) may be evident before the model mechanically closes the signal.
Helpful DecisionPoint Links:
DecisionPoint Alert Chart List
DecisionPoint Golden Cross/Silver Cross Index Chart List
DecisionPoint Sector Chart List
Price Momentum Oscillator (PMO)
Swenlin Trading Oscillators (STO-B and STO-V)
DecisionPoint is not a registered investment advisor. Investment and trading decisions are solely your responsibility. DecisionPoint newsletters, blogs, trading rooms or website materials should NOT be interpreted as a recommendation or solicitation to buy or sell any security or to take any specific action.