
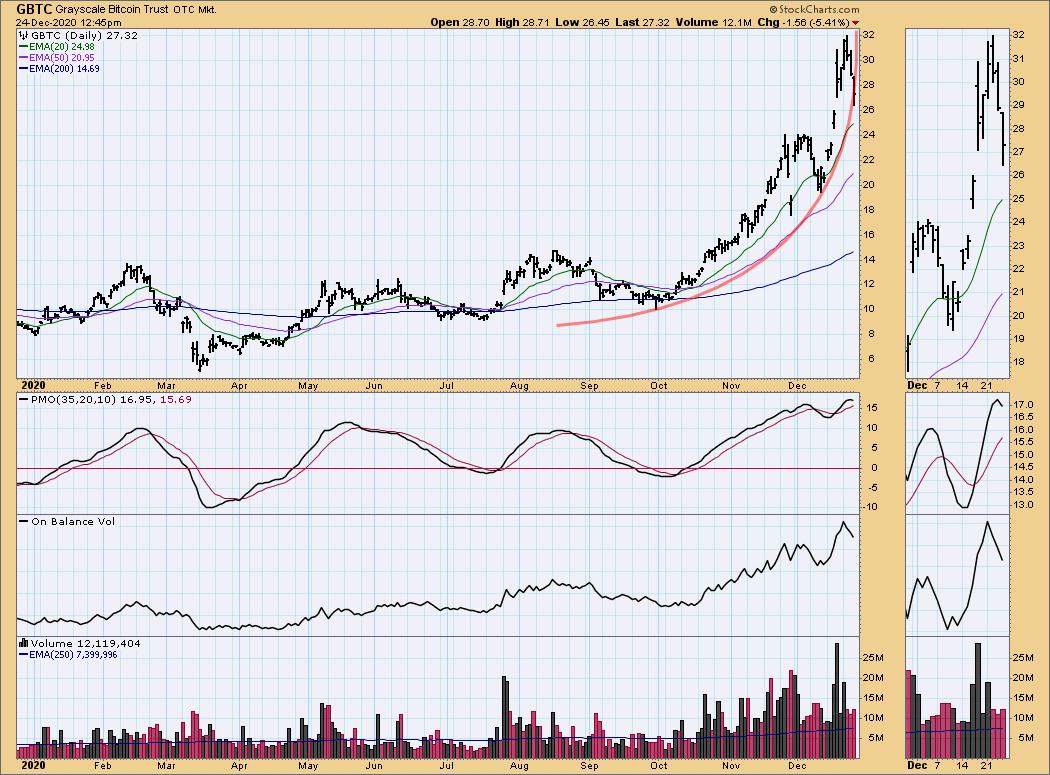
It was, as expected, a quiet week for the market, and we will probably see more of the same next week. We have always been of the opinion that they should close the market for two weeks for the holidays, but where's the fun in that? Of course, we could be surprised by market-moving news, or just plain irrational volatility. For example, recent interest in Bitcoin has caused a parabolic advance (and breakdown) on the Grayscale Bitcoin Trust ETF chart, which maybe should be called the "Seinfeld Trust" -- a show about absolutely nothing. Whatever. Keep in mind that parabolic events in the short-term time frame will most likely be over quickly.
The DecisionPoint Alert Weekly Wrap presents an end-of-week assessment of the trend and condition of the Stock Market, the U.S. Dollar, Gold, Crude Oil, and Bonds. The DecisionPoint Alert daily report (Monday through Thursday) is abbreviated and gives daily updates on the Weekly Wrap assessments.
Watch the latest episode of DecisionPoint on StockCharts TV's YouTube channel here!
MAJOR MARKET INDEXES
For today: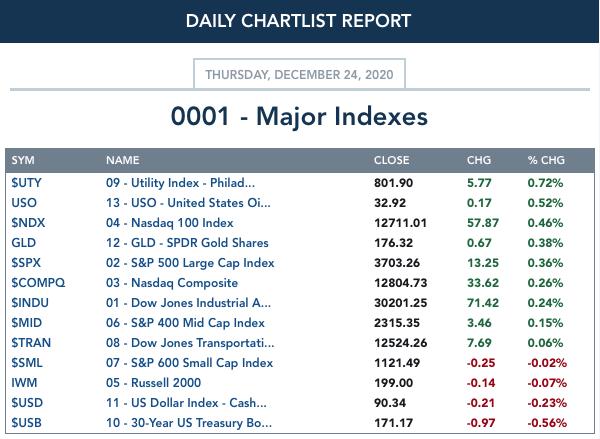
For the week: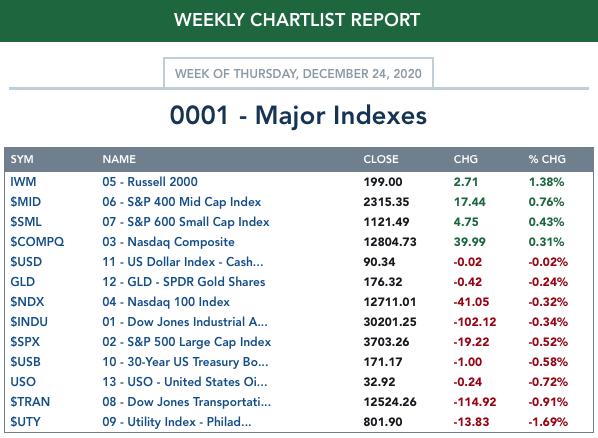
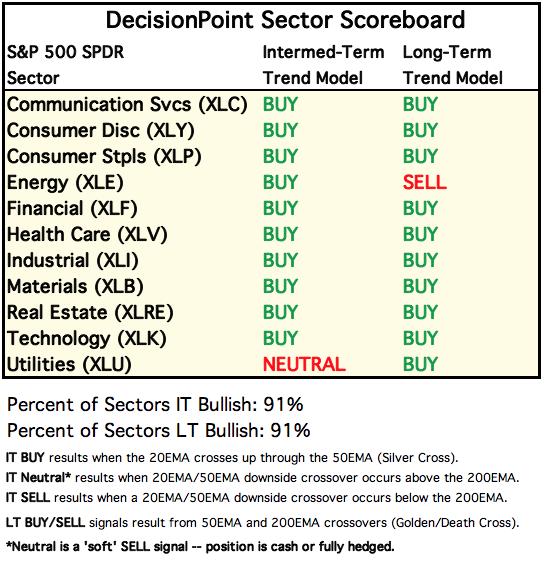
SECTORS
Each S&P 500 Index component stock is assigned to one, and only one, of 11 major sectors. This is a snapshot of the Intermediate-Term (Silver Cross) and Long-Term (Golden Cross) Trend Model signal status for those sectors.
For today: 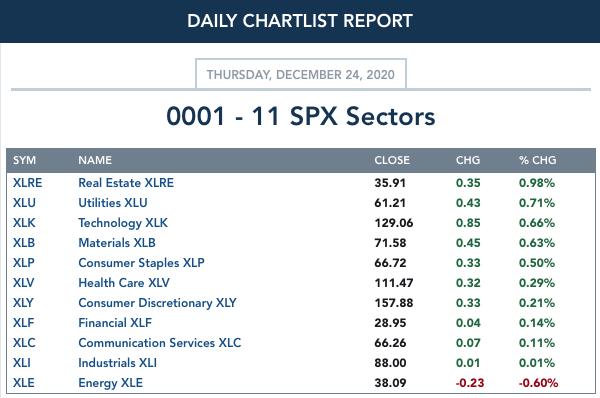
For the week: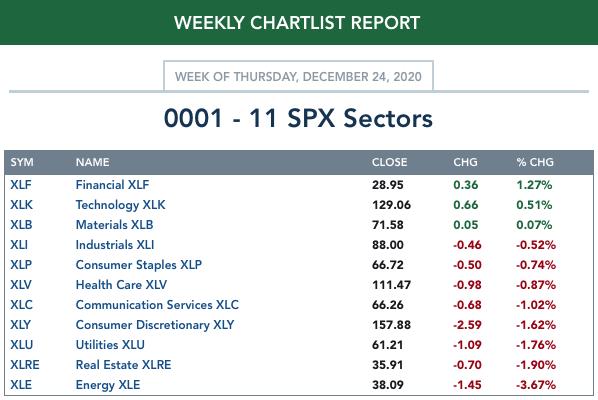
CLICK HERE for Carl's annotated Sector charts.
THE MARKET (S&P 500)
IT Trend Model: BUY as of 5/8/2020
LT Trend Model: BUY as of 6/8/2020
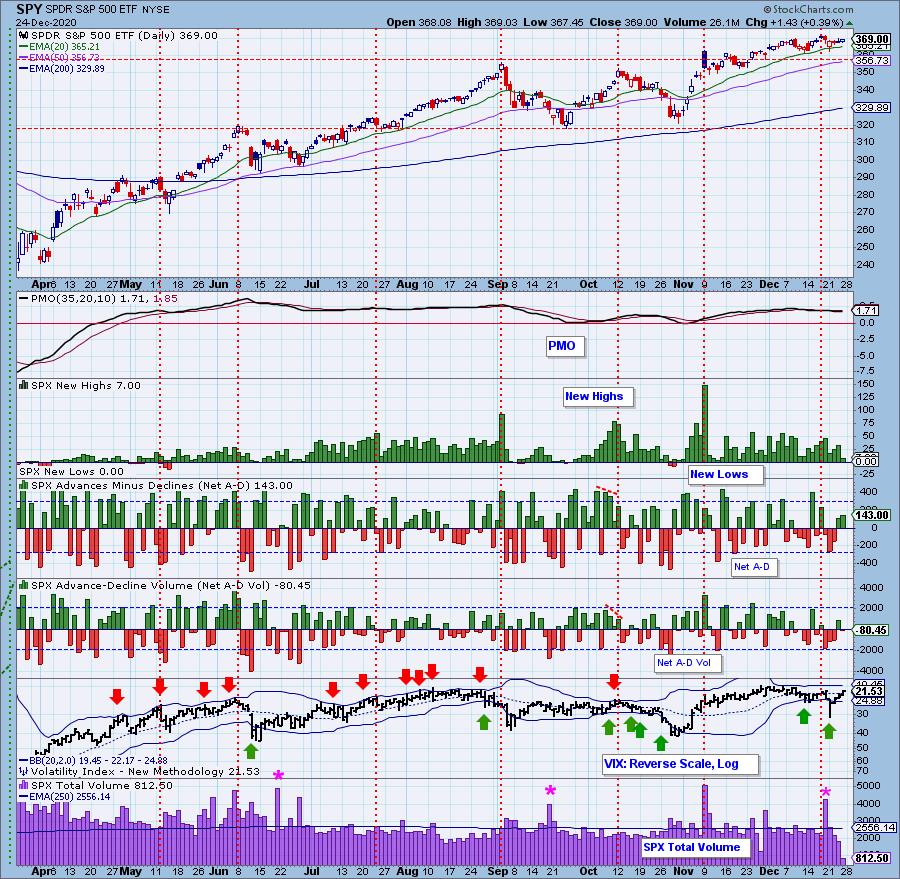
SPY Daily Chart: Monday was quite an exciting day, beginning with a strong decline, but finishing near the day's highs. Our suspicion is that this turbulence was caused by index/portfolio re-balancing necessitated by Tesla's entry into the S&P 500 Index. Some overspray from last Friday's options expiration could also have been in the mix. The rest of the week was quiet with lower than average volume.
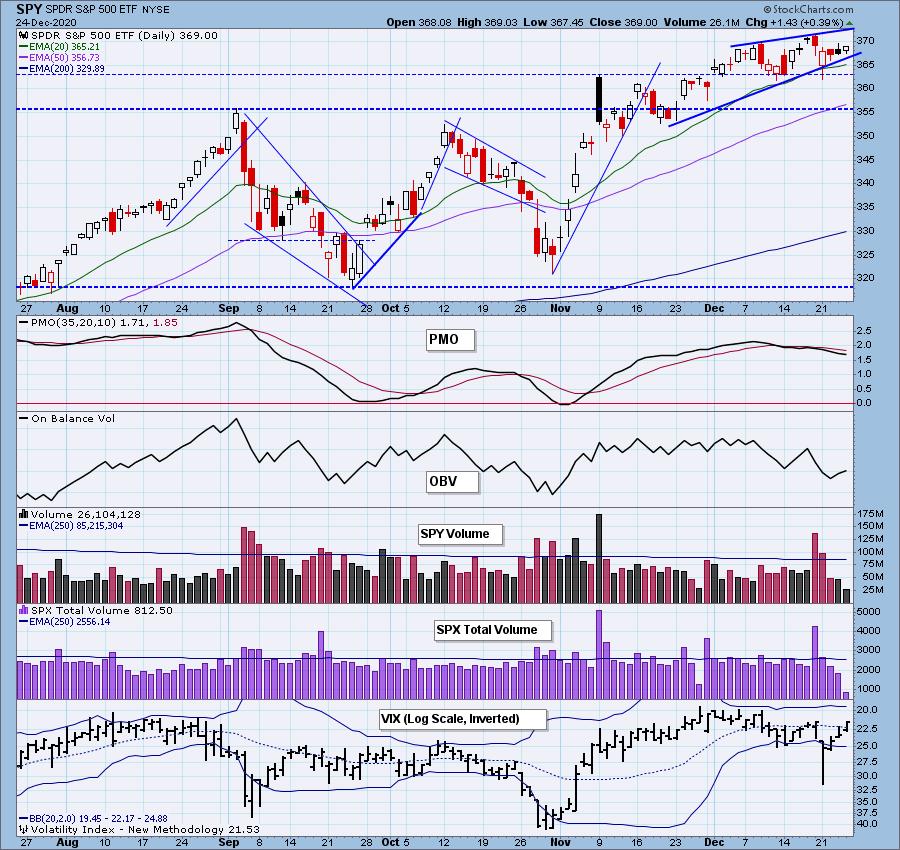
The VIX Bollinger Bands are in choke mode, typically a precursor of a price decline.
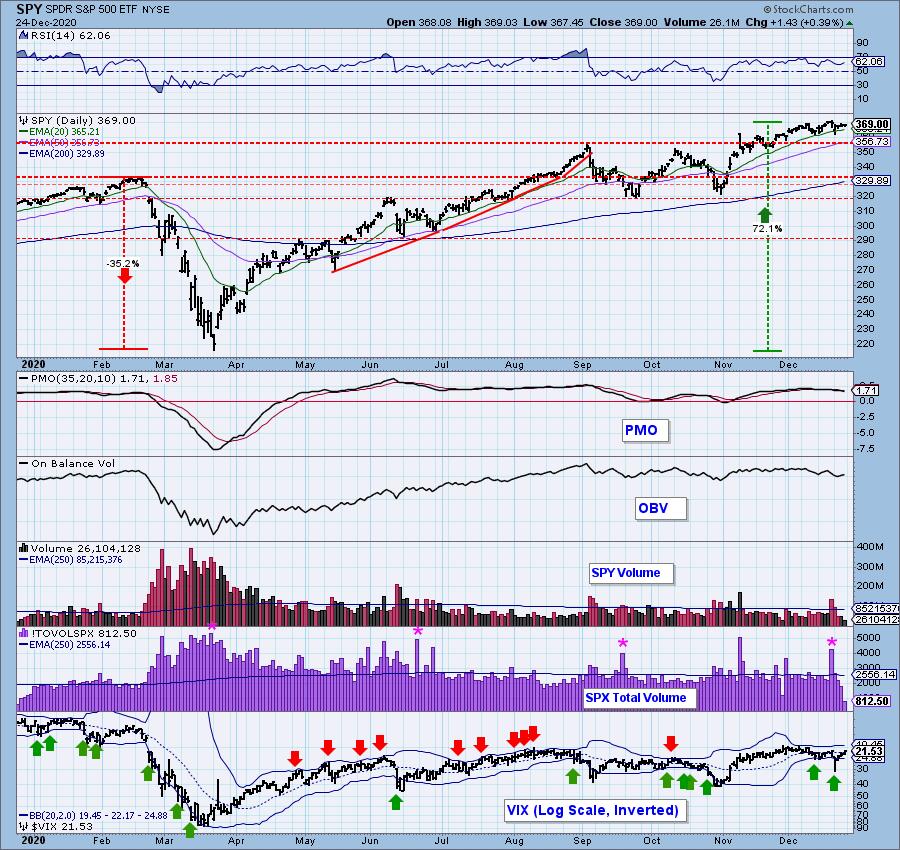

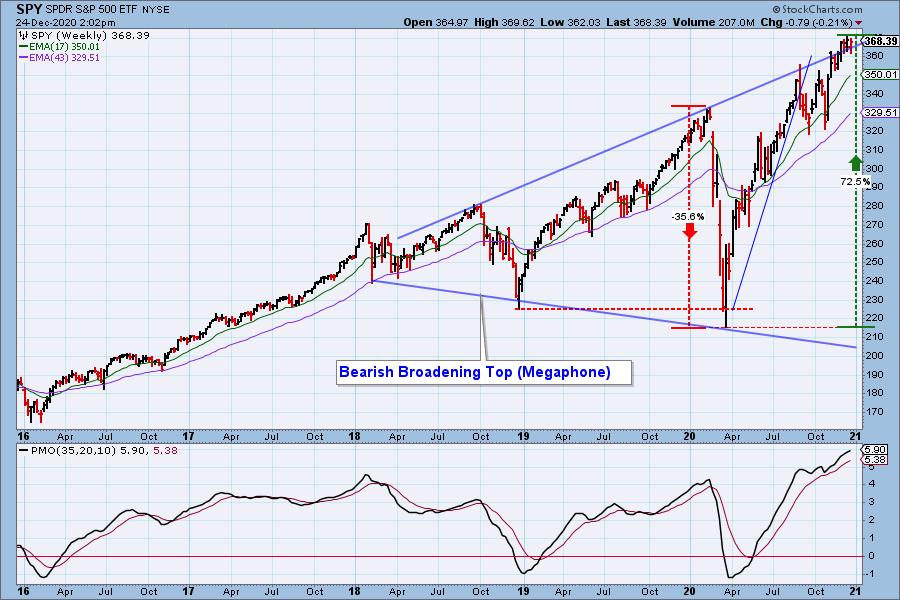
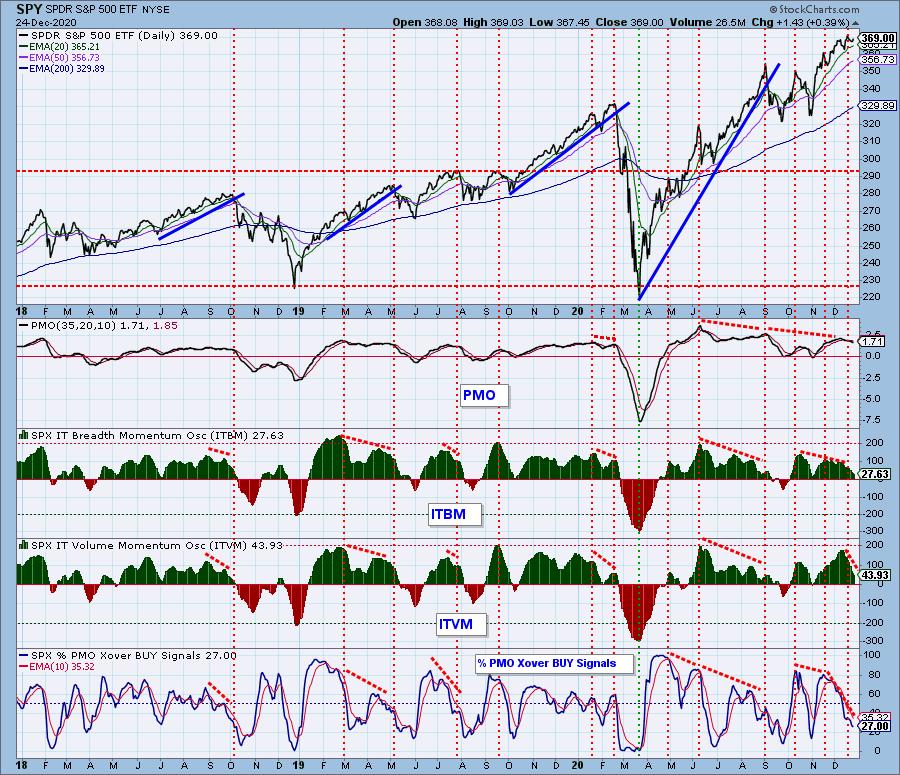
SPY Weekly Chart: The weekly PMO is extremely overbought.
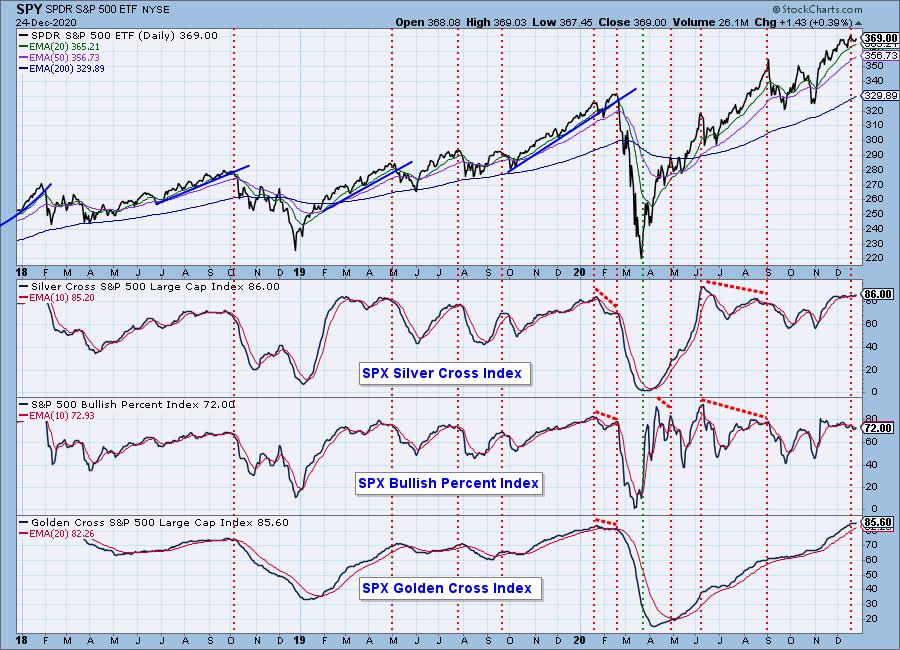
Participation: The following chart uses different methodologies for objectively showing the depth and trend of participation for intermediate- and long-term time frames.
- The Silver Cross Index (SCI) shows the percentage of SPX stocks on IT Trend Model BUY signals (20-EMA > 50-EMA).
- The Golden Cross Index (GCI) shows the percentage of SPX stocks on LT Trend Model BUY signals (50-EMA > 200-EMA).
- The Bullish Percent Index (BPI) shows the percentage of SPX stocks on Point & Figure BUY signals.
Both the SCI and GCI are overbought. The BPI is also overbought, but it is showing deterioration as price heads higher.
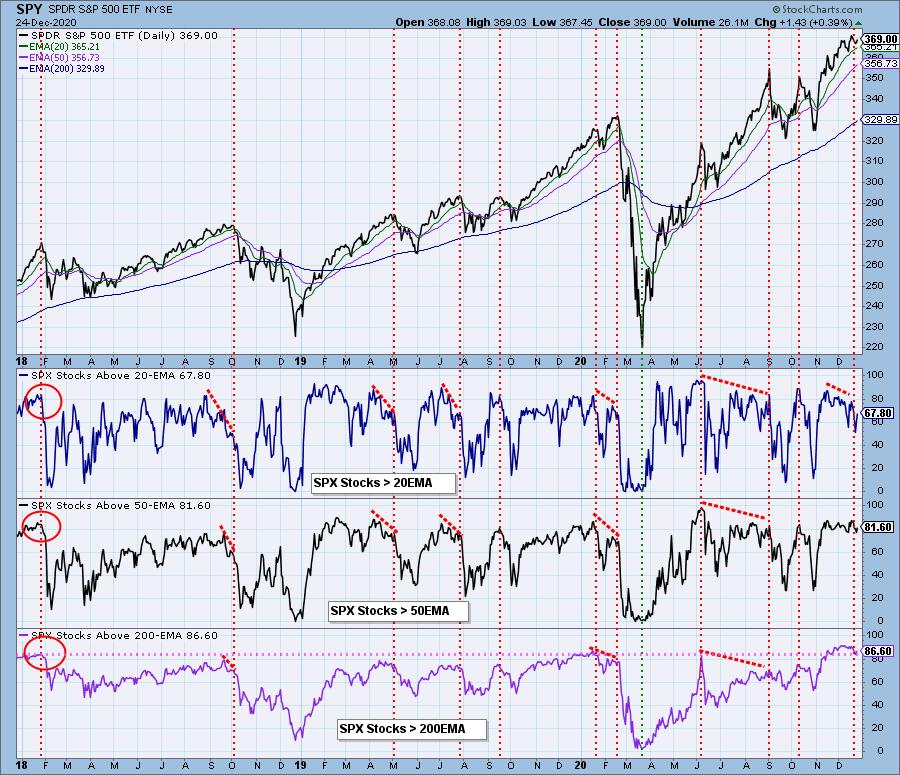
The Stocks Above 20/50/200EMA indicators show sharp negative divergence in the short term, and the longer-term is very overbought.
Climax Analysis: Monday was a climax day but we are beginning to wonder if it was an exhaustion or initiation event. There was little upside follow through in subsequent market action, which indicates the potential for more downside next week.
Short-Term Market Indicators: The short-term market trend is NEUTRAL and the condition is OVERSOLD in relation to the recent narrow range STO range. Negative divergences are numerous and severe.
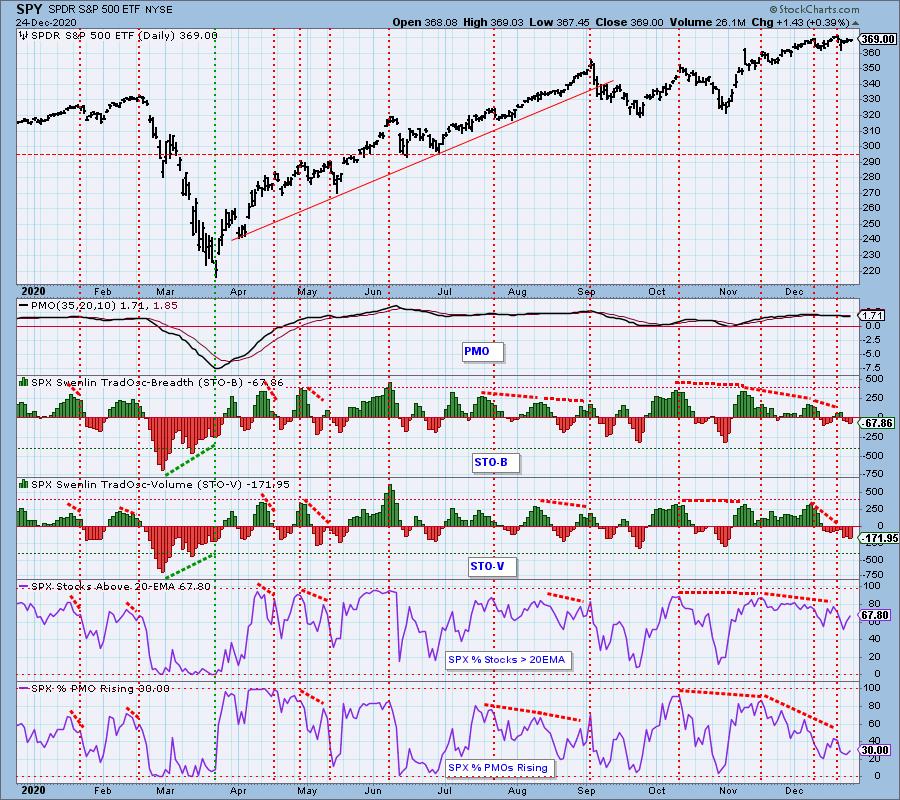
Intermediate-Term Market Indicators: The intermediate-term market trend is UP and the condition is NEUTRAL. The market bias is NEUTRAL. There are plenty of negative divergences in this time frame, the most profound of which is the Percent of PMO BUY Signals. As the market has moved higher, it has dropped to 27.
CONCLUSION: So far, Santa Claus has kept prices elevated for the holiday season, and it is possible that he can keep them up through next week. Something that could keep the rally going even longer is another COVID relief bill. However, market internals look horrible. Overbought readings abound, as do negative divergences. Sentiment is extremely bullish. None of this points to higher prices -- quite the opposite, in fact. At the end of 2019 the market continued higher for several weeks before entering a major decline in mid-February. Similarly, we think another important top is coming, but we don't think we'll have to wait very long.
Have you subscribed the DecisionPoint Diamonds yet? DP does the work for you by providing handpicked stocks/ETFs from exclusive DP scans! Add it with a discount! Contact support@decisionpoint.com for more information!
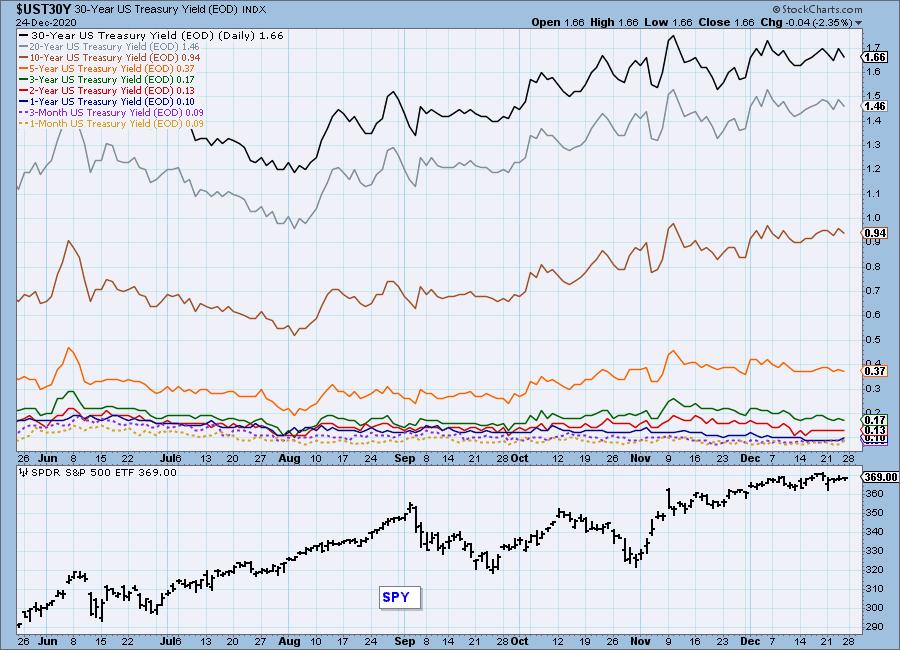
INTEREST RATES
This chart is included so we can monitor rate inversions. In normal circumstances the longer money is borrowed the higher the interest rate that must be paid. When rates are inverted, the reverse is true.
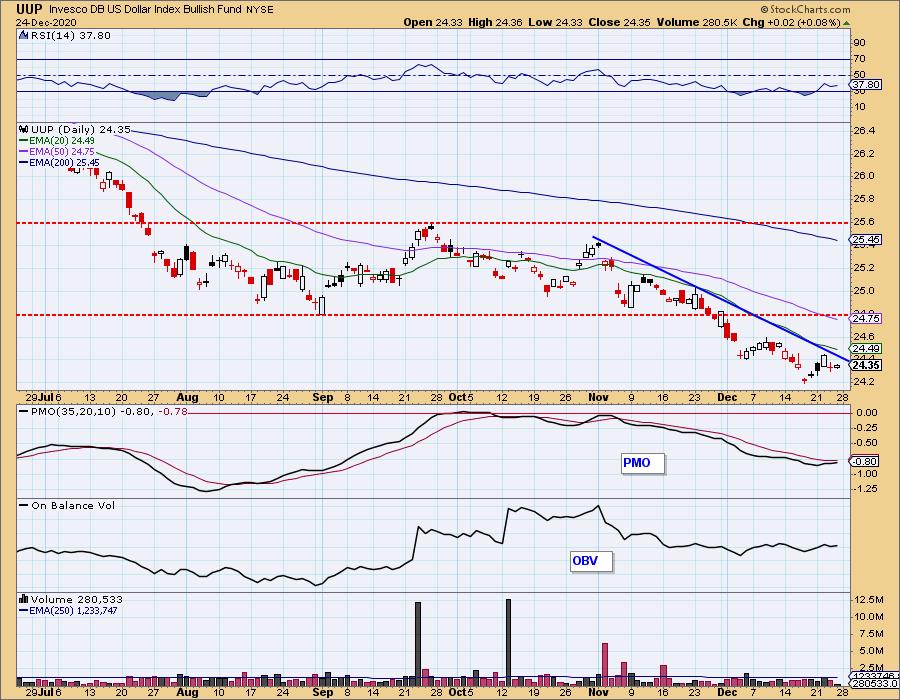
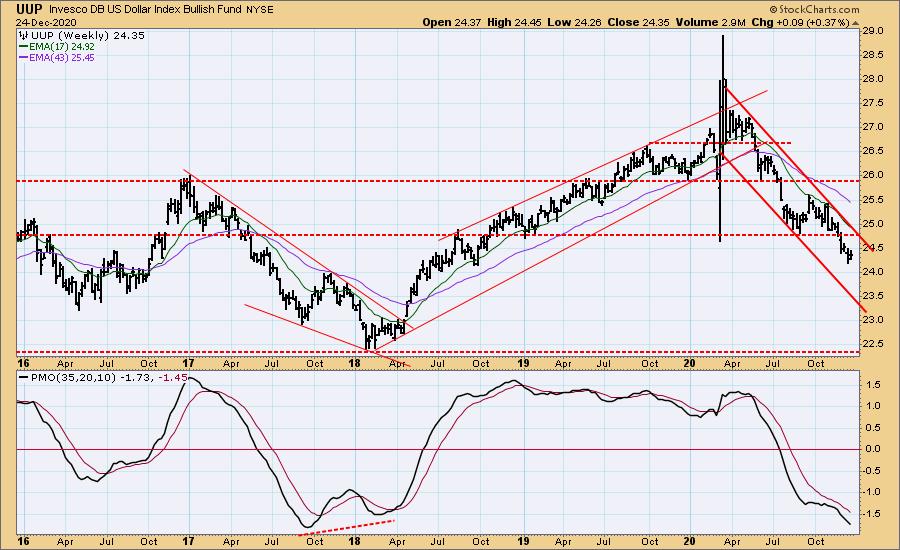
DOLLAR (UUP)
IT Trend Model: NEUTRAL as of 5/28/2020
LT Trend Model: SELL as of 7/10/2020
UUP Daily Chart: UUP is trying to bottom. The PMO has confirmed with a bottom of its own, but it has gone flat -- not a high-confidence buy indication at this point.
UUP Weekly Chart: The weekly PMO is very oversold at this point, but there is no indication of a bottom at this point.
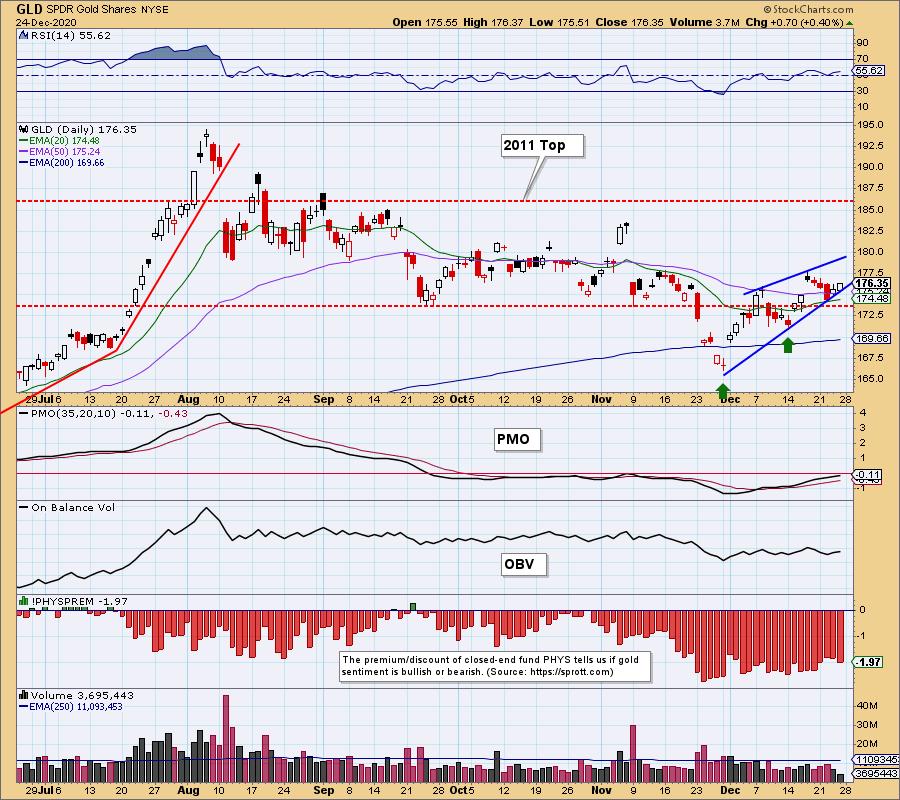
GOLD
IT Trend Model: NEUTRAL as of 10/14/2020
LT Trend Model: BUY as of 1/8/2019
GLD Daily Chart: Price was contained by the bottom of the bearish rising wedge, but it is currently dribbling along that line rather than moving strongly toward the top of the wedge. Our expectation is that the wedge will break down. If that happens, we will start looking for another bottom somewhere above the November low.
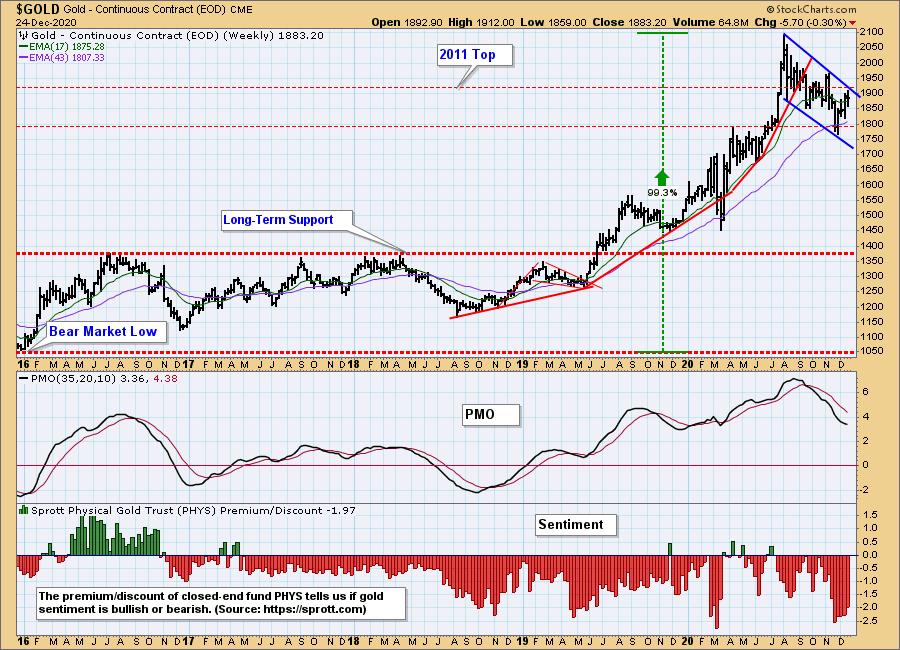
GOLD Weekly Chart: In this time frame we have a bullish falling flag, which is consolidating the advance from the 2018 low.
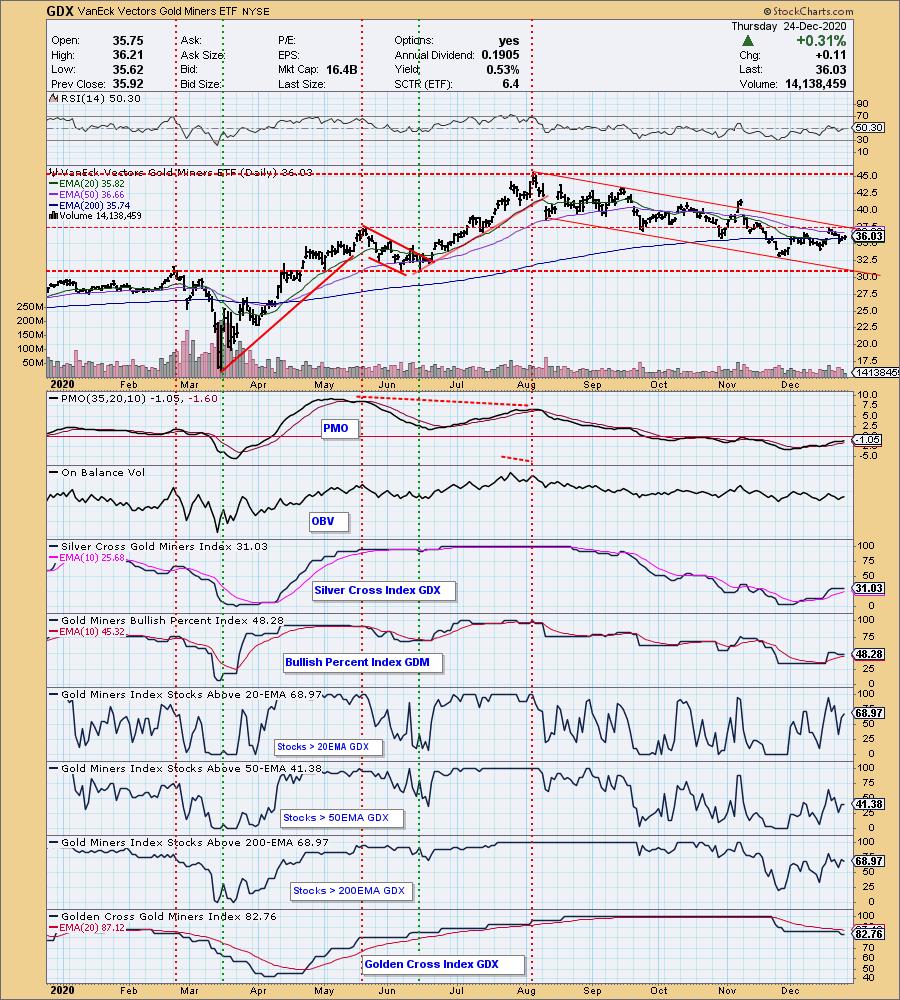
GOLD MINERS Golden and Silver Cross Indexes: GDX should soon be challenging the top of the declining trend channel. Indicators are far from being overbought, so there is a good chance of a breakout.
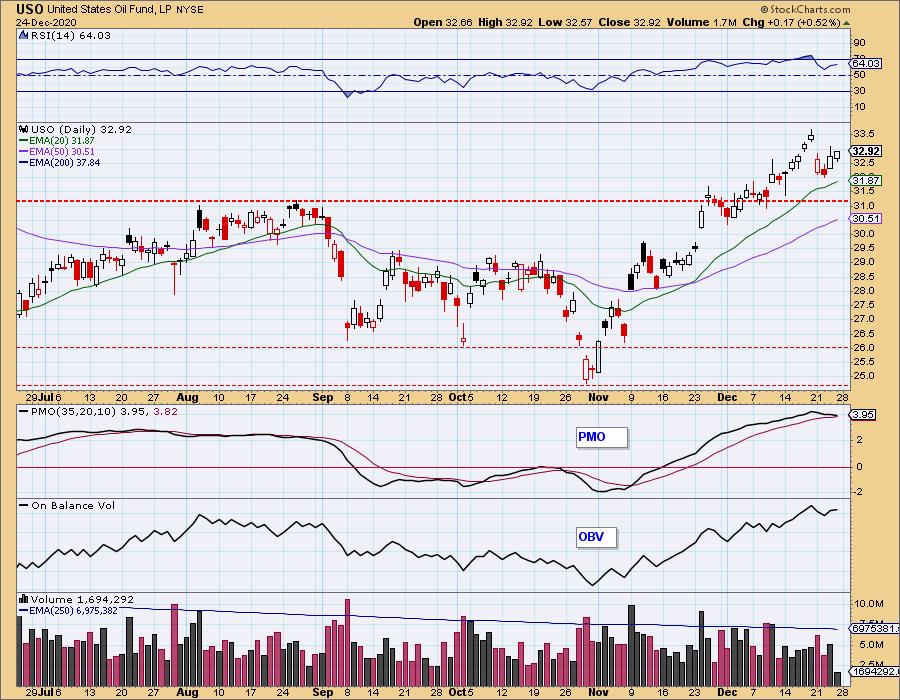
CRUDE OIL (USO)
IT Trend Model: BUY as of 11/23/2020
LT Trend Model: SELL as of 2/3/2020
USO Daily Chart: [[comments]]
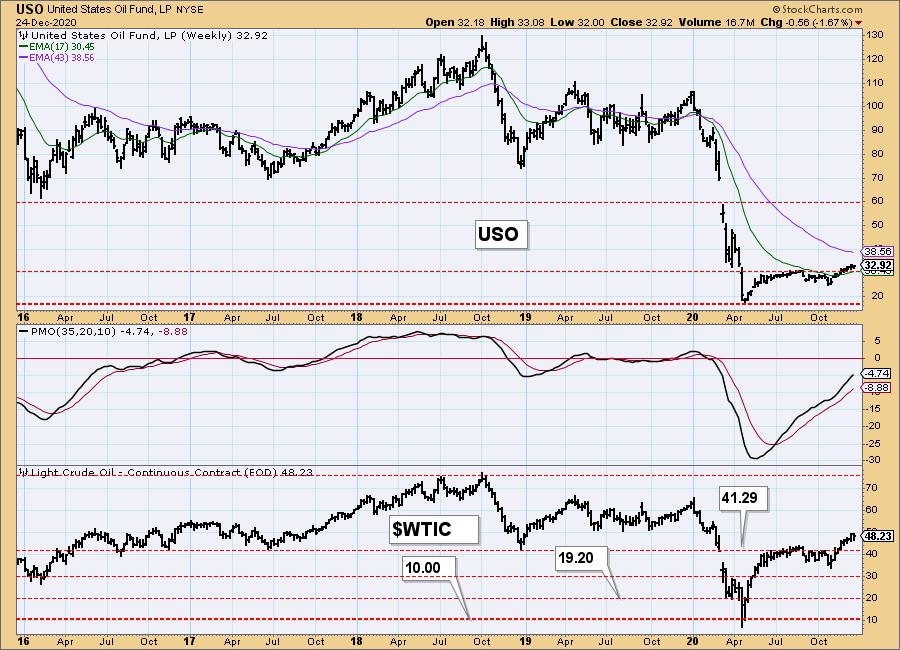
USO/$WTIC Weekly Chart: Crude ($WTIC) has moved significantly higher from the October low, and it has made a strong break above important resistance at about $40.
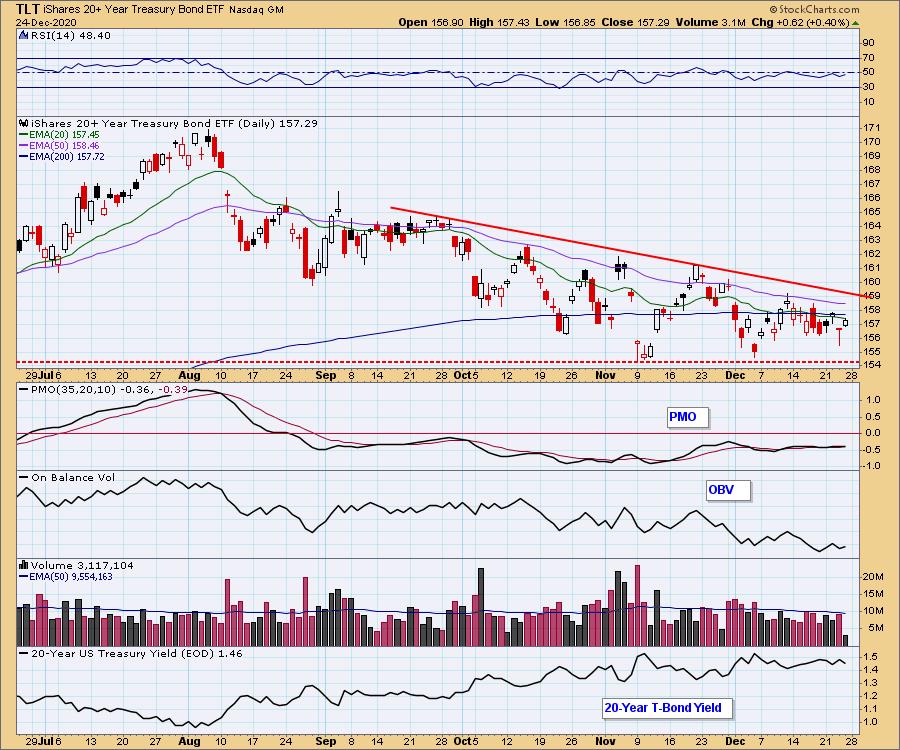
BONDS (TLT)
IT Trend Model: NEUTRAL as of 8/27/2020
LT Trend Model: BUY as of 1/2/2019
TLT Daily Chart: A bearish descending triangle dominates this time frame. This implies falling bond prices and rising interest rates.
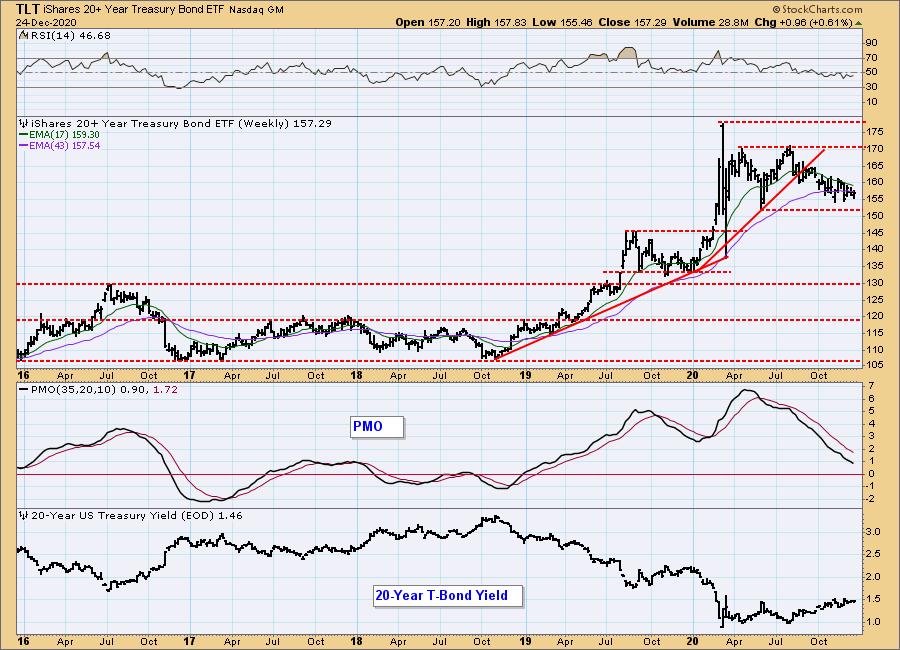
TLT Weekly Chart: Longer-term we can see that TLT is drifting toward the bottom of the trading range.
Technical Analysis is a windsock, not a crystal ball.
-- Carl Swenlin
___________
Our job is not to see the future, it is to see the present very clearly.
-- Jawad Mian, stray-reflections.com
Disclaimer: This blog is for educational purposes only and should not be construed as financial advice. The ideas and strategies should never be used without first assessing your own personal and financial situation, or without consulting a financial professional. Any opinions expressed herein are solely those of the author, and do not in any way represent the views or opinions of any other person or entity.
NOTE: The signal status reported herein is based upon mechanical trading model signals, specifically, the DecisionPoint Trend Model. They define the implied bias of the price index based upon moving average relationships, but they do not necessarily call for a specific action. They are information flags that should prompt chart review. Further, they do not call for continuous buying or selling during the life of the signal. For example, a BUY signal will probably (but not necessarily) return the best results if action is taken soon after the signal is generated. Additional opportunities for buying may be found as price zigzags higher, but the trader must look for optimum entry points. Conversely, exit points to preserve gains (or minimize losses) may be evident before the model mechanically closes the signal.
Helpful DecisionPoint Links:
DecisionPoint Alert Chart List
DecisionPoint Golden Cross/Silver Cross Index Chart List
DecisionPoint Sector Chart List
Price Momentum Oscillator (PMO)
Swenlin Trading Oscillators (STO-B and STO-V)
DecisionPoint is not a registered investment advisor. Investment and trading decisions are solely your responsibility. DecisionPoint newsletters, blogs or website materials should NOT be interpreted as a recommendation or solicitation to buy or sell any security or to take any specific action.