
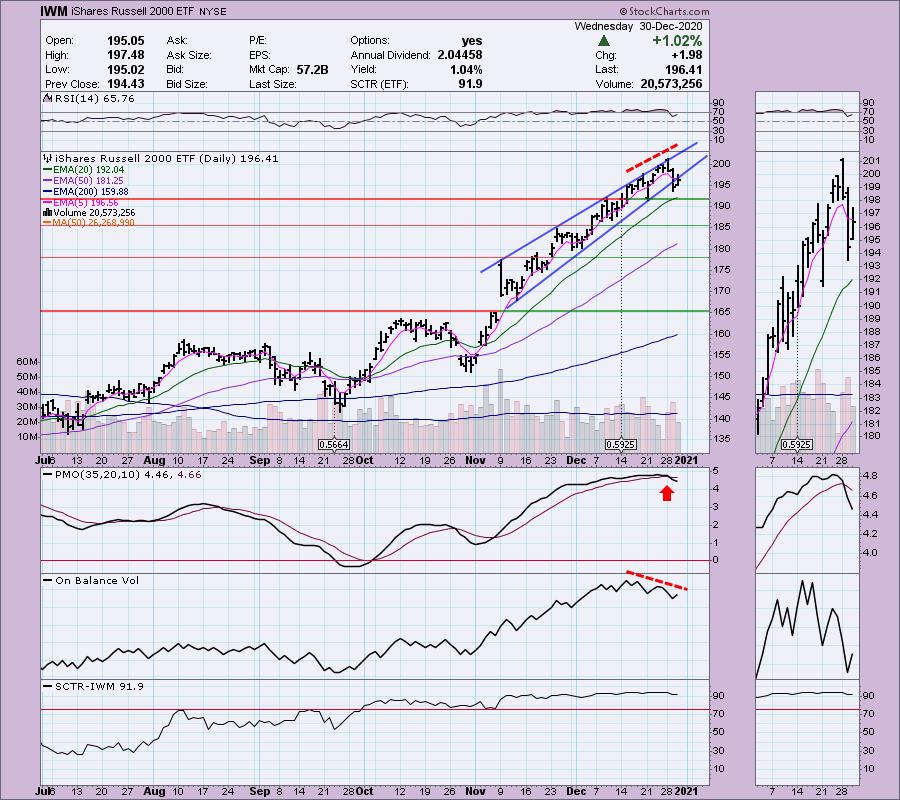
One of my subscribers, Brandon, sent me a chart of the iShares Russell 2000 ETF (IWM) to demonstrate that small-caps have already resolved the bearish rising wedge pattern to the downside as expected. While this isn't necessarily predictive for the SPY, it should give us pause. We can see the familiar negative divergence with the OBV, but like the SPY. IWM has triggered a crossover PMO SELL signal. Even with a 1%+ move today, the PMO didn't really decelerate or budge from its swift decline. There is possible support nearby at the mid-December low and the 20-EMA, but with all of the indicators on the SPY looking negative, this could be telling us what to expect the coming weeks.
The DecisionPoint Alert Weekly Wrap presents an end-of-week assessment of the trend and condition of the Stock Market, the U.S. Dollar, Gold, Crude Oil, and Bonds. The DecisionPoint Alert daily report (Monday through Thursday) is abbreviated and gives updates on the Weekly Wrap assessments.
Watch the latest episode of DecisionPoint on StockCharts TV's YouTube channel here!
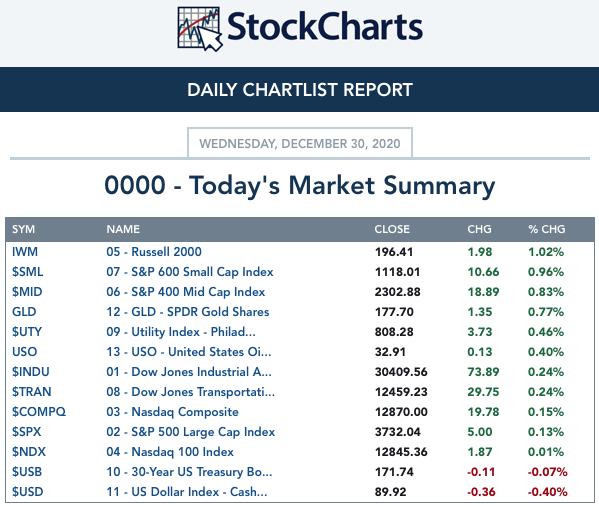
MAJOR MARKET INDEXES
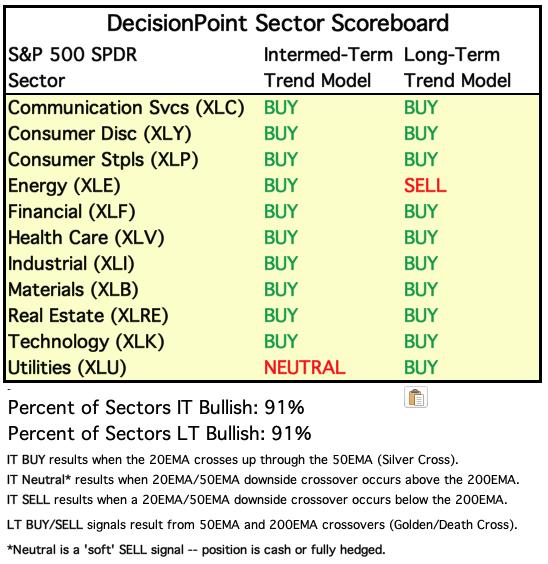
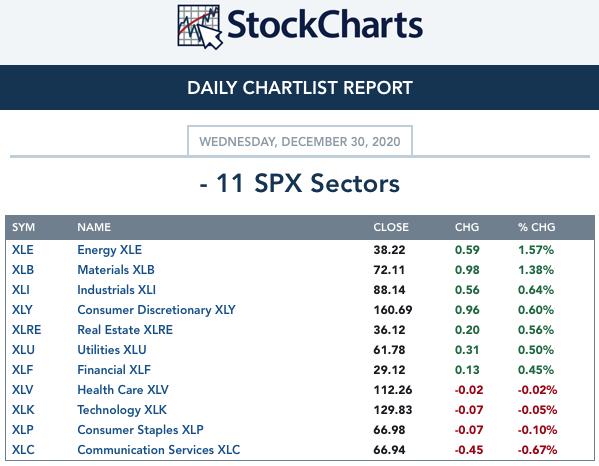
SECTORS
Each S&P 500 Index component stock is assigned to one, and only one, of 11 major sectors. This is a snapshot of the Intermediate-Term (Silver Cross) and Long-Term (Golden Cross) Trend Model signal status for those sectors.
CLICK HERE for Carl's annotated Sector charts.
THE MARKET (S&P 500)
IT Trend Model: BUY as of 5/8/2020
LT Trend Model: BUY as of 6/8/2020
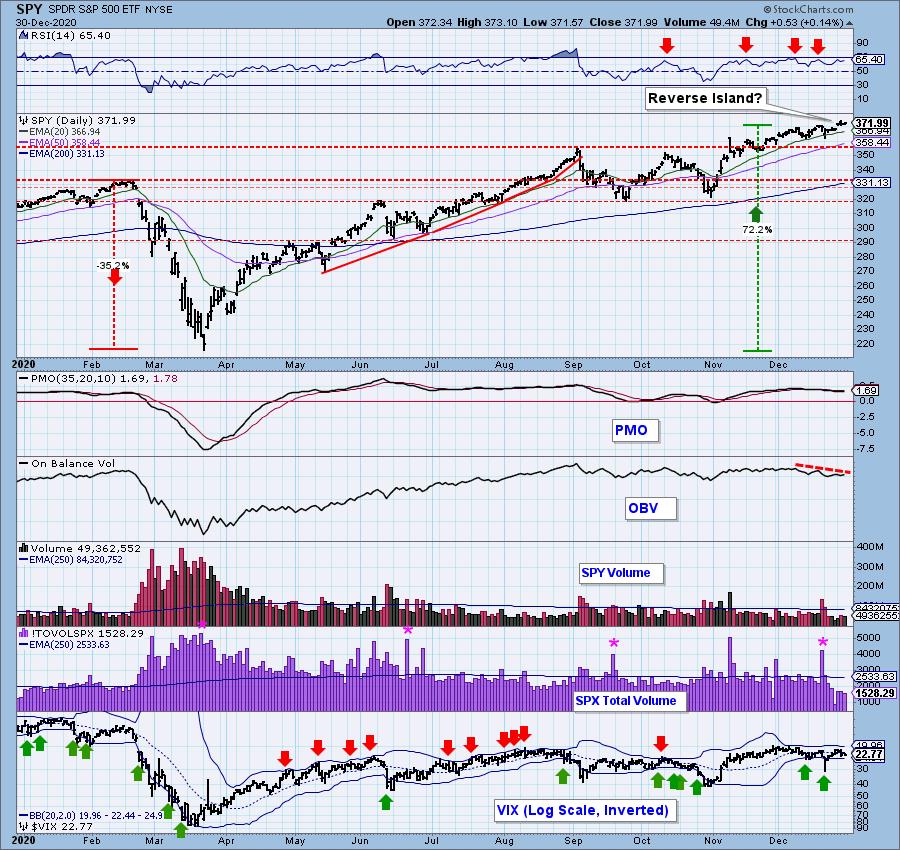
SPY Daily Chart: The rising wedge is still intact on the SPY unlike IWM. However, you can see the OBV negative divergence. Volume contracted slightly, but overall we can see the results of holiday trading with well-below average volume numbers so there isn't much we can conclude. The PMO has officially topped below its signal line and is headed lower. The VIX stayed below its moving average on the inverted scale throughout the day, putting a pall on today's positive close.
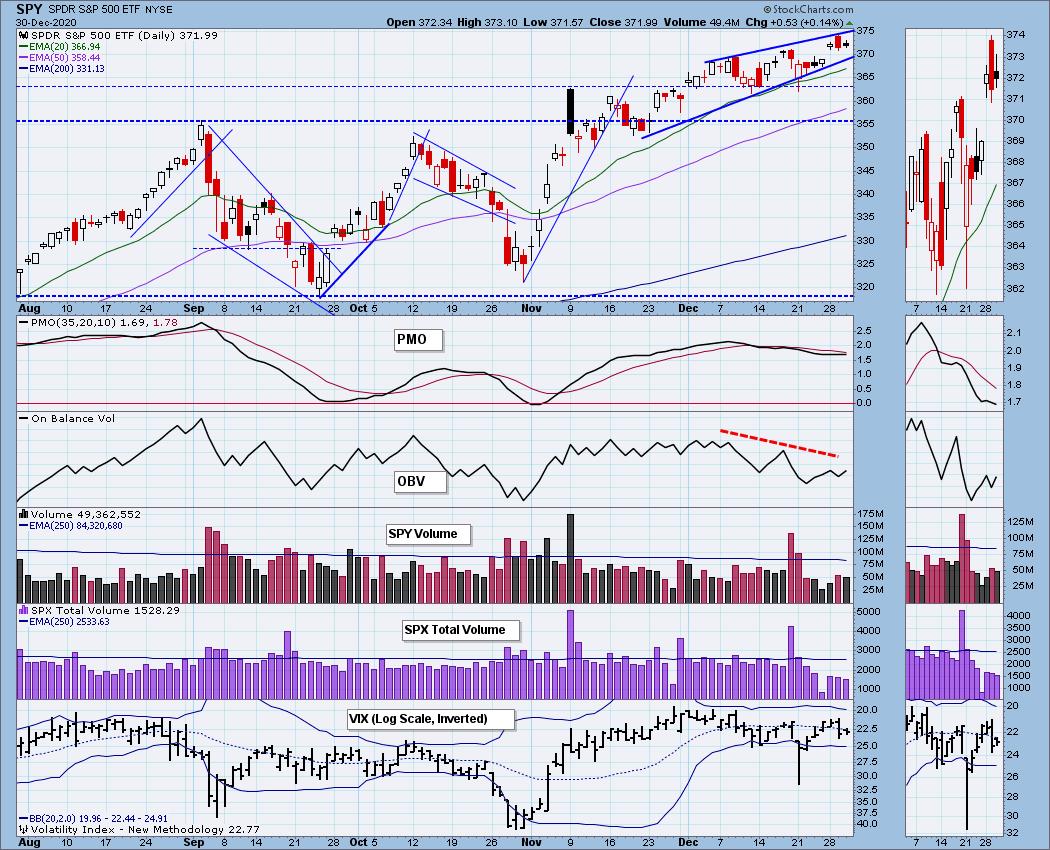
The reverse island is still in play. The expectation would be a gap down. The RSI does remain positive but is in territory where we have seen pullbacks.

It's Free!
***Click here to register for this recurring free DecisionPoint Trading Room on Mondays at Noon ET!***
Did you miss the 12/28 trading room? Here is a linkto the recording -- access code: #=5dJp=G
For best results, copy and paste the access code to avoid typos.
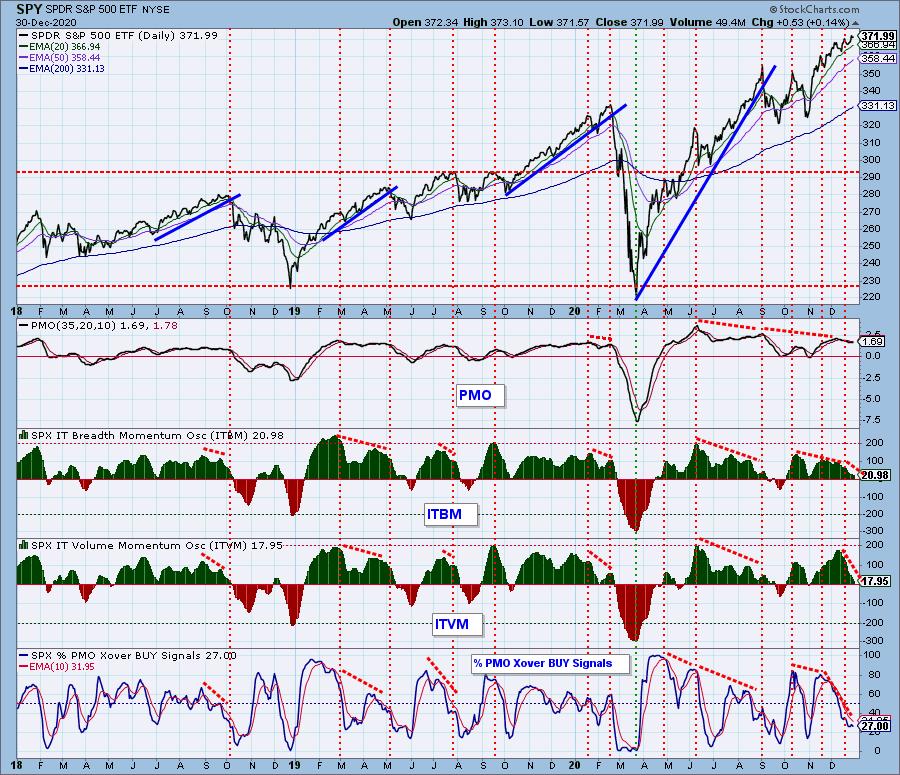
Participation: The following chart uses different methodologies for objectively showing the depth and trend of participation for intermediate- and long-term time frames.
- The Silver Cross Index (SCI) shows the percentage of SPX stocks on IT Trend Model BUY signals (20-EMA > 50-EMA).
- The Golden Cross Index (GCI) shows the percentage of SPX stocks on LT Trend Model BUY signals (50-EMA > 200-EMA).
- The Bullish Percent Index (BPI) shows the percentage of SPX stocks on Point & Figure BUY signals.
Today the SCI crossed below its signal line. This on a day with a positive close. The BPI did tick upward, but it remains in a negative divergence with price tops. The GCI is very overbought.
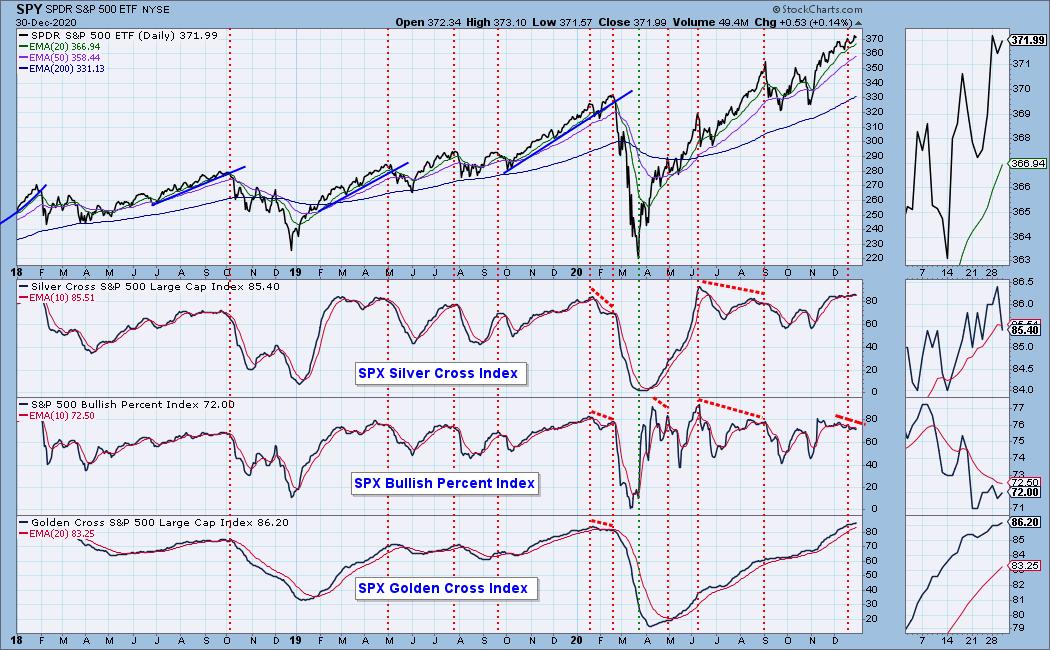
Negative divergences are still visible in all three timeframes.
Climactic Market Indicators: No climax today.
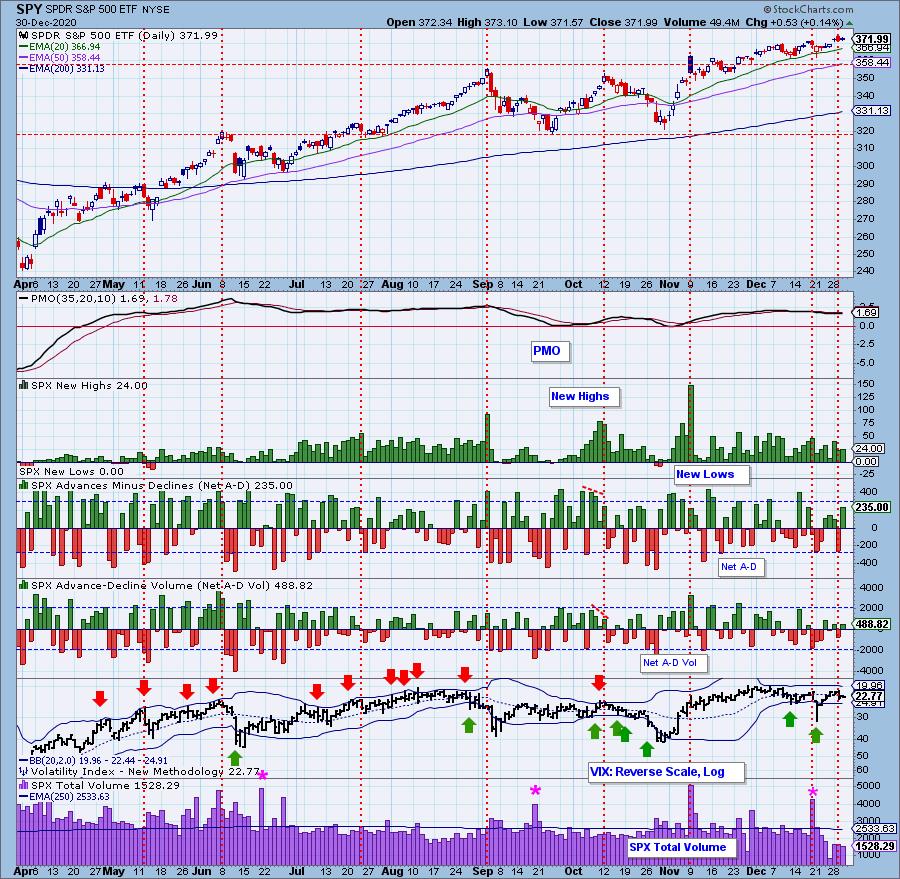
Short-Term Market Indicators: The short-term market trend is UP and the condition is NEUTRAL.
The bulls can hang their hat on the STOs right now which continue to rise. Additionally, the STO-B has reached positive territory. We still have less than 1/3 of the SPX members with rising momentum.
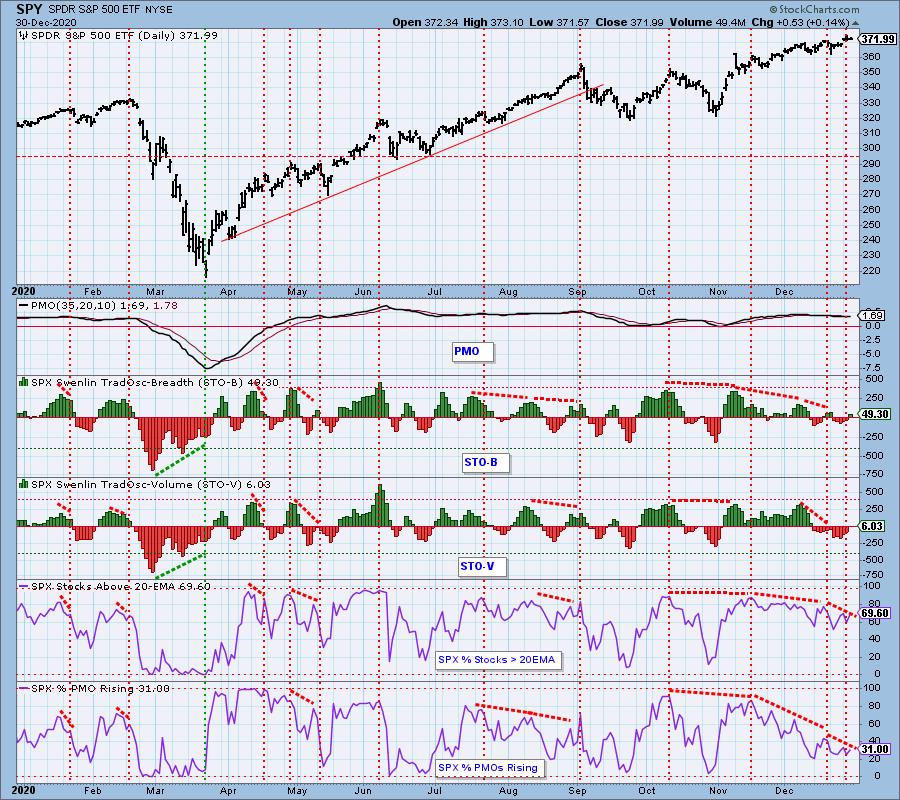
Intermediate-Term Market Indicators: The intermediate-term market trend is UP and the condition is NEUTRAL. The intermediate-term market bias is NEUTRAL.
Both of these indicators fell slightly today. The bullish bias in this timeframe has disintegrated. The negative divergences are stark.
CONCLUSION: In all honesty, yesterday's conclusion still holds true so I am going to repeat it.
"There are so many signposts today that suggest lower prices. Let us count them... 1) PMO top below the signal line, 2) Bearish engulfing candle, 3) VIX closing below its EMA on the inverted scale, 4) Downside spike on Net A-D, 5) Possible Reverse Island, 6) Negative divergences galore in all timeframes... For bulls, the STOs are rising and the RSI is positive. I would say the scales weigh heavily toward the bears."
January is almost here and I suspect it will be a difficult trading environment. Tomorrow we should be fine with only a half day of trading and most investors on holiday. However, we should gird ourselves and be ready for what the next few weeks bring. There's still a presidential transition to deal with and it will be interesting to see how the market reacts.
Another item to keep in mind is the distribution of stimulus which could put a bullish light on Financials which did well after the last round of stimulus and PPP were released. In the Diamonds Reports, I will likely be looking at a few shorting opportunities.
Finally, there is the ever-present COVID complications as vaccines are rolled out and new strains are begin to pop up. Healthcare could be rather volatile in the coming month.
Have you subscribed the DecisionPoint Diamonds yet? DP does the work for you by providing handpicked stocks/ETFs from exclusive DP scans! Add it with a discount! Contact support@decisionpoint.com for more information!
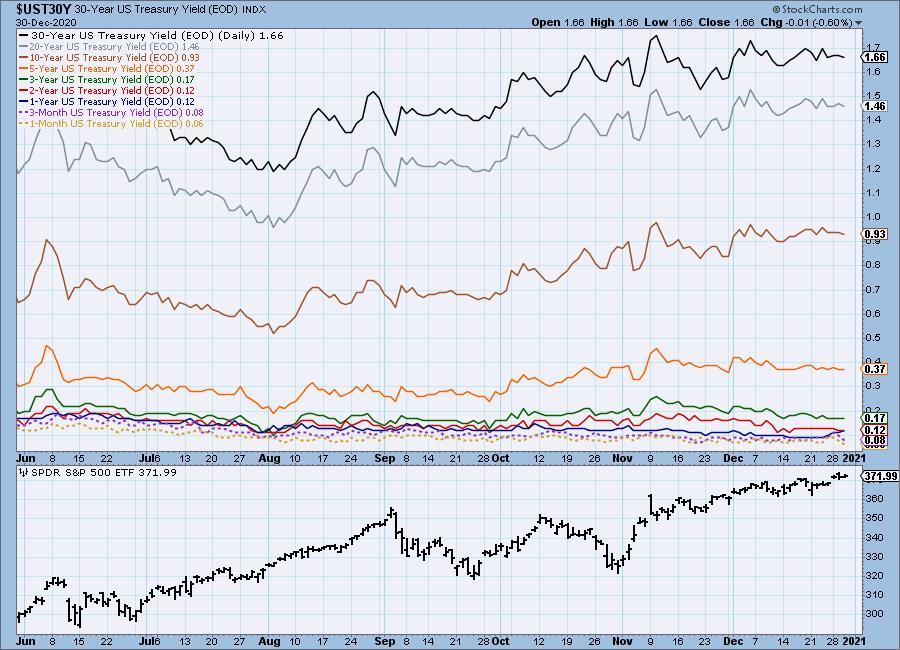
INTEREST RATES
This chart is included so we can monitor rate inversions. In normal circumstances the longer money is borrowed the higher the interest rate that must be paid. When rates are inverted, the reverse is true.
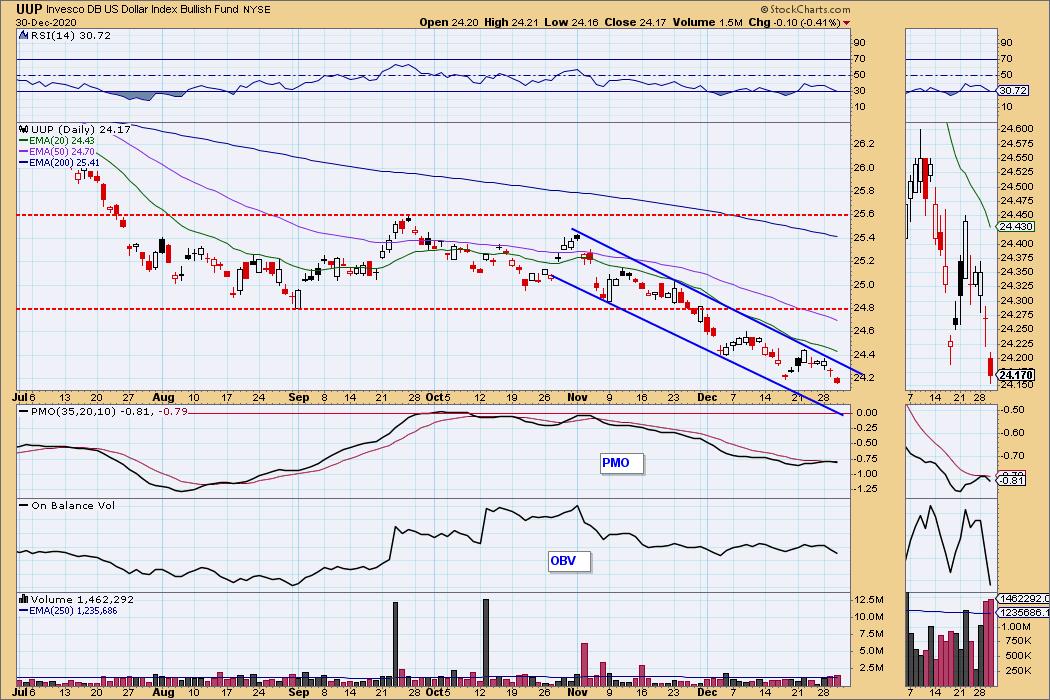
DOLLAR (UUP)
IT Trend Model: NEUTRAL as of 5/28/2020
LT Trend Model: SELL as of 7/10/2020
UUP Daily Chart: The continues to weaken and the chart is getting uglier. The PMO has topped below its signal line and is moving lower. The RSI is very negative. It is getting oversold, but you can see the last two rallies out of oversold territory weren't impressive and the declining trend was not broken.
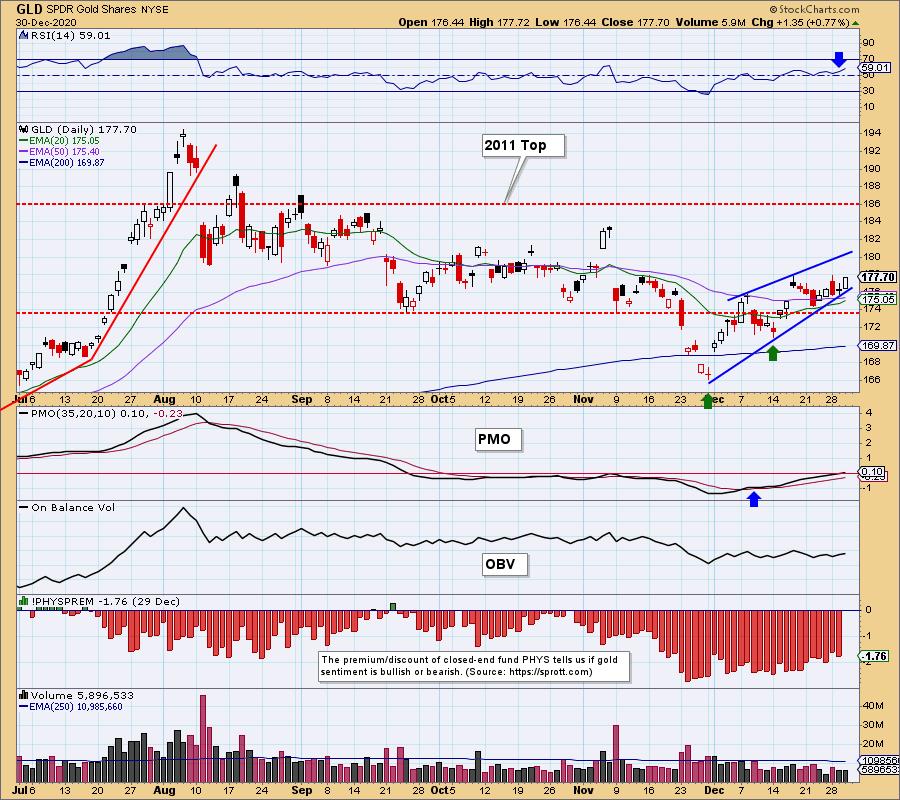
GOLD
IT Trend Model: NEUTRAL as of 10/14/2020
LT Trend Model: BUY as of 1/8/2019
GLD Daily Chart: Carl wrote an excellent article on Gold today. I don't need to add to it, so here is the link.
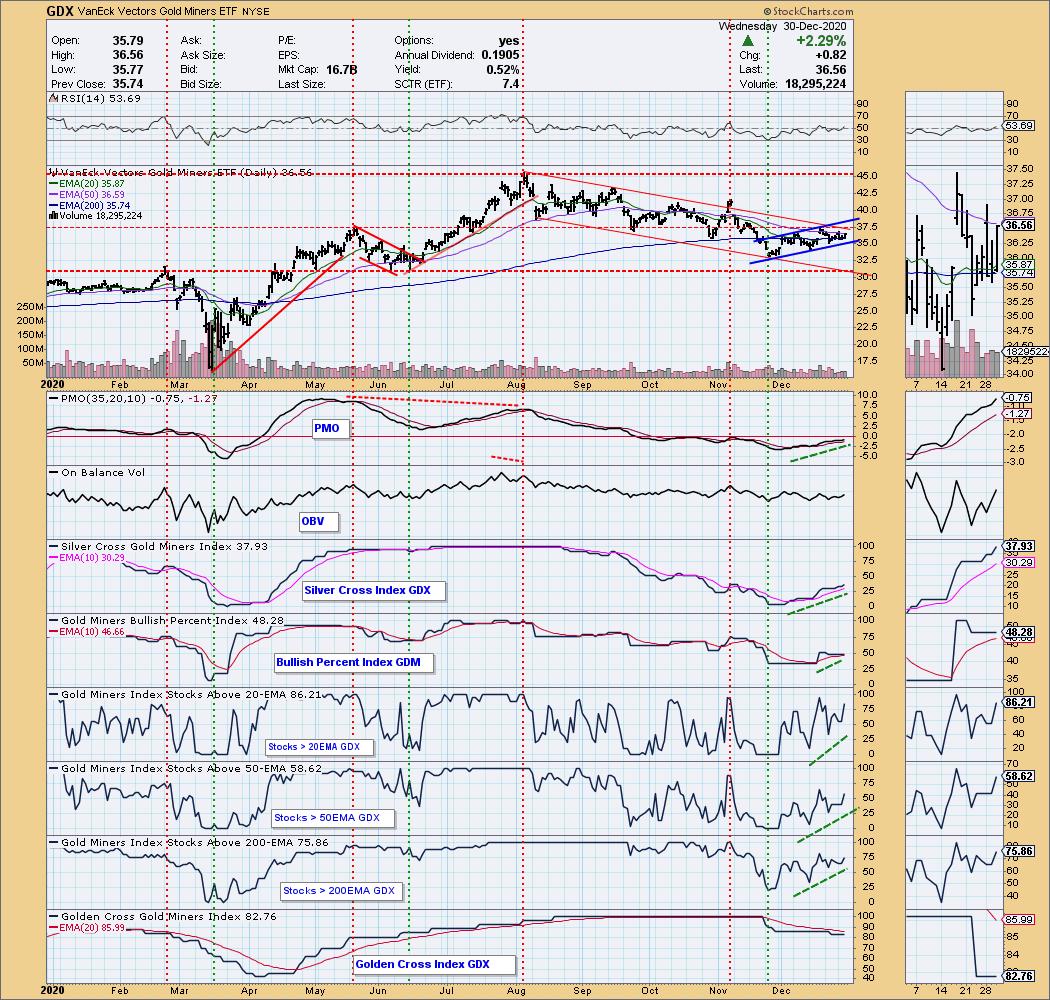
GOLD MINERS Golden and Silver Cross Indexes: Miners finished the day with a 2%+ rally and it continues to move higher within the short-term rising trend channel. The RSI has just moved into positive territory and the PMO has begun to accelerate higher. We've seen massive improvement on the indicators and they aren't particularly overbought. I like Miners going forward, but there is still some strong resistance for them to overcome--namely the 50-EMA, declining trendline and May top.
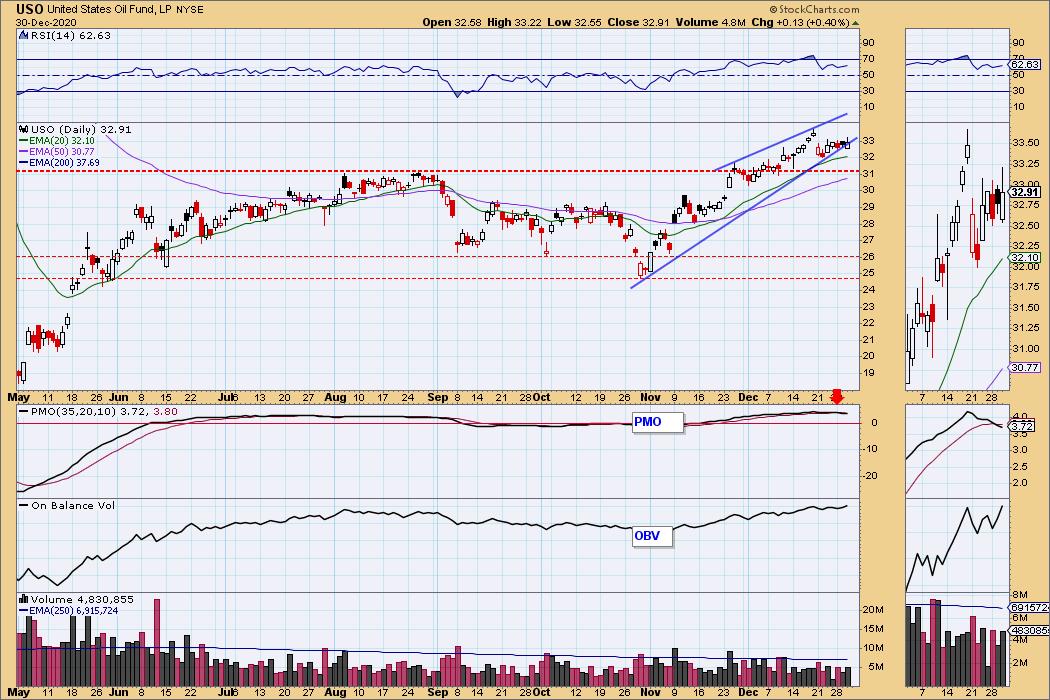
CRUDE OIL (USO)
IT Trend Model: BUY as of 10/20/2020
LT Trend Model: SELL as of 2/3/2020
USO Daily Chart: USO closed higher on the day but did drop briefly below the rising wedge. The 20-EMA is there for support, but it seems USO is ready to pullback to at least $31 given the PMO crossover SELL signal. The RSI is still positive so at this point I'm not expecting a deep correction.
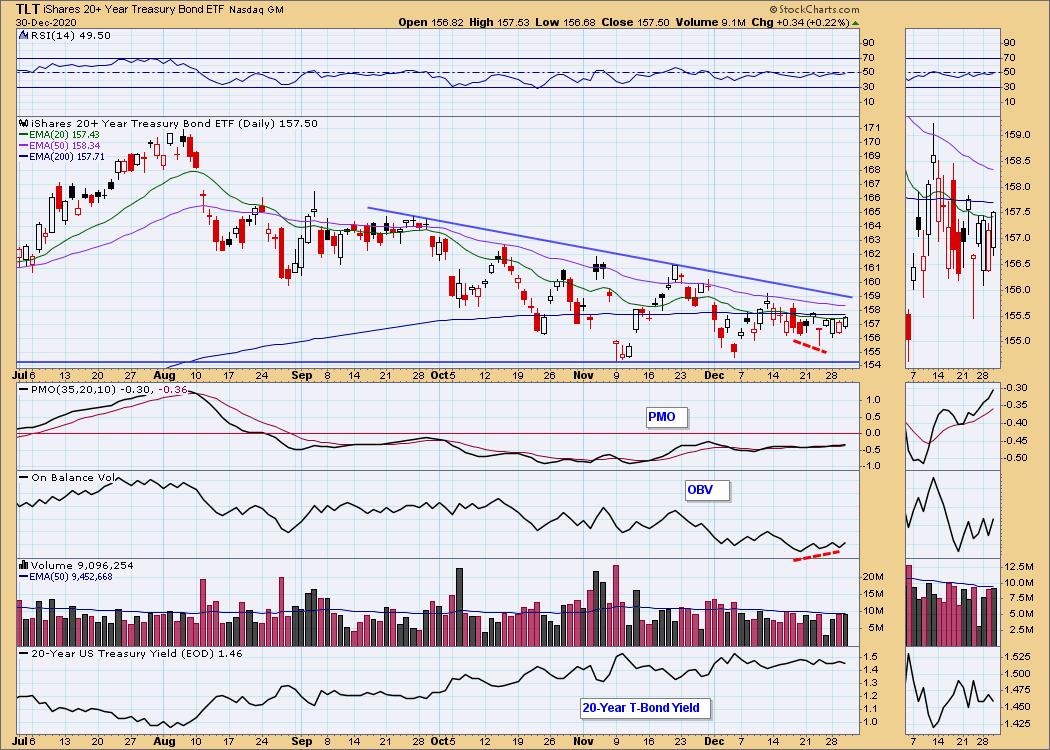
BONDS (TLT)
IT Trend Model: NEUTRAL as of 8/27/2020
LT Trend Model: BUY as of 1/2/2019
TLT Daily Chart: TLT continues to stay just below its EMAs. Usually positive divergences turn into rallies, but we haven't seen that coming off the latest. We do have rising OBV bottoms that are in line with the very short-term rising trend seen in the thumbnail. However, I don't like the bearish descending triangle. Of course, the PMO is rising, albeit below the zero line and the RSI is working hard to reach positive territory. Until we see a decisive breakout above the EMAs or out of the declining trend, I wouldn't expect much out of Bonds.
Full Disclosure: I own TLT
Technical Analysis is a windsock, not a crystal ball.
Happy Charting! - Erin
Disclaimer: This blog is for educational purposes only and should not be construed as financial advice. The ideas and strategies should never be used without first assessing your own personal and financial situation, or without consulting a financial professional. Any opinions expressed herein are solely those of the author, and do not in any way represent the views or opinions of any other person or entity.
NOTE: The signal status reported herein is based upon mechanical trading model signals, specifically, the DecisionPoint Trend Model. They define the implied bias of the price index based upon moving average relationships, but they do not necessarily call for a specific action. They are information flags that should prompt chart review. Further, they do not call for continuous buying or selling during the life of the signal. For example, a BUY signal will probably (but not necessarily) return the best results if action is taken soon after the signal is generated. Additional opportunities for buying may be found as price zigzags higher, but the trader must look for optimum entry points. Conversely, exit points to preserve gains (or minimize losses) may be evident before the model mechanically closes the signal.
Helpful DecisionPoint Links:
DecisionPoint Alert Chart List
DecisionPoint Golden Cross/Silver Cross Index Chart List
DecisionPoint Sector Chart List
Price Momentum Oscillator (PMO)
Swenlin Trading Oscillators (STO-B and STO-V)
DecisionPoint is not a registered investment advisor. Investment and trading decisions are solely your responsibility. DecisionPoint newsletters, blogs or website materials should NOT be interpreted as a recommendation or solicitation to buy or sell any security or to take any specific action.