
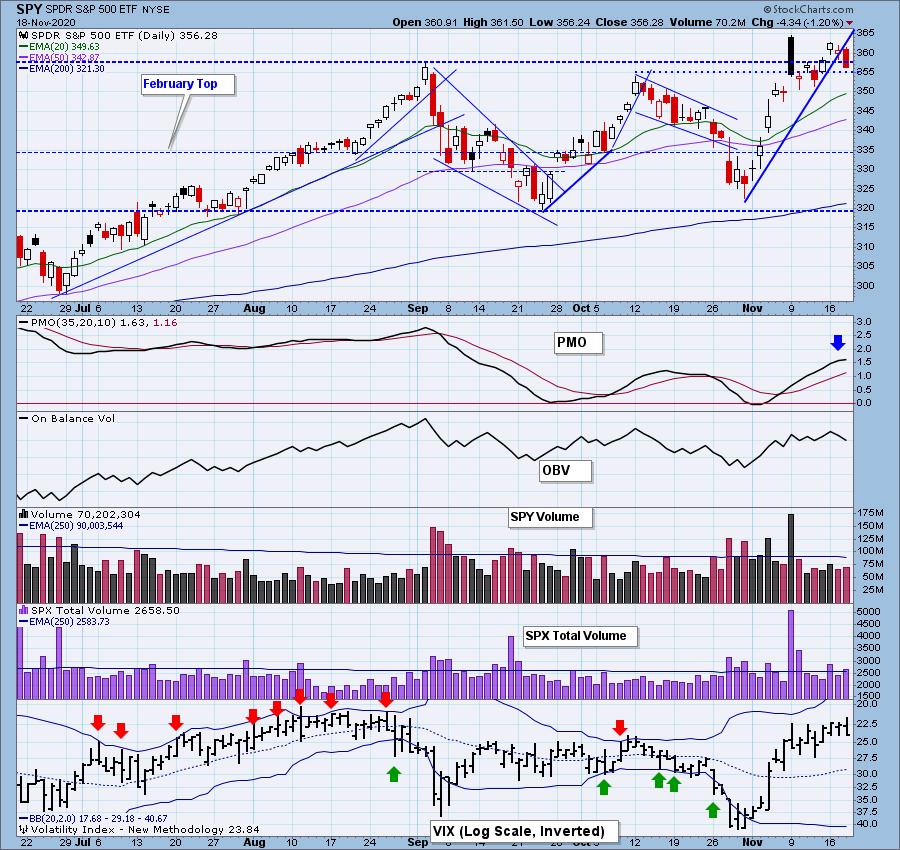
I have a robust email box full of subscriber and viewer questions. I also get them during the free DecisionPoint Trading Room. It is my absolute pleasure to communicate with my subscribers (hence the trading rooms) so feel free to send me your questions. A recent email asked me what kind of chart pattern we are looking at on the SPY and many of the major indexes right now.
Well of course most would point to the double-bottom pattern. Unfortunately that wouldn't be correct. Those are reversal patterns and should appear at the end of a decline, not the top of a rising trend.
So is it a flag formation then? I don't think so. The flag portion angles up and the large "white space" between the tops and the bottoms are generally a clue that it isn't that. Although, I wouldn't argue with anyone who was passionate about it being a flag.
So what is it then? My belief is that it is simply a large consolidation zone or trading channel. Price attempted to break above the channel, but failed and has now closed back within it. Given the RSI is tipping over and the PMO is beginning to decelerate, I would look for price to move lower toward the bottom of that channel. Other indicators support this hypothesis.
The DecisionPoint Alert Weekly Wrap presents an end-of-week assessment of the trend and condition of the Stock Market, the U.S. Dollar, Gold, Crude Oil, and Bonds. The DecisionPoint Alert daily report (Monday through Thursday) is abbreviated and gives updates on the Weekly Wrap assessments.
Watch the latest episode of DecisionPoint on StockCharts TV's YouTube channel here!
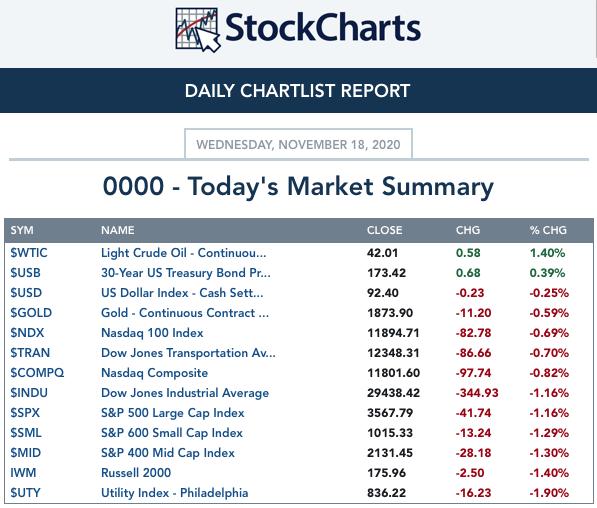
MAJOR MARKET INDEXES
SECTORS
Each S&P 500 Index component stock is assigned to one, and only one, of 11 major sectors. This is a snapshot of the Intermediate-Term (Silver Cross) and Long-Term (Golden Cross) Trend Model signal status for those sectors.
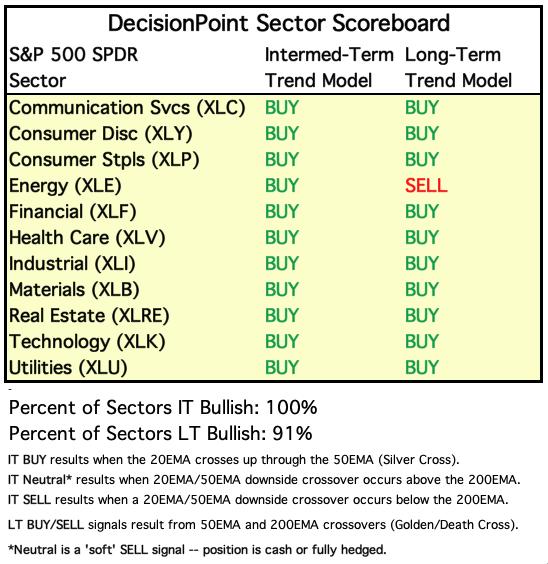
CLICK HERE for Carl's annotated Sector charts.
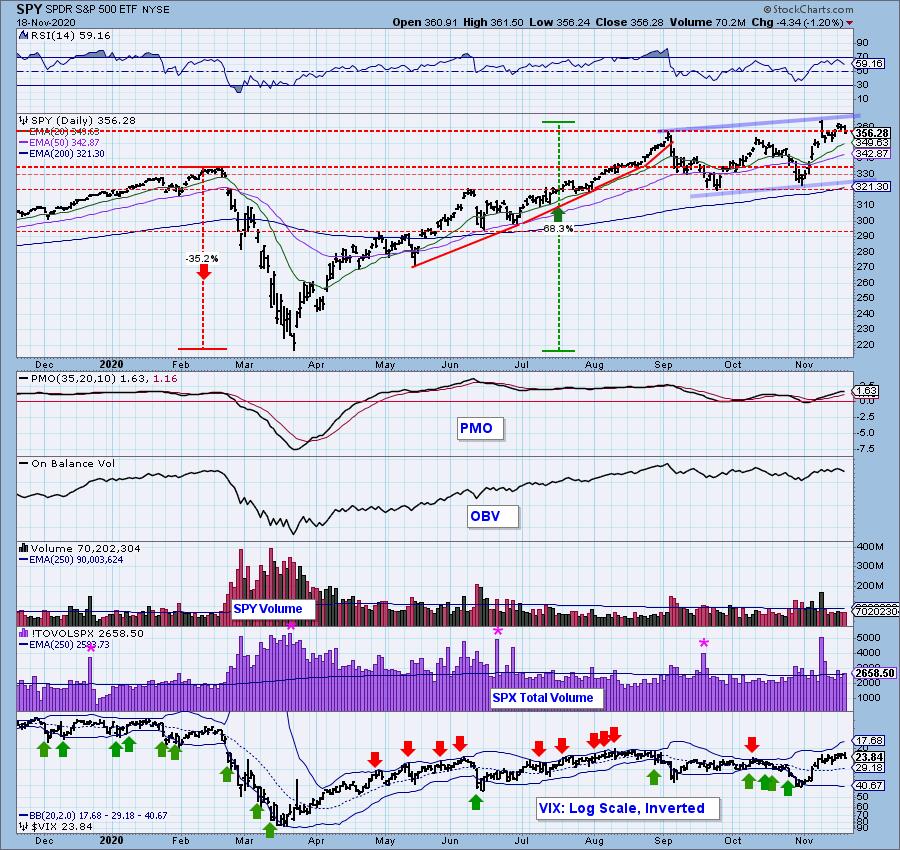
THE MARKET (S&P 500)
IT Trend Model: BUY as of 5/8/2020
LT Trend Model: BUY as of 6/8/2020
SPY Daily Chart: Today's decline broke the rising trend. Price remains above the October top, but with a topping PMO and this decline coming on above average total volume, I am not expecting this level to hold.

It's Free!
***Click here to register for this recurring free DecisionPoint Trading Room on Mondays at Noon ET!***
Did you miss the 11/16 trading room? Here is a link to the recording -- access code: =8STr92*
For best results, copy and paste the access code to avoid typos.
Participation: The following chart uses different methodologies for objectively showing the depth and trend of participation for intermediate- and long-term time frames.
- The Silver Cross Index (SCI) shows the percentage of SPX stocks on IT Trend Model BUY signals (20-EMA > 50-EMA).
- The Golden Cross Index (GCI) shows the percentage of SPX stocks on LT Trend Model BUY signals (50-EMA > 200-EMA).
- The Bullish Percent Index (BPI) shows the percentage of SPX stocks on Point & Figure BUY signals.
The BPI topped again in overbought territory and is headed toward a negative crossover its signal line. The SCI is rising and could certainly move higher despite being overbought right now. The GCI is rising strongly which is positive in the long term.
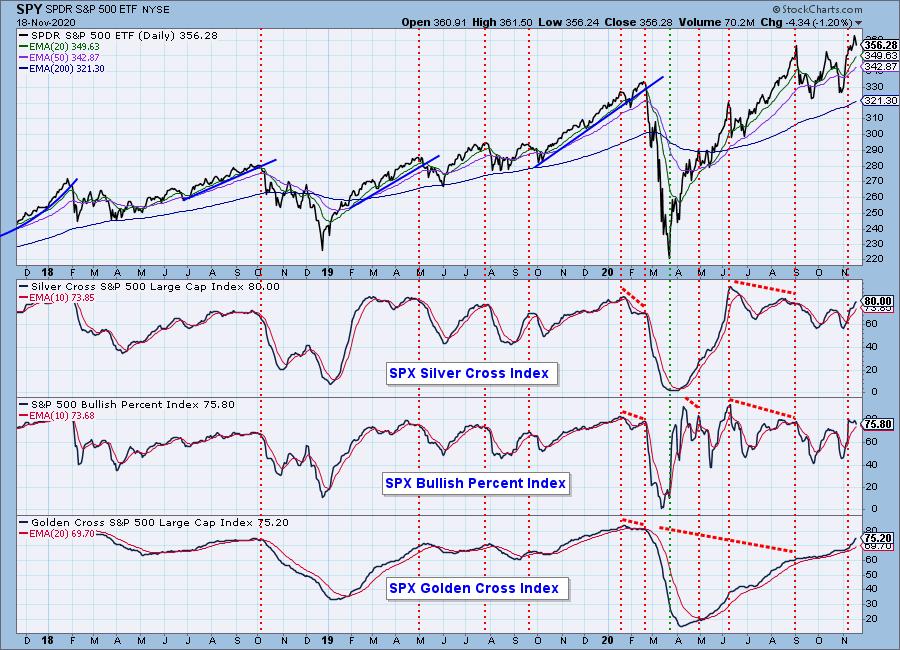
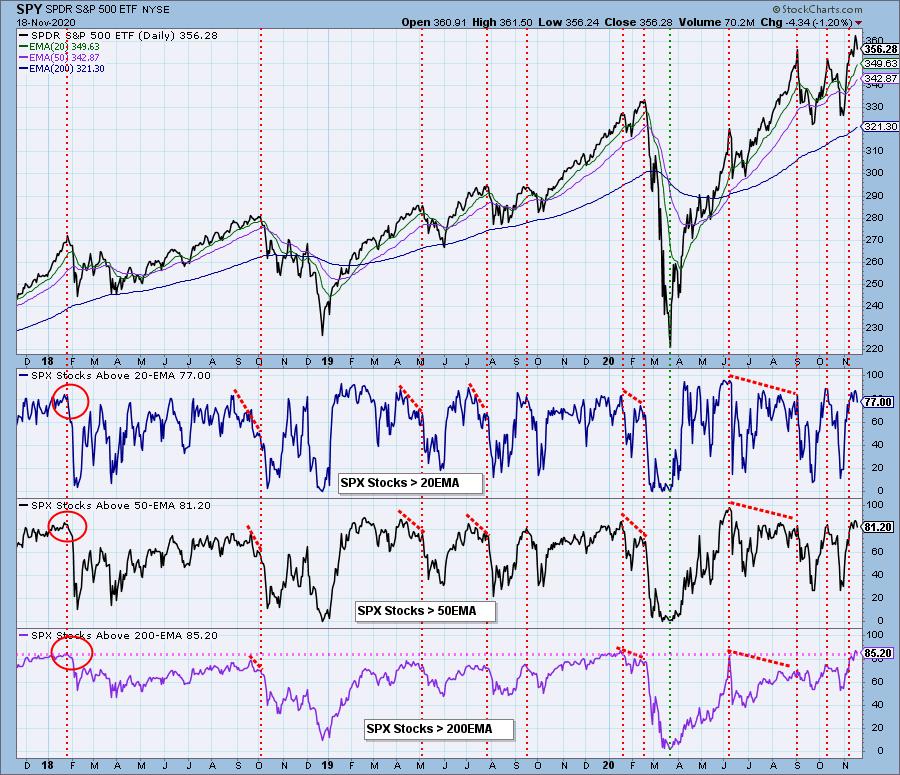
%Stocks > 20/50/200-EMAs remain overbought and are topping.
Climactic Market Indicators: We had a climactic reading on the Net A-D, but not so much on the other Net A-D Volume. I found it interesting (but not all that meaningful) that we had a few more New Highs on today's decline. The VIX is strong and staying well above its 20-EMA which is bullish for the short term.
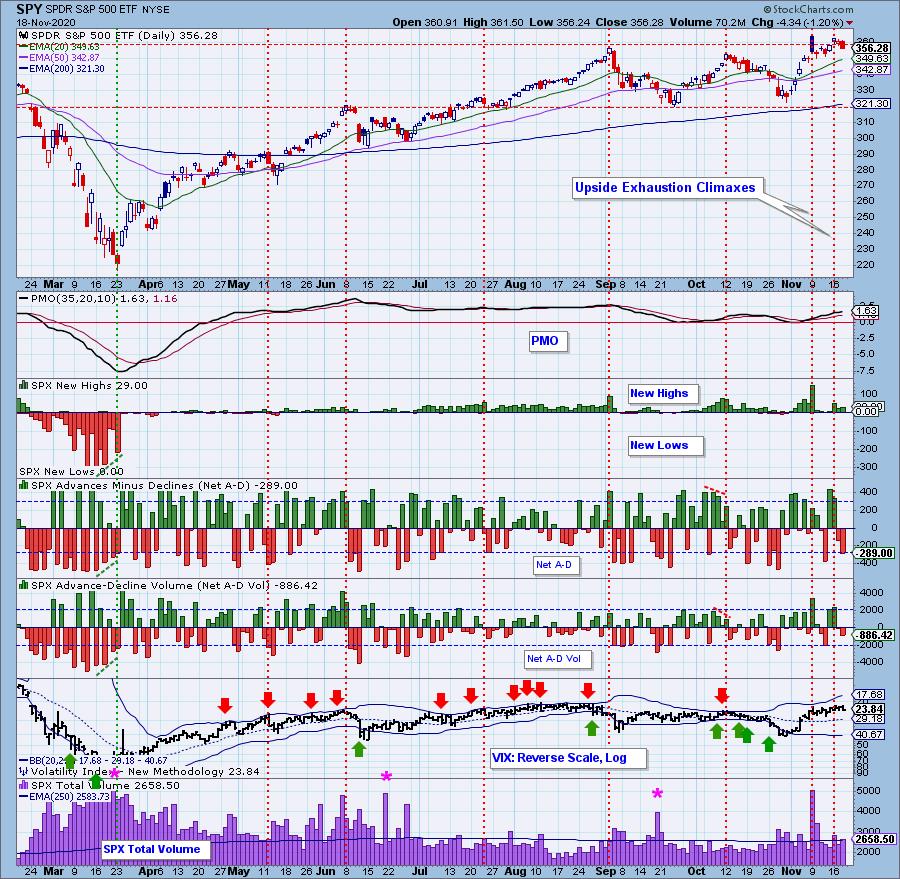
Short-Term Market Indicators: The short-term market trend is UP and the condition is NEUTRAL.
The STOs continued to drop and that is an excellent indicator that we will see lower prices continue. Not only that, but we see the %Stocks indicators all topping in overbought territory.
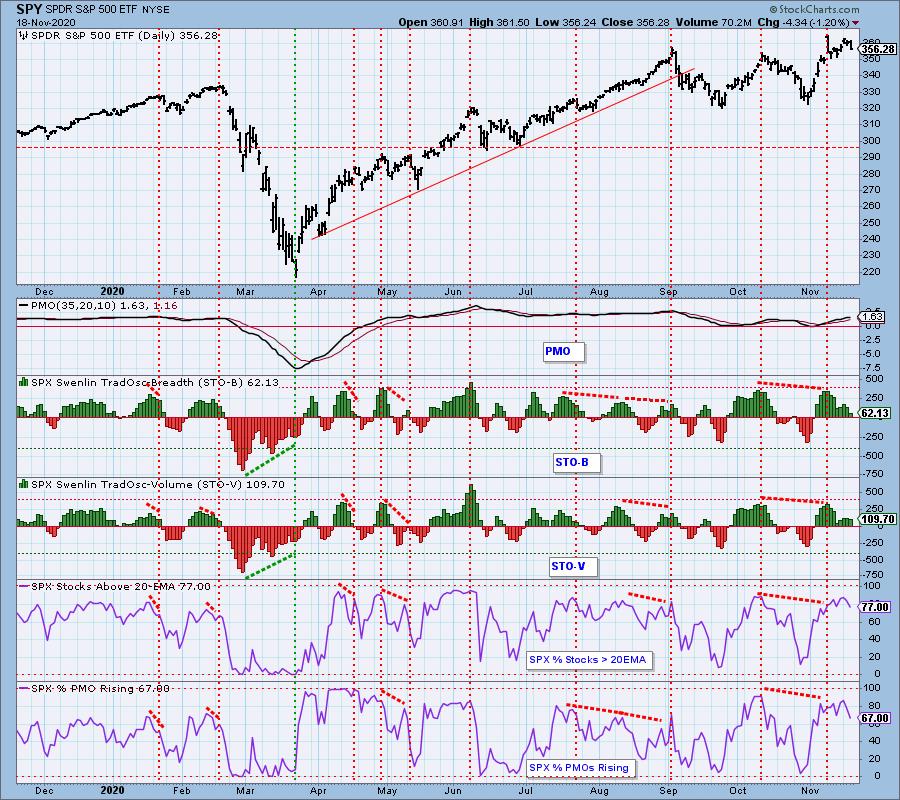
Intermediate-Term Market Indicators: The intermediate-term market trend is UP and the condition is OVERBOUGHT. The market bias is BULLISH.
The ITBM pulled back but not the ITVM. If the ITVM tops here as well, we will have two sharp negative divergences logged.
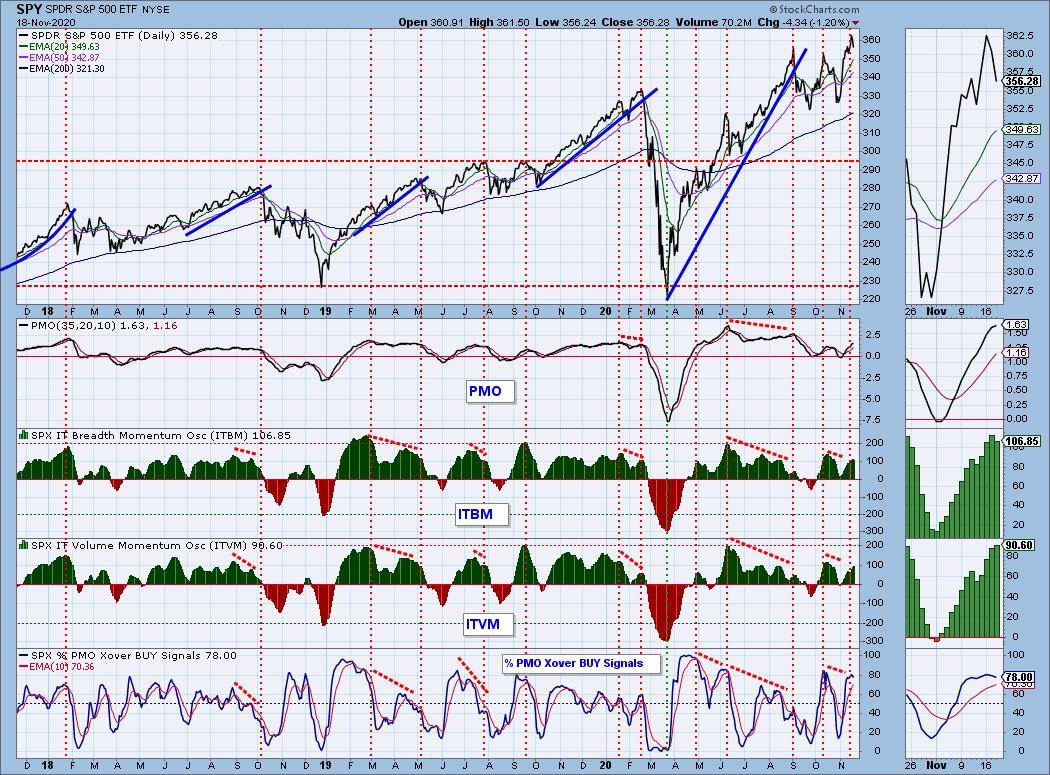
CONCLUSION: I don't believe we have a fancy chart pattern here, just a boring trading channel that we happen to be at the top of. Trading channels are created by price bopping back and forth between the top of the channel and the very bottom. We are at the top which generally means a test of the bottom of the channel. Indicators are overbought in every time frame and are turning over including the all important PMO. The VIX may be the only bright spot but I wouldn't hang my hat on that one indicator. I'm expecting more decline.
Have you subscribed the DecisionPoint Diamonds yet? DP does the work for you by providing handpicked stocks/ETFs from exclusive DP scans! Add it with a discount! Contact support@decisionpoint.com for more information!
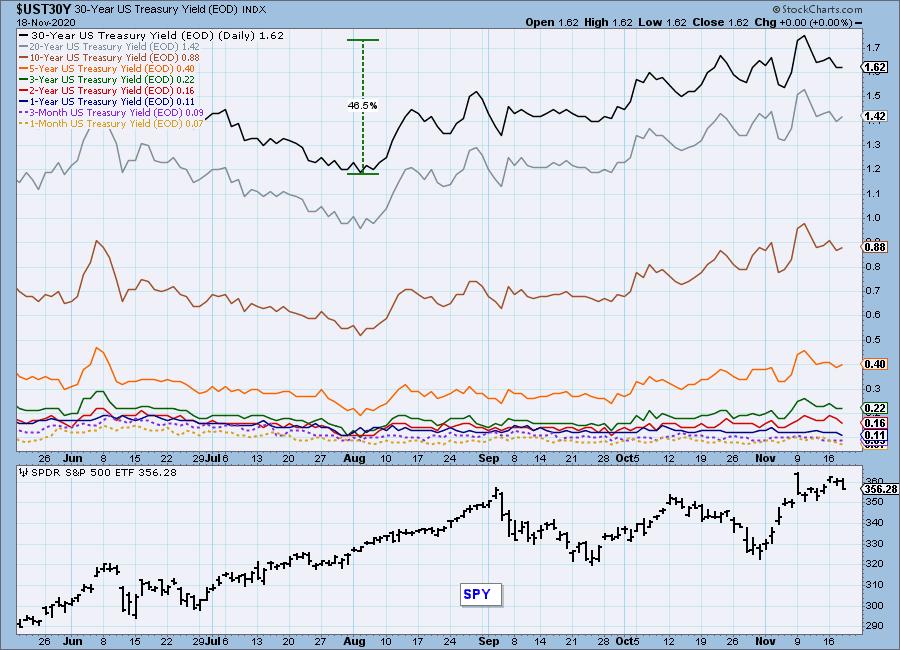
INTEREST RATES
This chart is included so we can monitor rate inversions. In normal circumstances the longer money is borrowed the higher the interest rate that must be paid. When rates are inverted, the reverse is true.
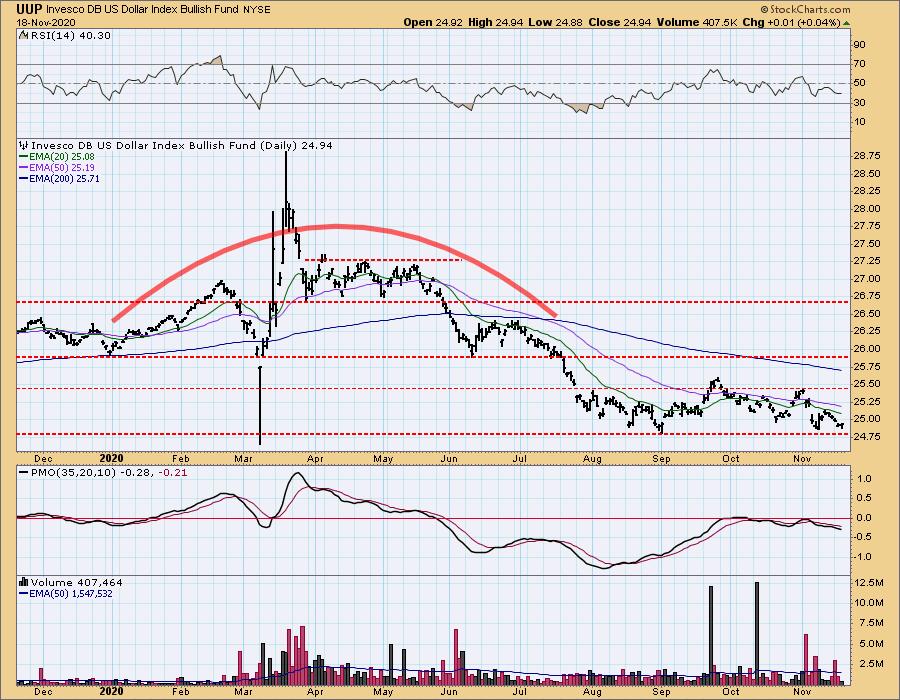
DOLLAR (UUP)
IT Trend Model: NEUTRAL as of 5/28/2020
LT Trend Model: SELL as of 7/10/2020
UUP Daily Chart: Yesterday's comments still apply:
"As expected, UUP is headed down to test support. The PMO is headed lower after topping twice at the zero line. The RSI is negative and not oversold so I'm expecting price to hit $24.75 before rising again."
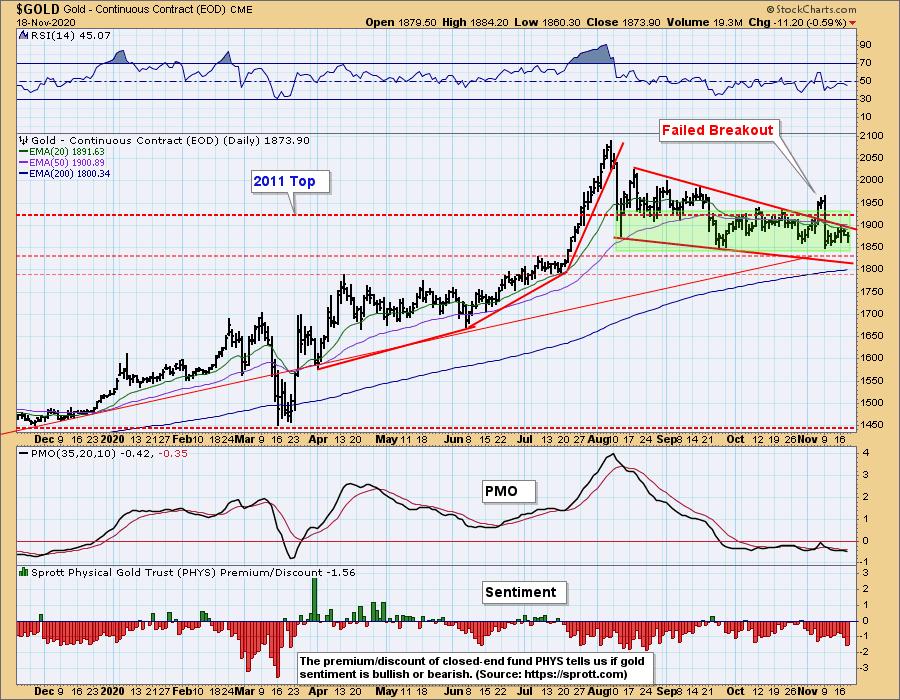
GOLD
IT Trend Model: NEUTRAL as of 10/13/2020
LT Trend Model: BUY as of 1/8/2019
GOLD Daily Chart: Speaking of trading channels... Gold remains in its channel, unable to break through the top of the bullish falling wedge nor able to break above the 20/50-EMAs. Discounts rose sharply today which is an expression of bearish sentiment. Sentiment being contrarian that is bullish for Gold. Bullish meaning we shouldn't see a breakdown. With the RSI and PMO turning lower, I suspect we will experience more of the same from Gold.
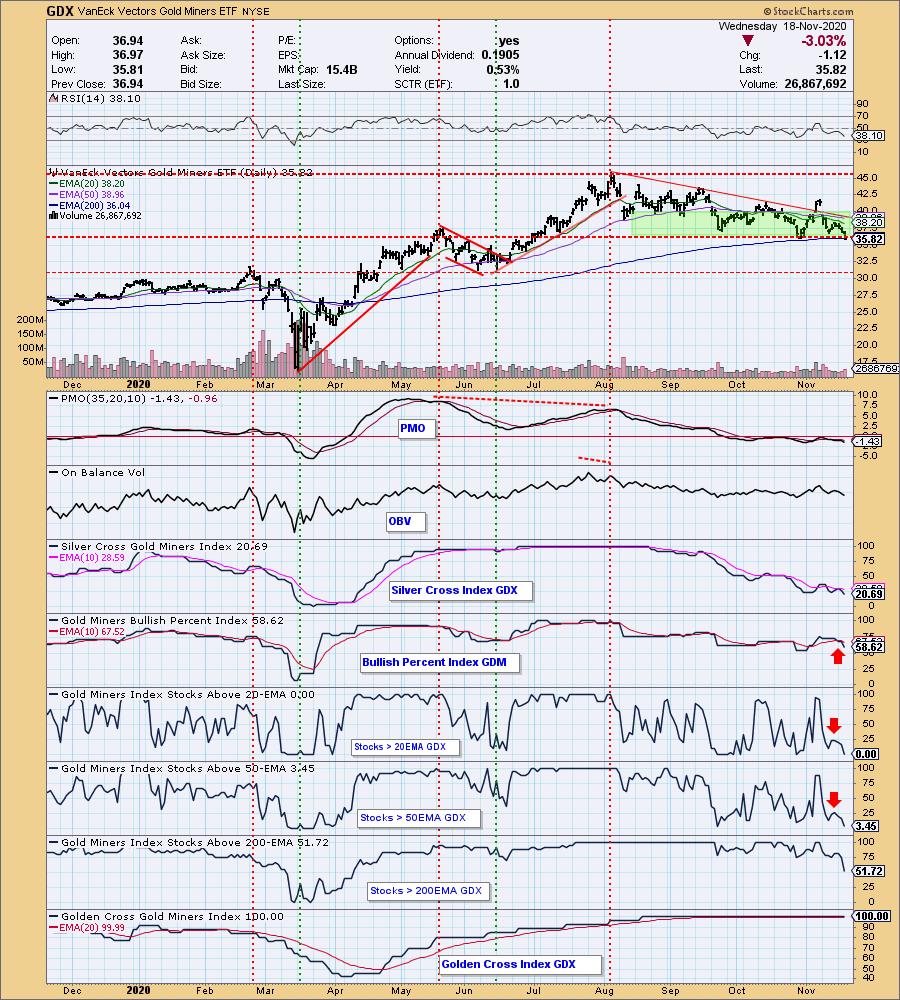
GOLD MINERS Golden and Silver Cross Indexes: Ugly day for the Miners... again. The 200-EMA did not hold today. The PMO topped below its signal line which is especially bearish. The RSI is negative and not oversold. The market in general is likely to decline. If Gold prices remain flat and the market turns, the Miners will see more decline and weakness. I am not selling my current miner position, but I will have my finger on the trigger if they fall further below the 200-EMA. We have very very oversold indicators right now, but the longer-term indicators could use some more decline. Miners are at a "decision point". This is the best spot for them to rebound, I just don't think the market environment is conducive to a rally for them right now.
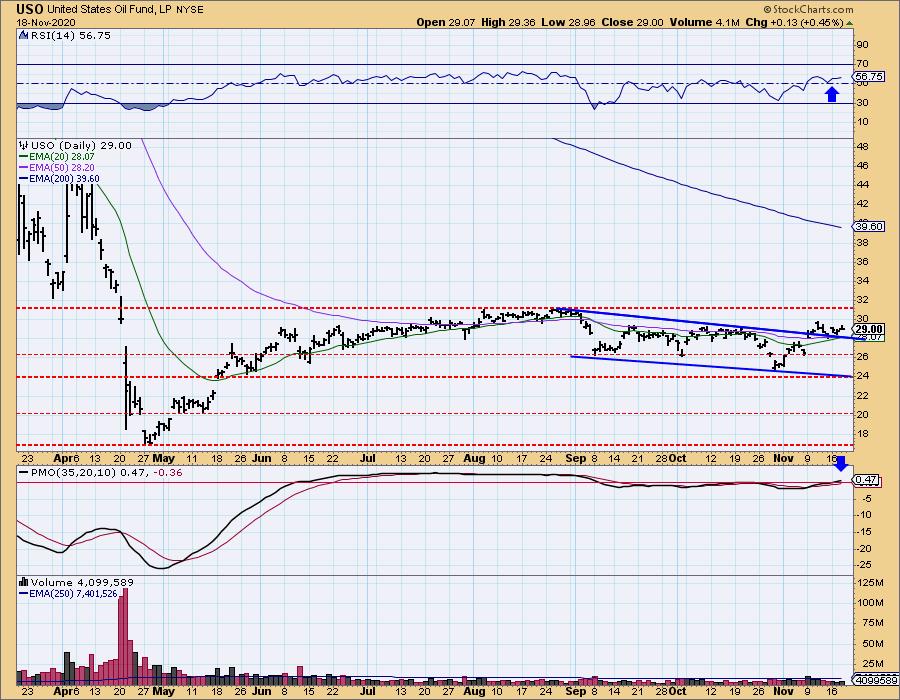
CRUDE OIL (USO)
IT Trend Model: SELL as of 9/8/2020
LT Trend Model: SELL as of 2/3/2020
USO Daily Chart: The 20-EMA didn't cross above the 50-EMA today, so we have to wait at least one more day for that "silver cross". Price is continuing to digest the rally off the October low. The RSI remains positive and the PMO is now positive and rising. I am looking for USO to continue higher and test the $31 level.
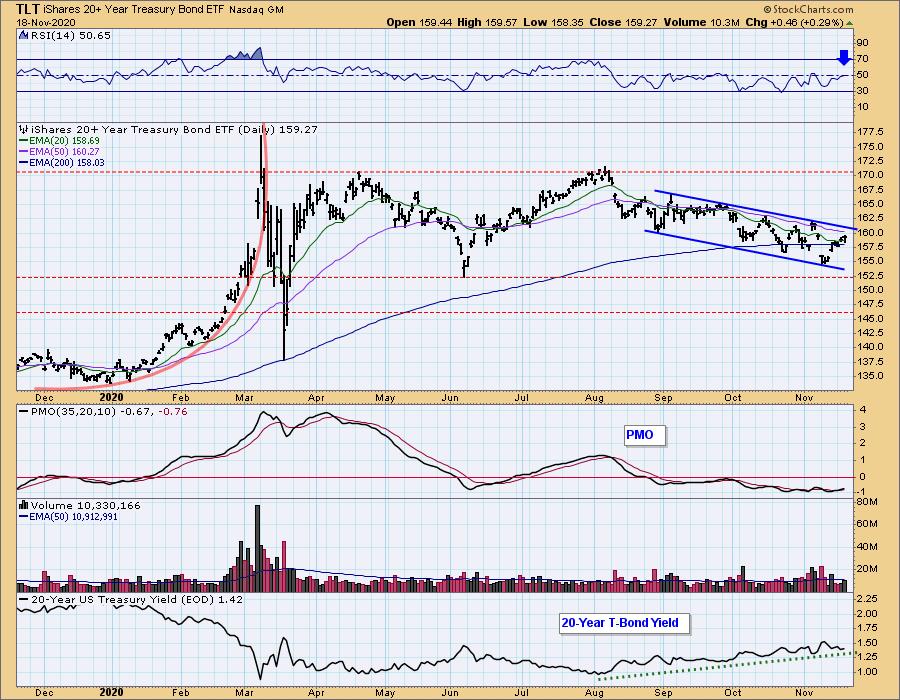
BONDS (TLT)
IT Trend Model: NEUTRAL as of 8/27/2020
LT Trend Model: BUY as of 1/2/2019
TLT Daily Chart: Overhead resistance is nearing at the top of the declining trend channel and more importantly, at the 50-EMA. Although Bonds are showing improvement, but yields are in a rising trend and that will make it very hard for Bonds to breakout.
Full Disclosure: I own TLT.
Technical Analysis is a windsock, not a crystal ball.
Happy Charting! - Erin
Disclaimer: This blog is for educational purposes only and should not be construed as financial advice. The ideas and strategies should never be used without first assessing your own personal and financial situation, or without consulting a financial professional. Any opinions expressed herein are solely those of the author, and do not in any way represent the views or opinions of any other person or entity.
NOTE: The signal status reported herein is based upon mechanical trading model signals, specifically, the DecisionPoint Trend Model. They define the implied bias of the price index based upon moving average relationships, but they do not necessarily call for a specific action. They are information flags that should prompt chart review. Further, they do not call for continuous buying or selling during the life of the signal. For example, a BUY signal will probably (but not necessarily) return the best results if action is taken soon after the signal is generated. Additional opportunities for buying may be found as price zigzags higher, but the trader must look for optimum entry points. Conversely, exit points to preserve gains (or minimize losses) may be evident before the model mechanically closes the signal.
Helpful DecisionPoint Links:
DecisionPoint Alert Chart List
DecisionPoint Golden Cross/Silver Cross Index Chart List
DecisionPoint Sector Chart List
Price Momentum Oscillator (PMO)
Swenlin Trading Oscillators (STO-B and STO-V)