
Today we will be discussing monthly charts in addition to the weekly charts. While we don't have "official" monthly closing charts, the analysis will carry over easily into Monday.
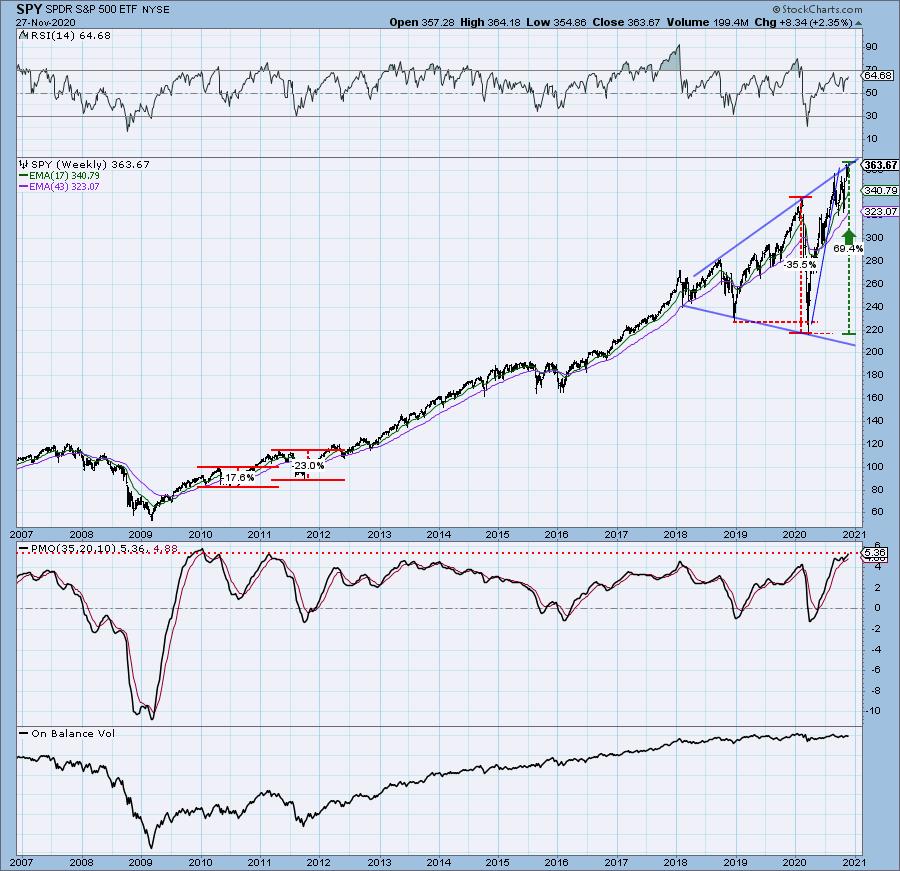
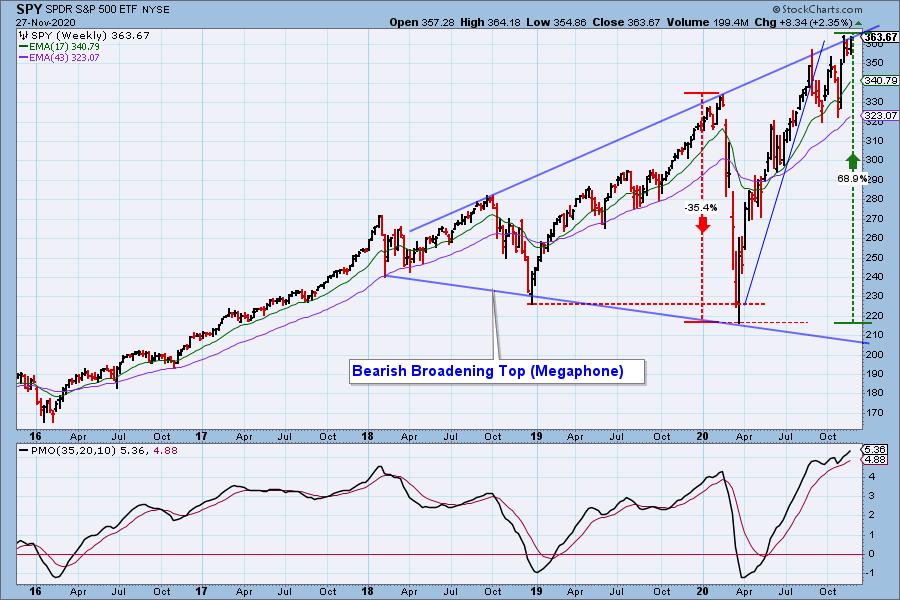
We decided to lead with the SPY weekly chart. A subscriber wrote to us that the weekly PMO is more overbought than we have seen in the past seven years. In fact, if you look back further, we have not seen a PMO this overbought since 2010/2011! Let's see what the damage was on the declines following those overbought readings. They were painful, but not as painful as March of this year. These overbought conditions need to be cleared. Until those conditions are relieved, the market is highly vulnerable in the intermediate term. That's not good given our intermediate-term indicators are extremely overbought.
The DecisionPoint Alert Weekly Wrap presents an end-of-week assessment of the trend and condition of the Stock Market, the U.S. Dollar, Gold, Crude Oil, and Bonds. The DecisionPoint Alert daily report (Monday through Thursday) is abbreviated and gives updates on the Weekly Wrap assessments.
Watch the latest episode of DecisionPoint on StockCharts TV's YouTube channel here!
MAJOR MARKET INDEXES
For Friday: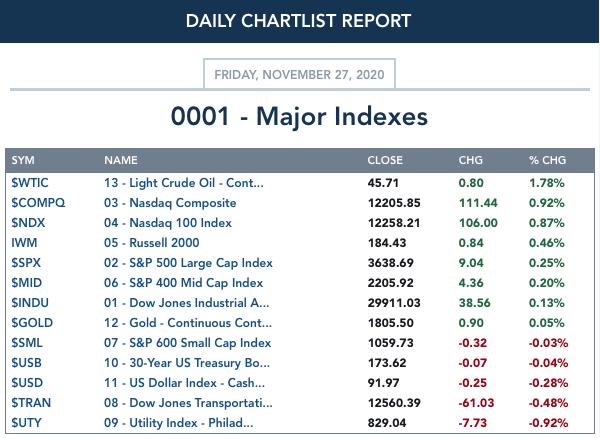
For the week: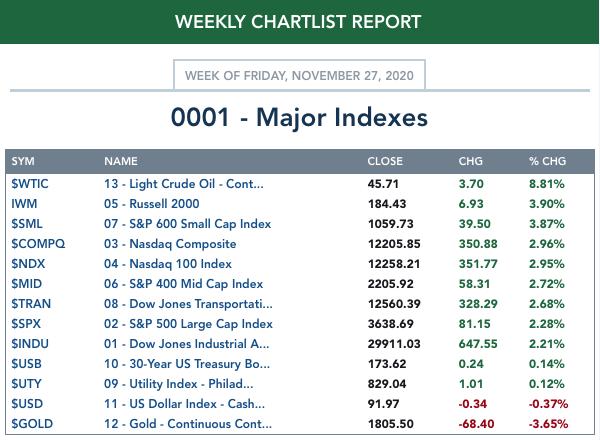
SECTORS
Each S&P 500 Index component stock is assigned to one, and only one, of 11 major sectors. This is a snapshot of the Intermediate-Term (Silver Cross) and Long-Term (Golden Cross) Trend Model signal status for those sectors.
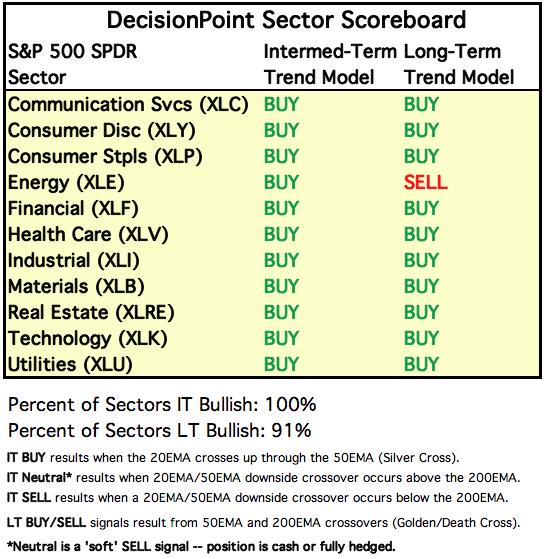
For Friday: 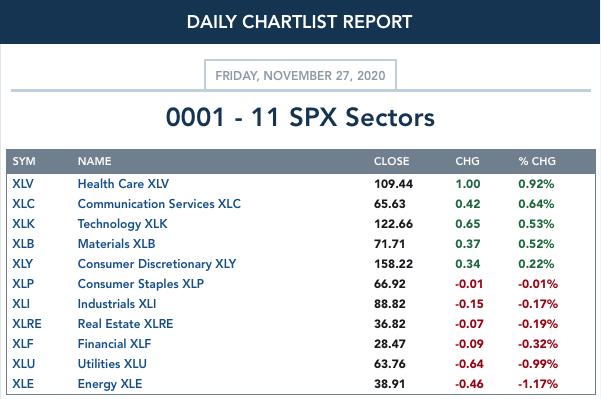
For the week: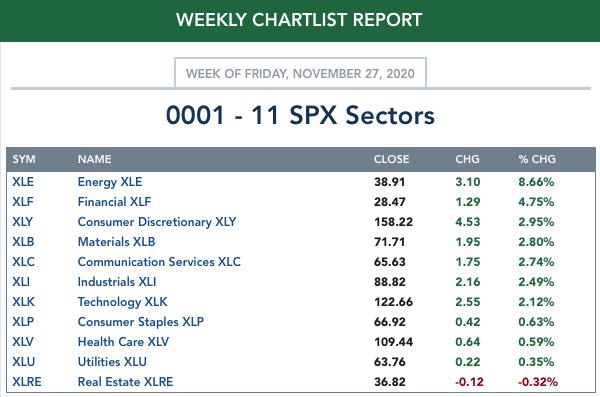
CLICK HERE for Carl's annotated Sector charts.
THE MARKET (S&P 500)
IT Trend Model: BUY as of 5/8/2020
LT Trend Model: BUY as of 6/8/2020
SPY Daily Chart: The 5-month candlestick chart shows the development of a bullish ascending triangle. Total volume was very low which makes sense given the trading day was halved and it happens to be the day after Thanksgiving. We won't read too much into volume patterns today. The PMO is rising.
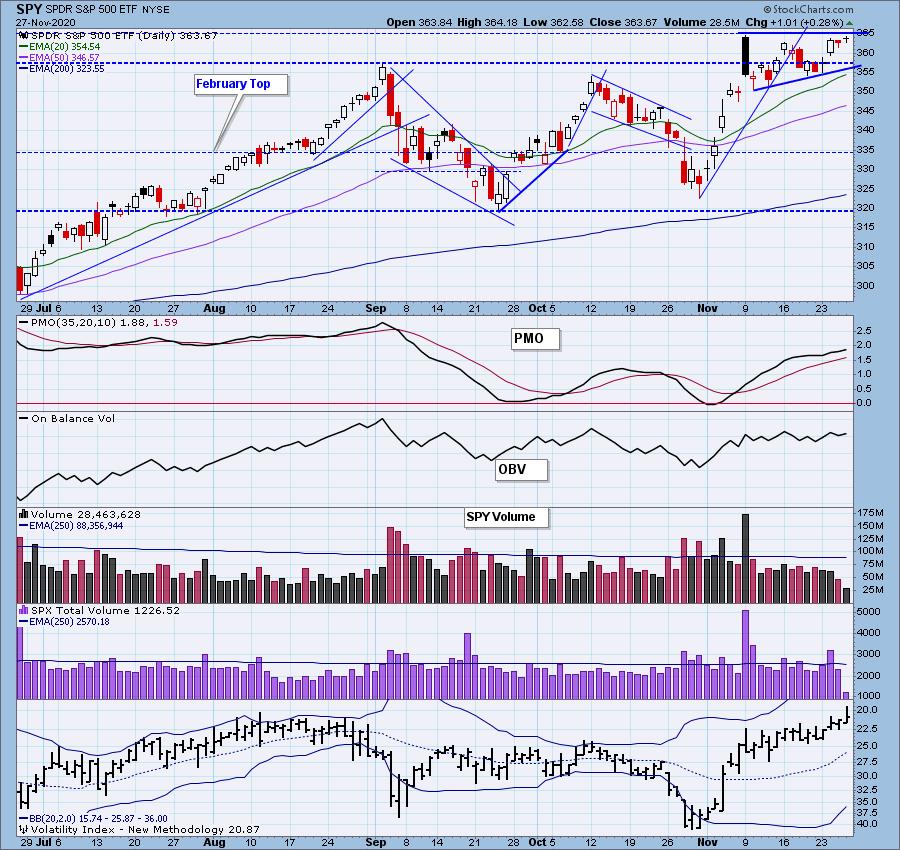
The RSI remains positive and not overbought on the 1-year daily chart. As noted above, the PMO is rising which is bullish short term.
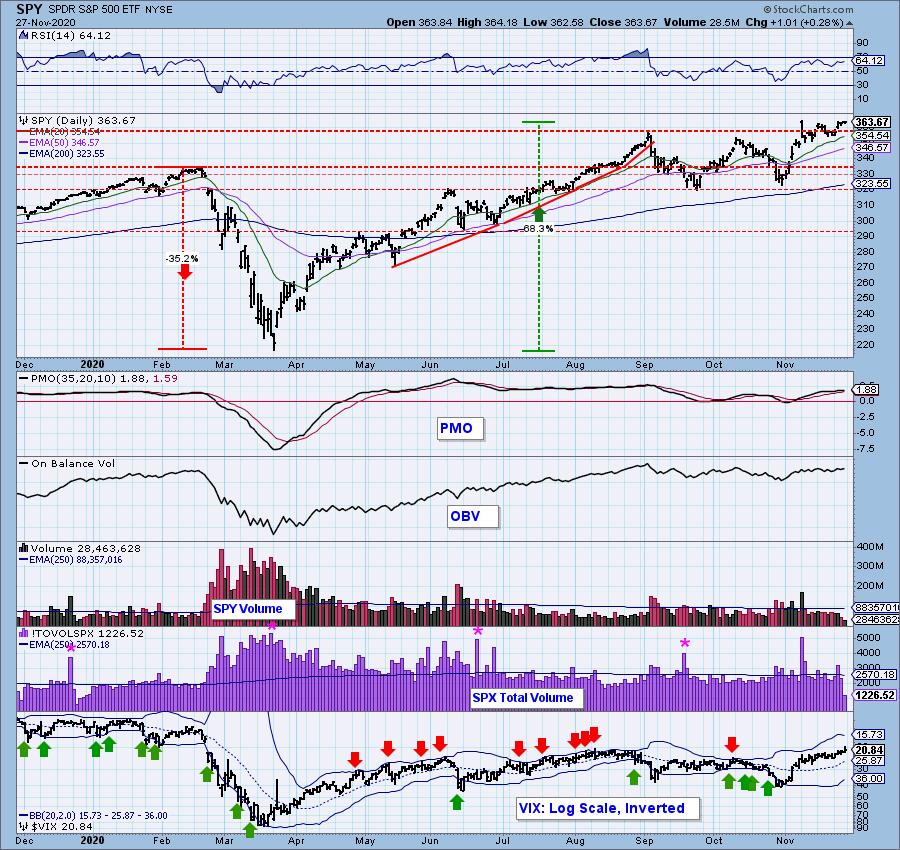
SPY Weekly Chart: We looked at the weekly chart in the opening paragraph, but I do want to point out that the PMO has bottomed twice above its signal line which is especially bullish. However, we do have extremely overbought conditions on the PMO. Price is at the top of this "megaphone" which suggests a longer-term decline ahead unless we get a decisive 3%+ breakout from the pattern that could nullify it. But again, with the PMO this overbought, it could be hard to maintain a breakout.
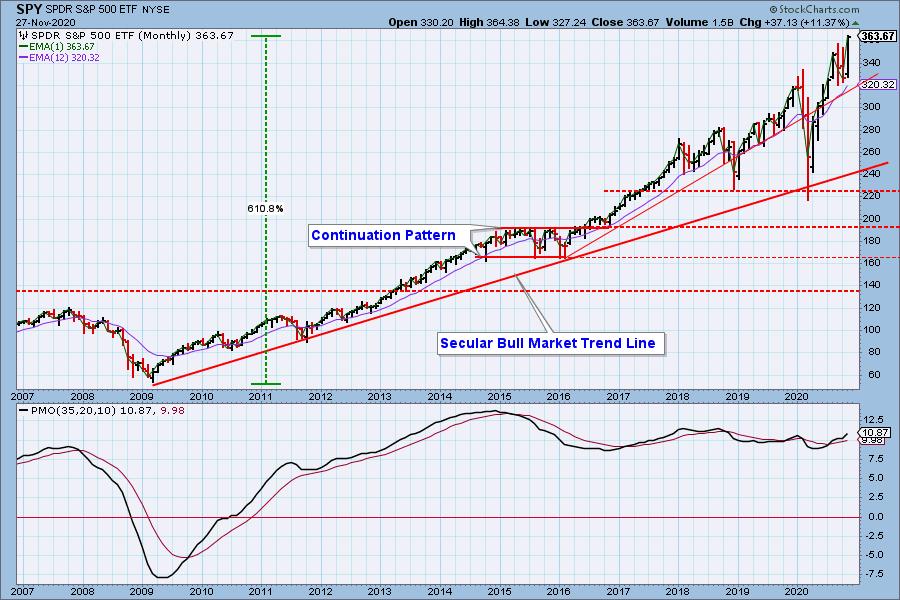
S&P 500 Monthly Chart: The monthly PMO remains on a BUY signal. We had an 11%+ gain on the SPY this month which set new all-time highs. Note that the monthly PMO isn't nearly as overbought as the weekly PMO, but it is in the same area it was before the 2020 bear market.
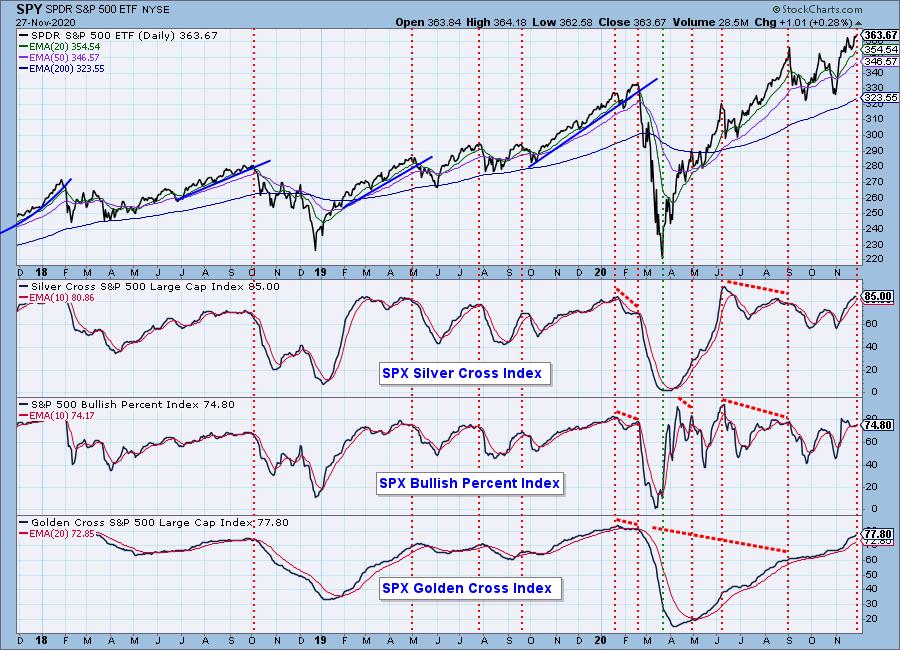
Participation: The following chart uses different methodologies for objectively showing the depth and trend of participation for intermediate- and long-term time frames.
- The Silver Cross Index (SCI) shows the percentage of SPX stocks on IT Trend Model BUY signals (20-EMA > 50-EMA).
- The Golden Cross Index (GCI) shows the percentage of SPX stocks on LT Trend Model BUY signals (50-EMA > 200-EMA).
- The Bullish Percent Index (BPI) shows the percentage of SPX stocks on Point & Figure BUY signals.
We aren't seeing negative divergences on these indicators, but they are overbought.
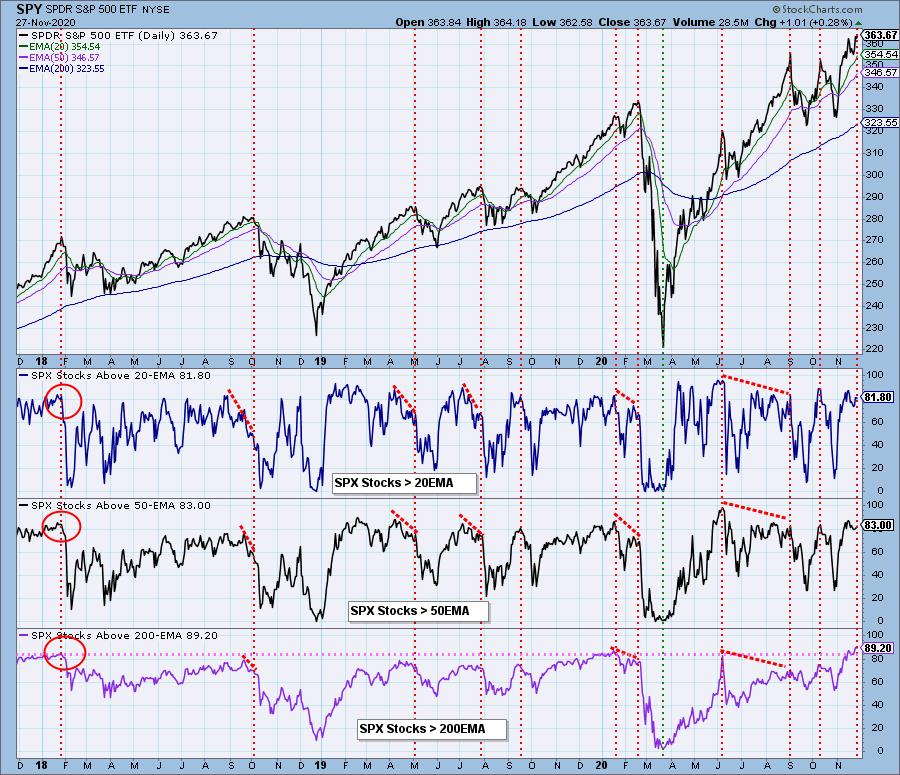
We didn't see much movement on these indicators this week. They are overbought in all three timeframes, but currently rising. These shorter-term indicators while overbought, still have head room to move higher. The long-term %Stocks Above 200-EMA is extremely overbought and has hit levels higher than we have seen in three years.
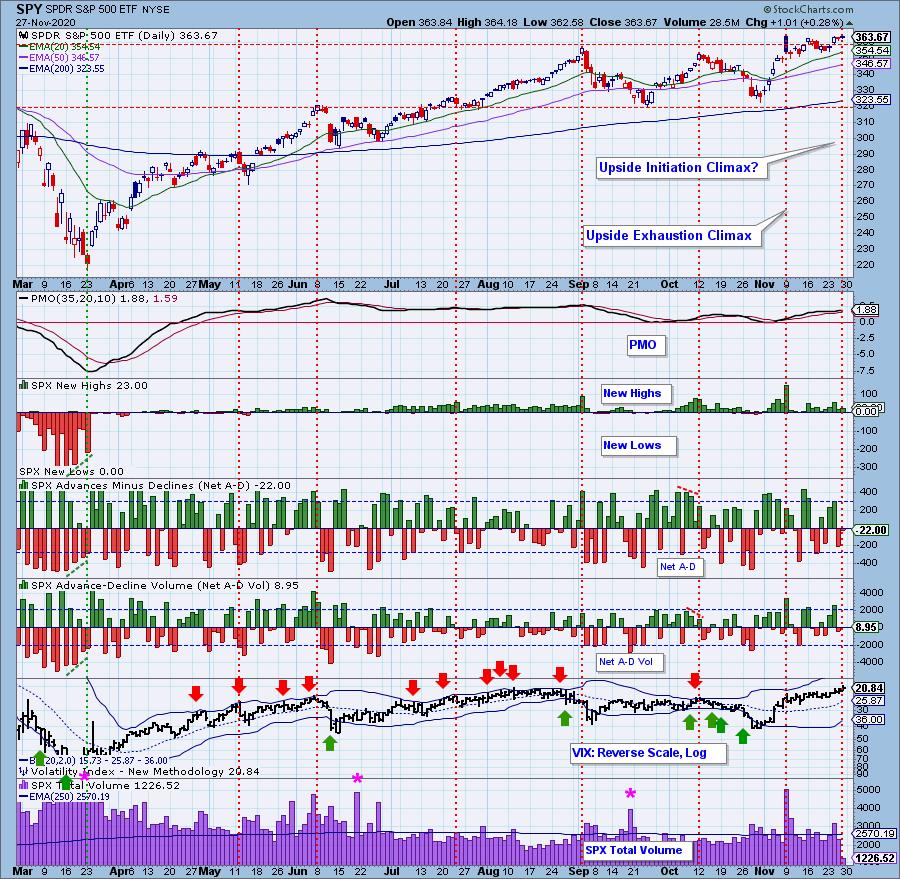
Climactic Market Indicators: We wouldn't expect climactic readings today so no surprise here. We would like to point out the buying initiation that appeared on Tuesday. While the market was steady Wednesday, we got a small breakout today. The VIX continues to move toward the upper Bollinger Band on the inverted scale as market participants continue to feel bullish. Until it hits that upper Band, its position above the EMA short-term internal strength.
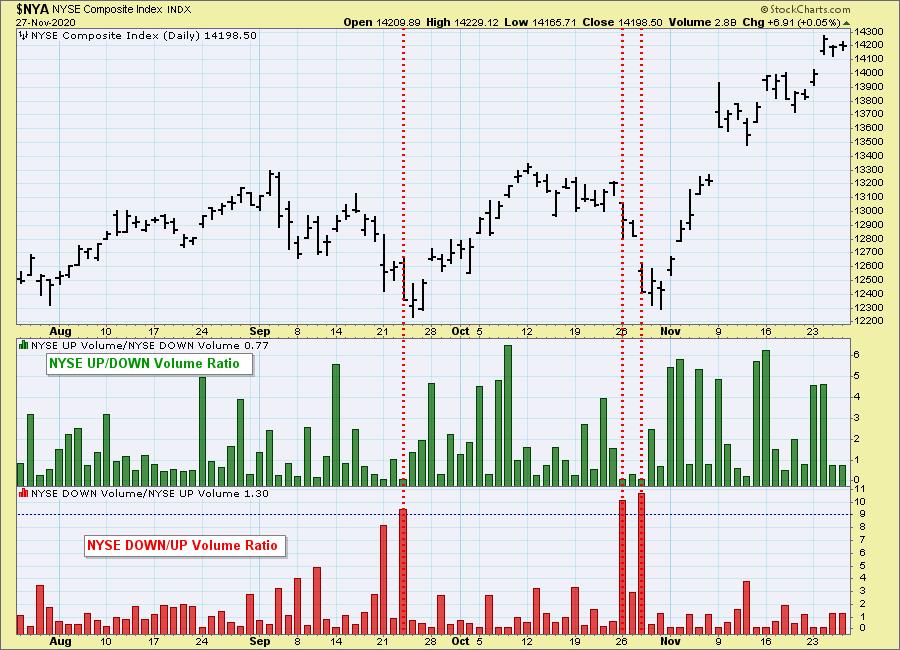
NYSE Up/Down and Down/Up volume ratios can be also be used as climax detectors. We use the 9:1 ratio suggested by the late Dr. Martin Zweig in his book, Winning on Wall Street. These climaxes happen less frequently than those on the chart above, and they can be used to clarify a particular event. We have an NYSE and S&P 500 version of the ratios, and normally they will only be published when there is a climax ratio.
No climactic readings on the NYSE volume ratios this week.
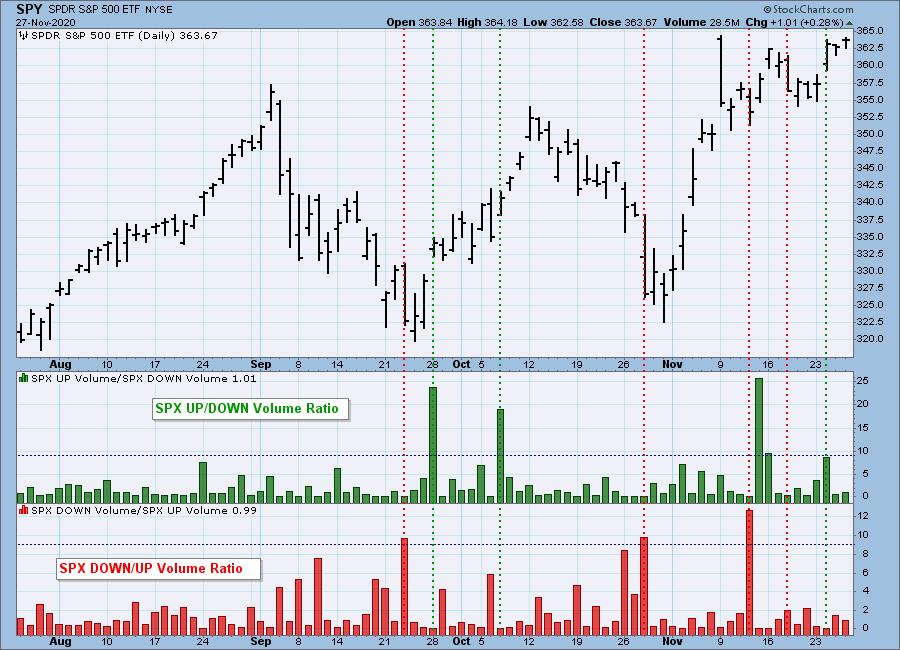
The S&P 500 version can get different results than the NYSE version because: (a) there are only 500 stocks versus a few thousand; and (b) those 500 stocks are all large-cap stocks that tend to move with more uniformity.
In the case of the SPX volume ratios, we nearly had a confirmation of the Wednesday buying initiation climax when the UP/DOWN volume reading was close to 9.0.
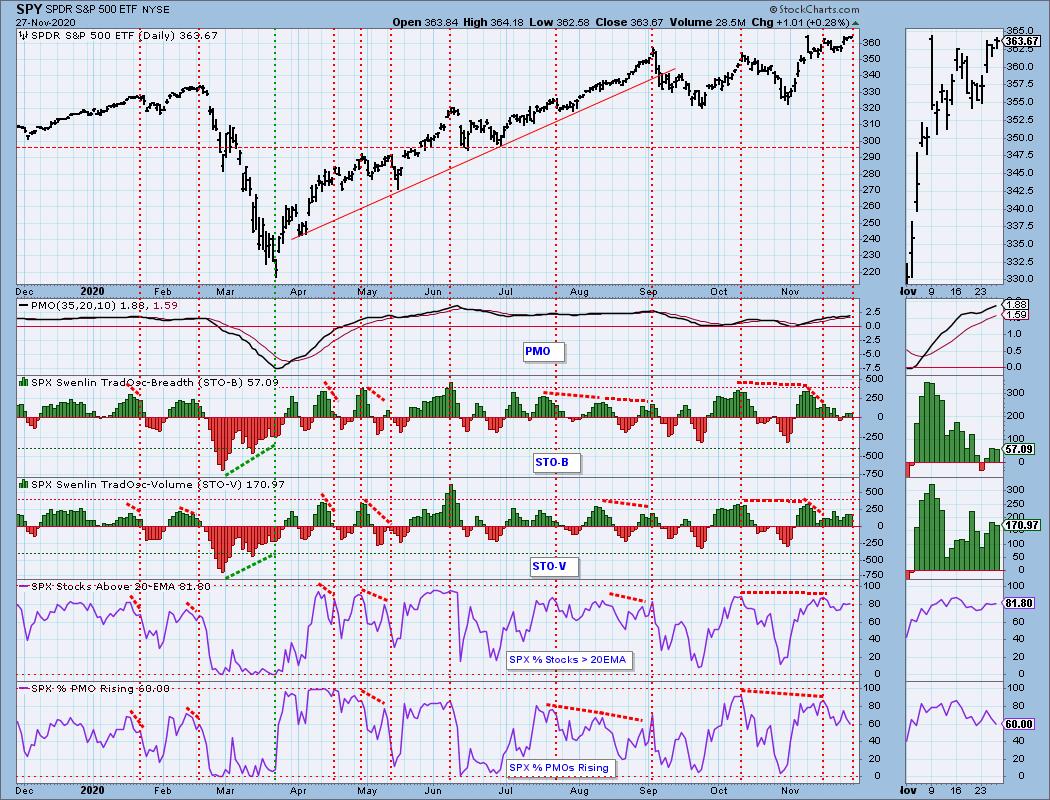
Short-Term Market Indicators: The short-term market trend is UP and the condition is NEUTRAL.
We would've expected to see higher STO readings on a positive trading day. They pulled back very slightly. It usually means a downside reversal, but the other short-term indicators are still strong and not that overbought if at all.
Intermediate-Term Market Indicators: The intermediate-term market trend is UP and the condition is OVERBOUGHT. The market bias is BULLISH.
These indicators rose today. They are overbought, but not extremely so. The %PMO Crossover BUY signals has a negative divergence, but so far it is maintaining above its signal line.
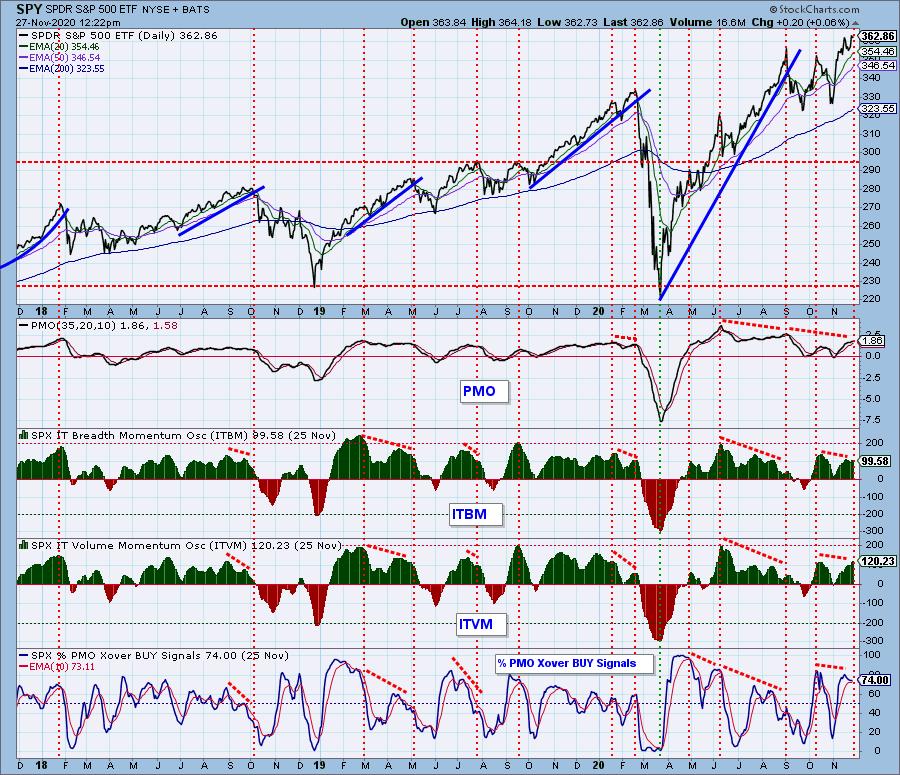
CONCLUSION: Overall the bias remains bullish in all timeframes. The STOs have reversed slightly but overall the short-term still looks bullish, albeit a bit overbought. The intermediate term is the biggest problem. Price is butting up against the top of the bearish megaphone pattern on the weekly chart and that is accompanied by overbought to extremely overbought indicators. The bias is very bullish in all timeframes for the SPX and overbought conditions typically persist as price continues to move higher. However, those conditions need to be relieved at some point. One thing to keep in mind is that overbought indicators can decompress with consolidation; it doesn't take a big decline or pullback to clear those conditions. We remain bullish in the short term timeframe with concern about overbought conditions in the intermediate term that leave the market vulnerable to a decline.
Have you subscribed the DecisionPoint Diamonds yet? DP does the work for you by providing handpicked stocks/ETFs from exclusive DP scans! Add it with a discount! Contact support@decisionpoint.com for more information!
INTEREST RATES
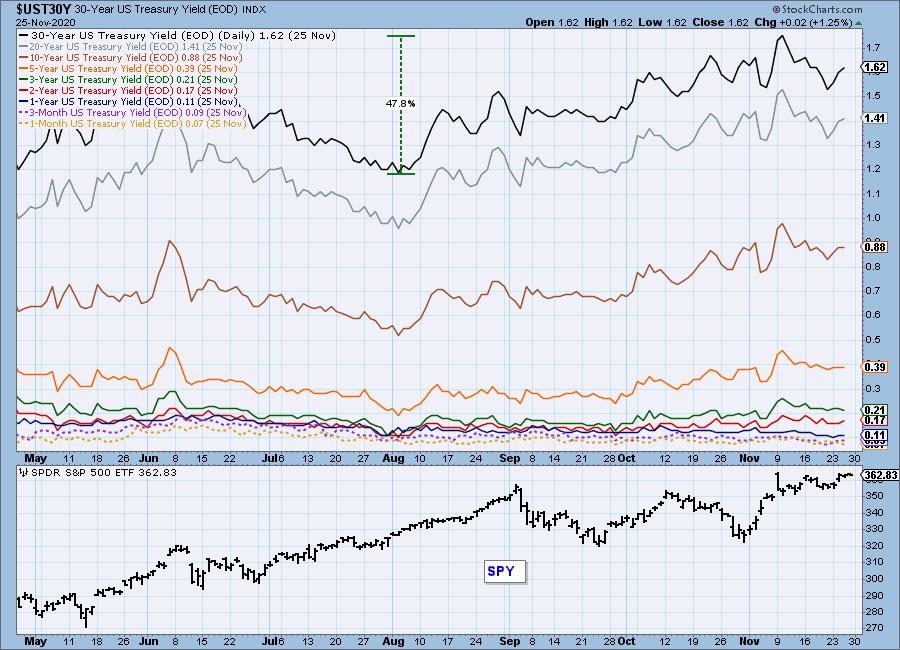
This chart is included so we can monitor rate inversions. In normal circumstances the longer money is borrowed the higher the interest rate that must be paid. When rates are inverted, the reverse is true.
The bond market was closed on 11/27, so the yield readings will be dated 11/25.
DOLLAR (UUP)
IT Trend Model: NEUTRAL as of 5/28/2020
LT Trend Model: SELL as of 7/10/2020
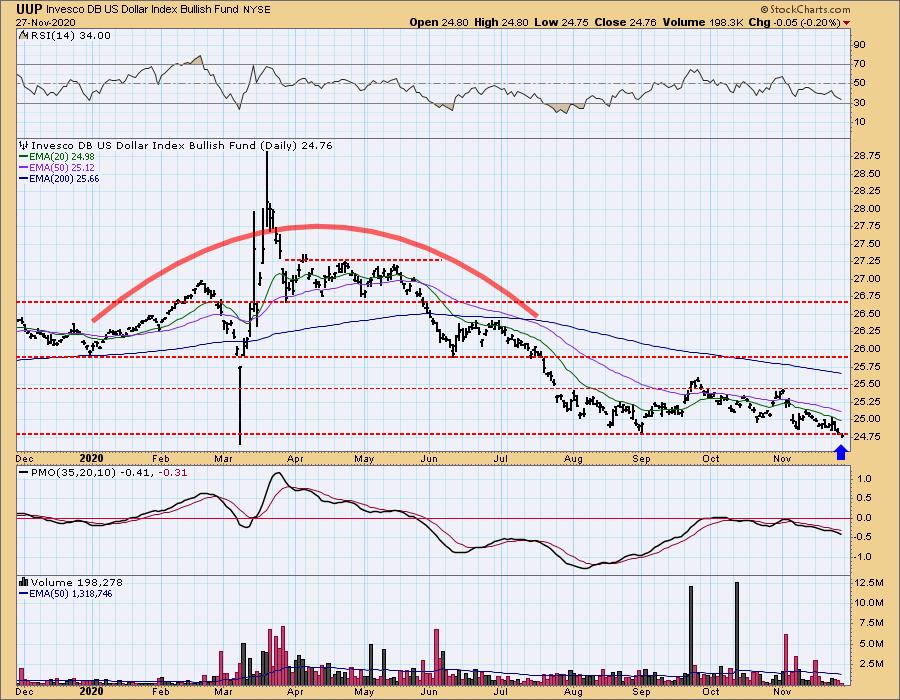
UUP Daily Chart: $24.75 is the support level to watch. Price poked down to test it today with the low at exactly $24.75. Given the very negative RSI and PMO, we expect it to fail a test the March "Pinocchio" bar low.
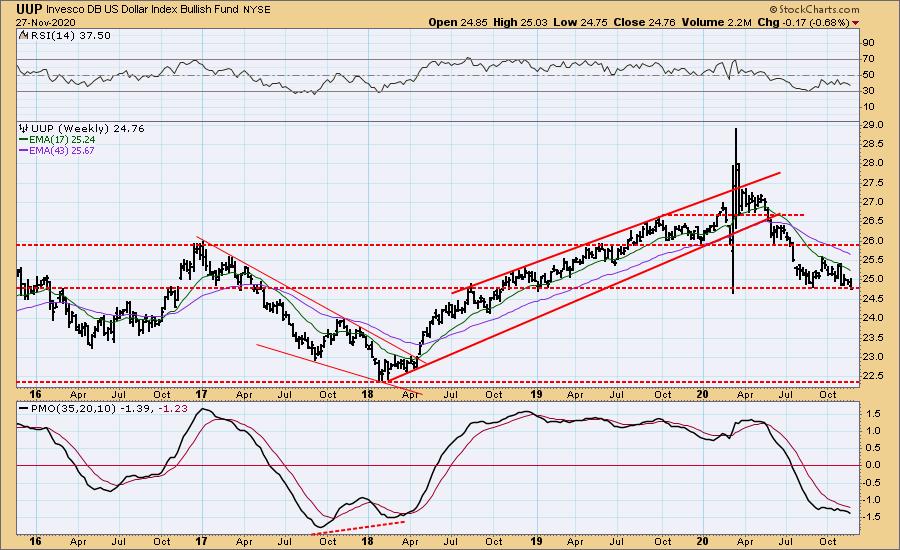
UUP Weekly Chart: The weekly chart RSI and PMO look every bit as ugly as they do on the daily. The weekly PMO is oversold which is positive and if price is able to rise off this support level, it would form a bullish double-bottom. It's too early to call it, but certainly something to watch.
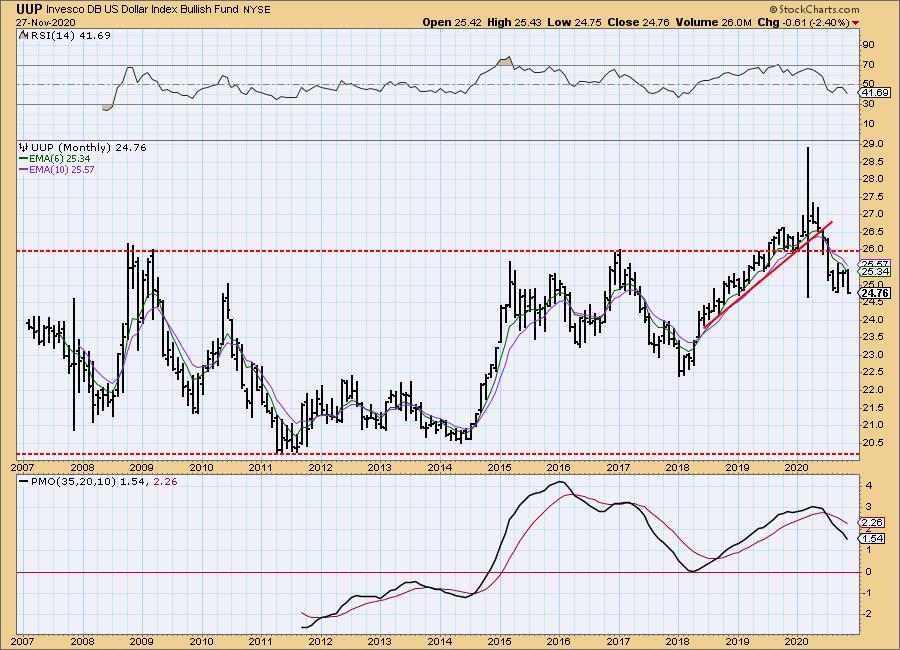
UUP Monthly Chart: The monthly RSI and PMO also don't inspire confidence. Overall the Dollar looks bearish in all timeframes.
GOLD
IT Trend Model: NEUTRAL as of 10/14/2020
LT Trend Model: BUY as of 1/8/2019
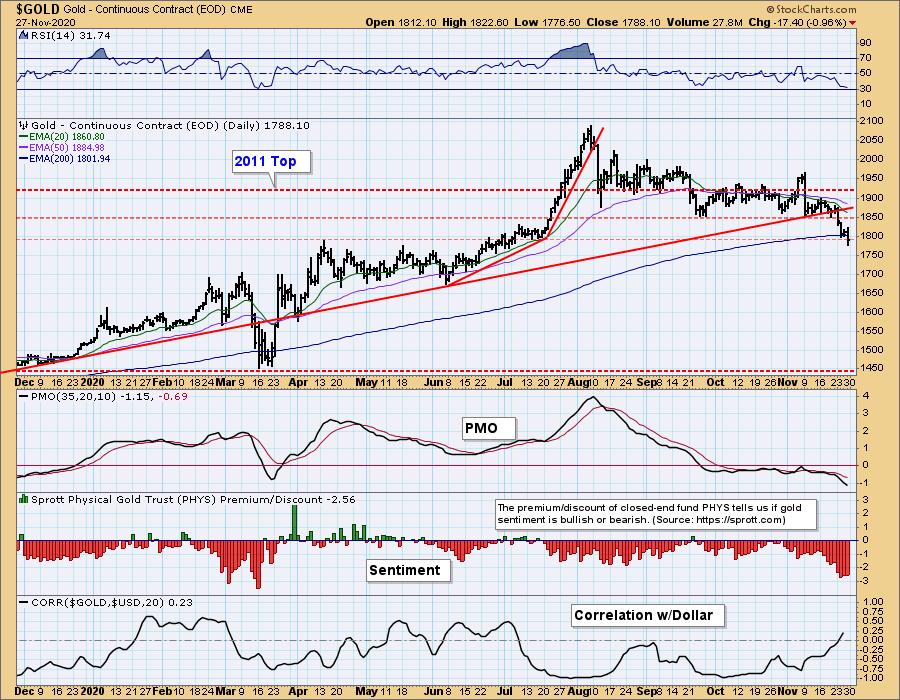
GOLD Daily Chart: A weak Dollar usually translates to higher Gold prices, but you can see that the correlation between Gold and the Dollar is moving outside of the norm and is starting to a positive correlation. Currently we see a correlation near zero which basically means they aren't tied to each other at all right now. Discounts remain very high which is bullish for Gold. However, seeing the breakdown this week accompanied by a very negative RSI and PMO, a further decline to take price to $1700 is conceivable.
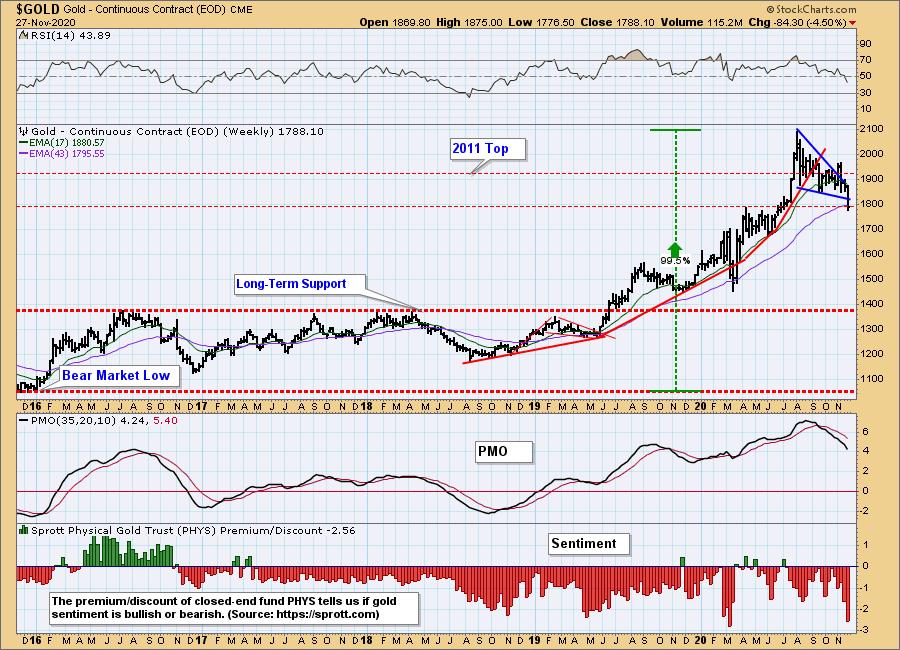
GOLD Weekly Chart: The breakdown on the weekly chart is substantial and the RSI and PMO are very negative as they continue to fall out of overbought territory. Again high discounts usually signal an upside reversal and Gold is now just below the 43-week EMA. This is a good reversal point, but the PMO is accelerating downward with he RSI so expectation is low that Gold is going to reverse now.
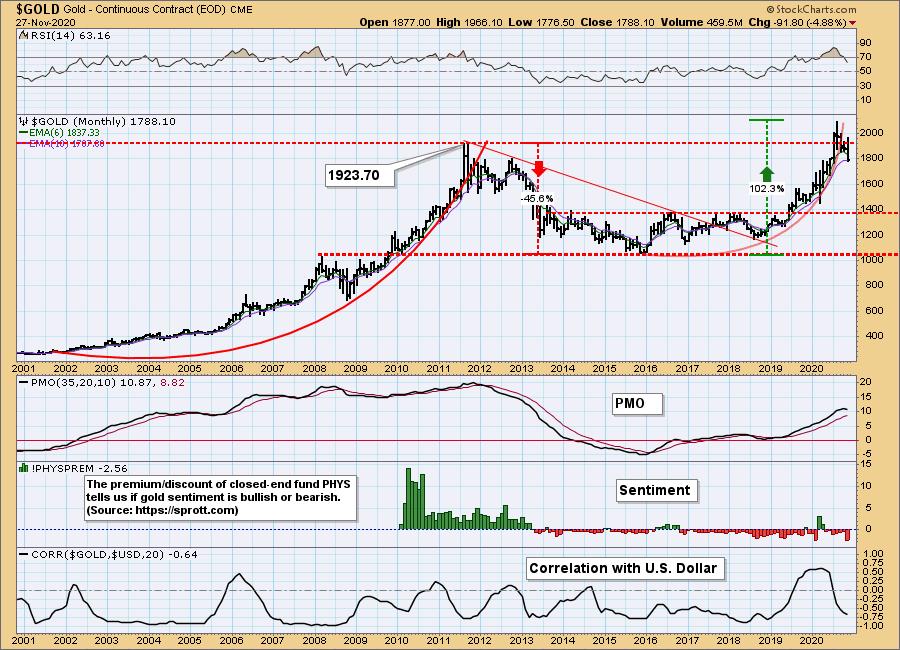
GOLD Monthly Chart: The monthly chart isn't quite as negative, but the PMO is turning over right now. Price is perched atop the 10-month EMA and the RSI has moved out of overbought territory. The breakdown from the parabolic rally of 2019 and 2020 is occurring now. Typically a parabolic breakdown will lead to a quick and painful drop to the original basing pattern. Gold is still vulnerable in all timeframes for further decline.
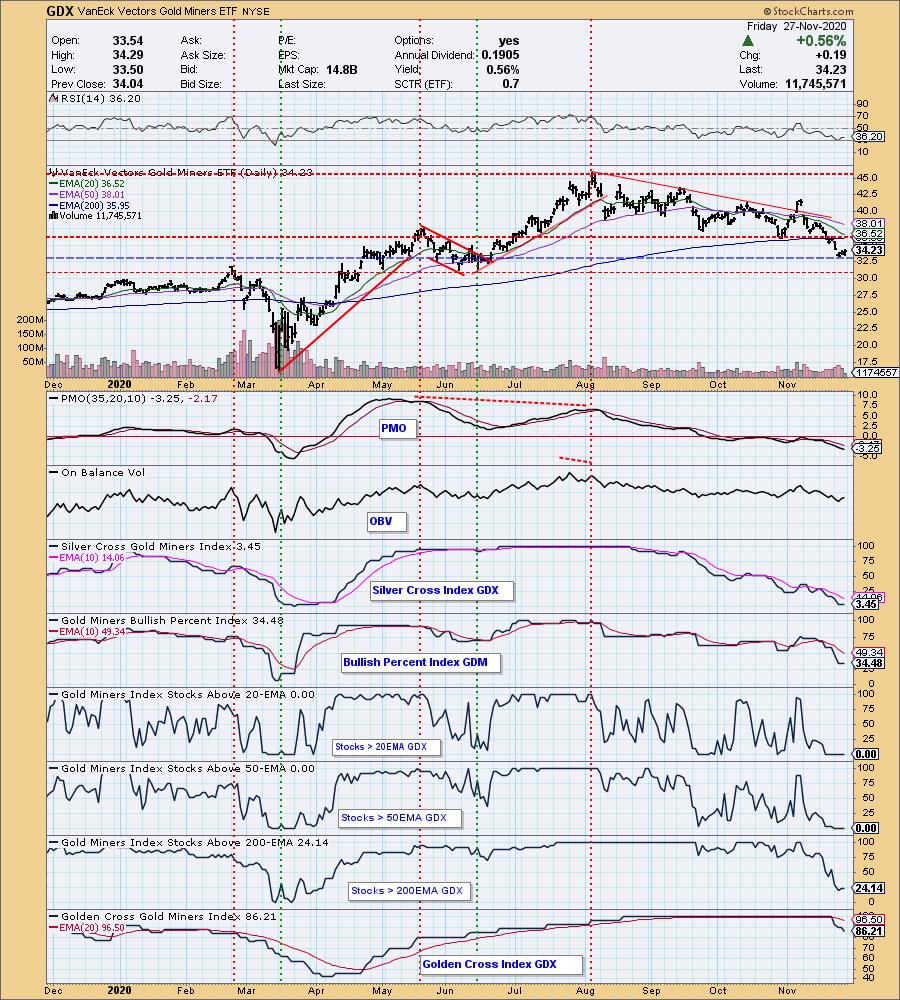
GOLD MINERS Golden and Silver Cross Indexes: Miners are making an attempt to reverse. While indicators are very oversold, this isn't a strong support level given few if any "touches" on the current support level (blue dashed line) at this week's low. It's time for Miners to reverse given those very oversold indicators, but the PMO tells us that momentum is still negative.
CRUDE OIL (USO)
IT Trend Model: BUY as of 10/20/2020
LT Trend Model: SELL as of 2/3/2020
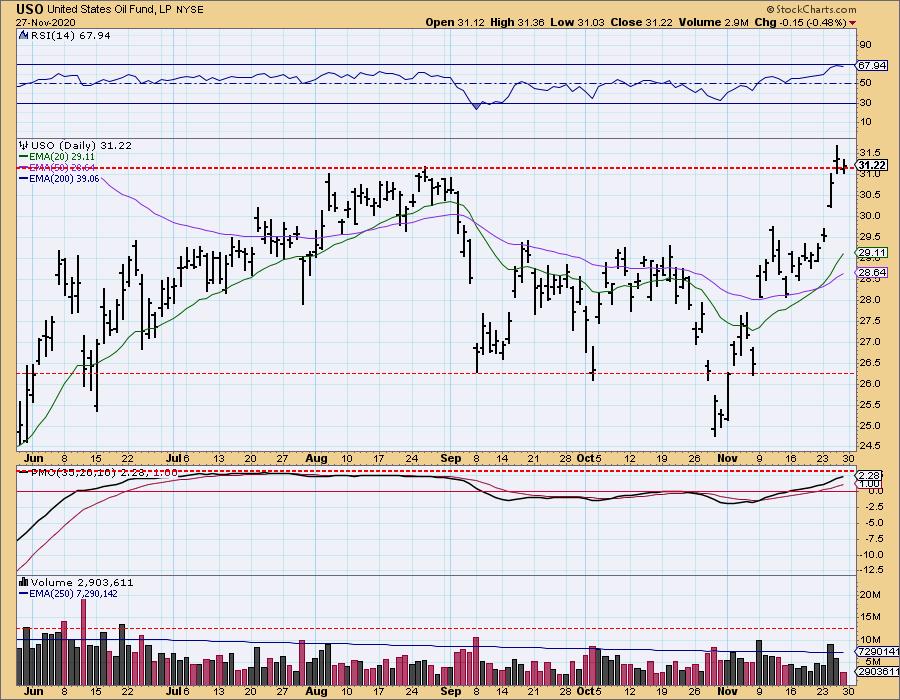
USO Daily Chart: Oil pulled back today after this week's spectacular follow-through on the rally that began off the 50-EMA this month. The RSI and PMO remain positive. We would expect a pause to digest the recent breakaway rally.
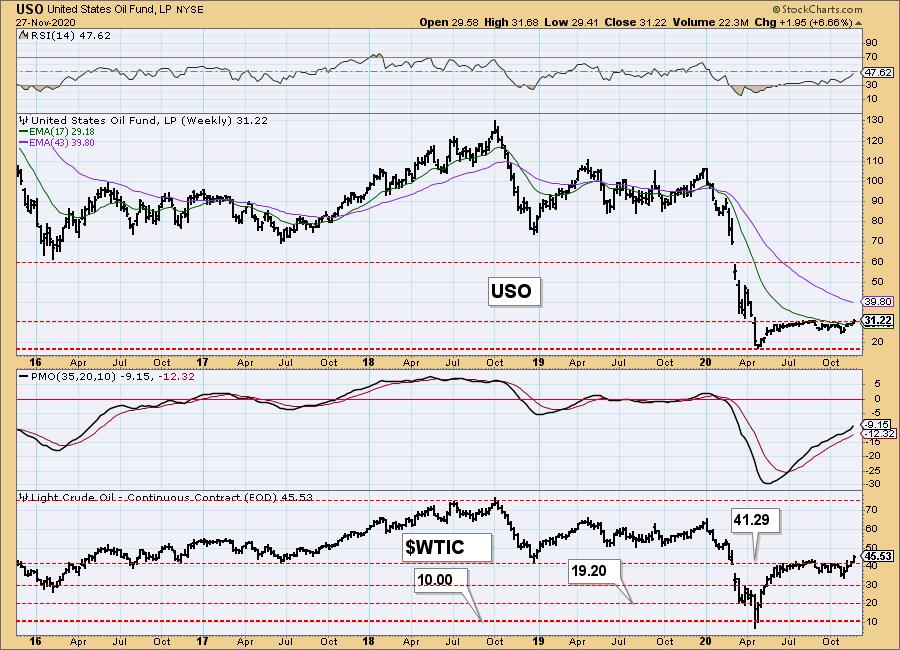
USO/$WTIC Weekly Chart: The weekly chart shows a negative RSI, but it is gaining ground and should reach positive territory above net neutral (50) soon. The PMO is rising and accelerating upward out of very oversold territory. $WTIC saw a stronger breakout and traded and closed above support.
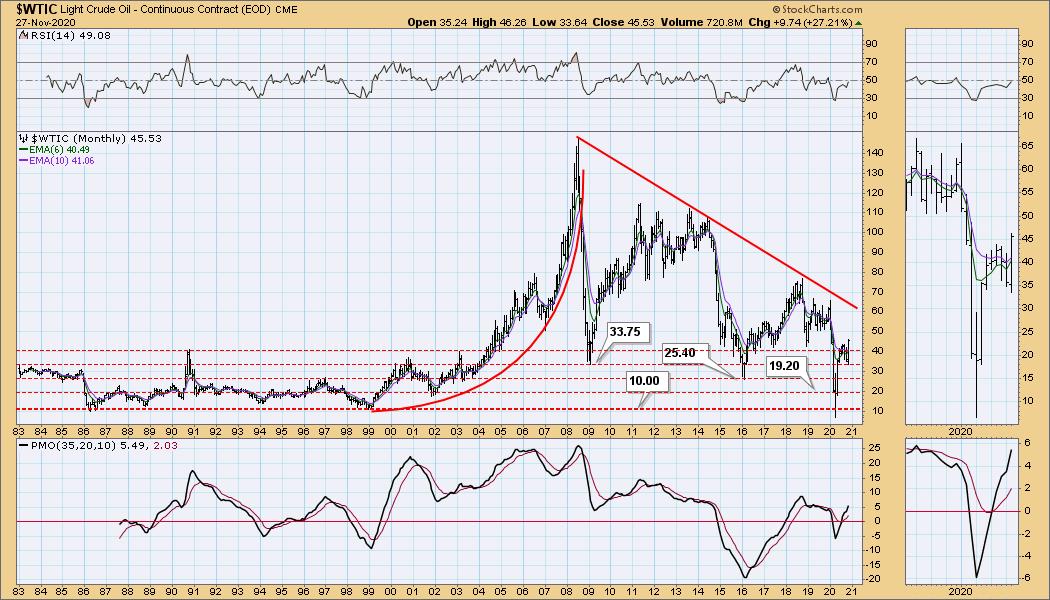
$WTIC Monthly Chart: Positive monthly chart with a rising RSI that is nearly in positive territory and a rising PMO that is positive and not overbought. The outlook is bullish in all timeframes for Oil.
BONDS (TLT)
IT Trend Model: NEUTRAL as of 8/27/2020
LT Trend Model: BUY as of 1/2/2019
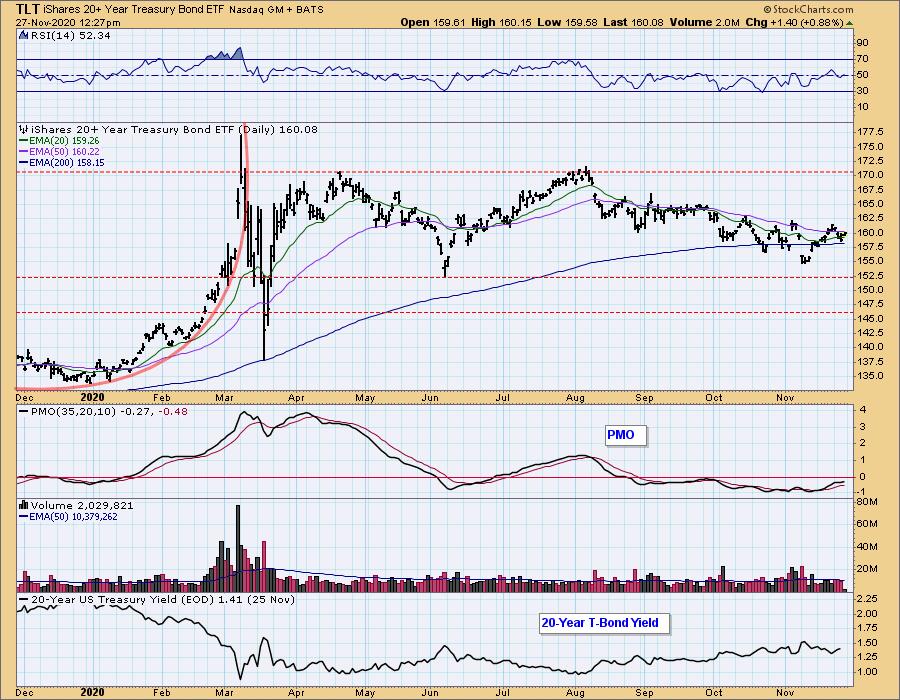
TLT Daily Chart: The yield window is showing 11/25 because the bond markets were closed today. TLT has a positive RSI and a now rising oversold PMO. Price continues to push against the 50-EMA. While the chart is positive, a breakout above that EMA would greatly improve this chart.
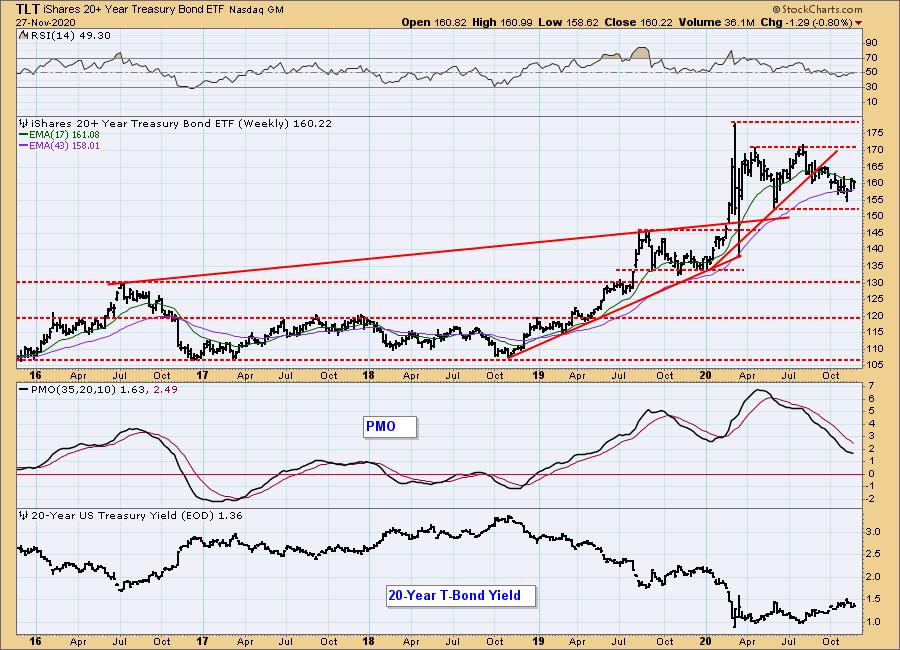
TLT Weekly Chart: We are seeing an improved weekly chart with a decelerating PMO and an RSI that is just about ready to enter positive territory. The 17-week EMA is posing resistance.
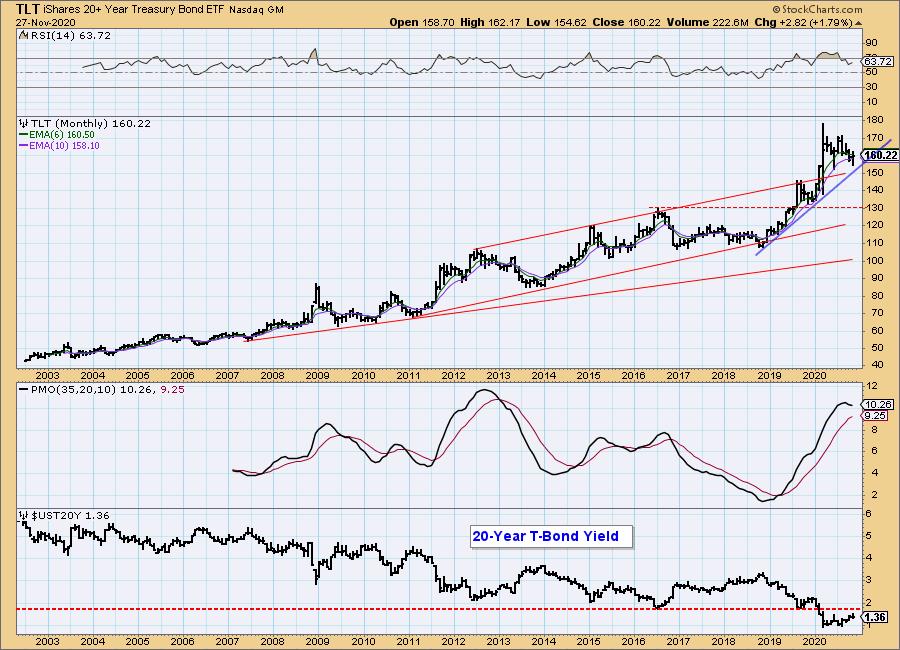
TLT Monthly Chart: The monthly chart is showing deterioration as the monthly PMO has topped. However, the RSI is positive and the PMO has decelerated. The rising trend is still intact, but price may need to test that rising bottoms trendline before reversing. Bonds are at a reversal point and all timeframes are beginning to look more bullish.
Technical Analysis is a windsock, not a crystal ball.
-- Carl and Erin Swenlin
___________
Our job is not to see the future, it is to see the present very clearly.
-- Jawad Mian, stray-reflections.com
Disclaimer: This blog is for educational purposes only and should not be construed as financial advice. The ideas and strategies should never be used without first assessing your own personal and financial situation, or without consulting a financial professional. Any opinions expressed herein are solely those of the author, and do not in any way represent the views or opinions of any other person or entity.
NOTE: The signal status reported herein is based upon mechanical trading model signals, specifically, the DecisionPoint Trend Model. They define the implied bias of the price index based upon moving average relationships, but they do not necessarily call for a specific action. They are information flags that should prompt chart review. Further, they do not call for continuous buying or selling during the life of the signal. For example, a BUY signal will probably (but not necessarily) return the best results if action is taken soon after the signal is generated. Additional opportunities for buying may be found as price zigzags higher, but the trader must look for optimum entry points. Conversely, exit points to preserve gains (or minimize losses) may be evident before the model mechanically closes the signal.
Helpful DecisionPoint Links:
DecisionPoint Alert Chart List
DecisionPoint Golden Cross/Silver Cross Index Chart List
DecisionPoint Sector Chart List
Price Momentum Oscillator (PMO)
Swenlin Trading Oscillators (STO-B and STO-V)
DecisionPoint is not a registered investment advisor. Investment and trading decisions are solely your responsibility. DecisionPoint newsletters, blogs or website materials should NOT be interpreted as a recommendation or solicitation to buy or sell any security or to take any specific action.
