
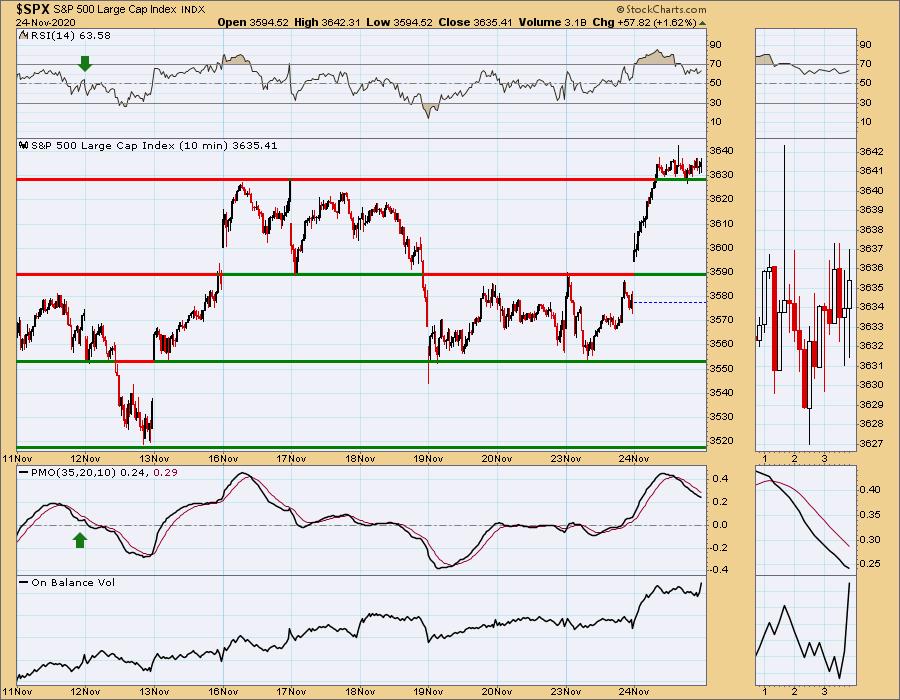
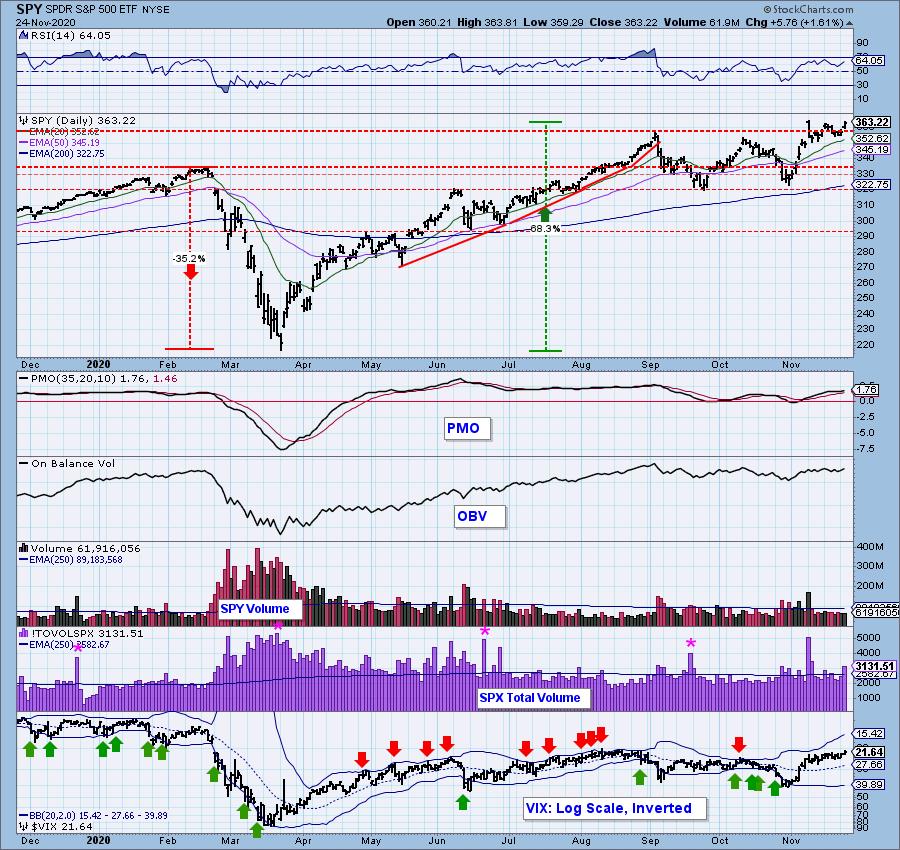
Despite this being a "holiday trading" week, the market and its participants haven't left for vacation yet. We had a high volume rally day. The intraday chart on the SPX displays the big rally experienced in the morning that brought price above overhead resistance where it then consolidated the gain. While that happened, the PMO triggered a SELL signal and is moving lower. Remember, when there is no acceleration, the PMO will tend toward zero. I think it is very positive that the RSI moved out of overbought territory and remains above net neutral (50). This could be setting a small base for follow-through on this rally.
The DecisionPoint Alert Weekly Wrap presents an end-of-week assessment of the trend and condition of the Stock Market, the U.S. Dollar, Gold, Crude Oil, and Bonds. The DecisionPoint Alert daily report (Monday through Thursday) is abbreviated and gives updates on the Weekly Wrap assessments.
Watch the latest episode of DecisionPoint on StockCharts TV's YouTube channel here!
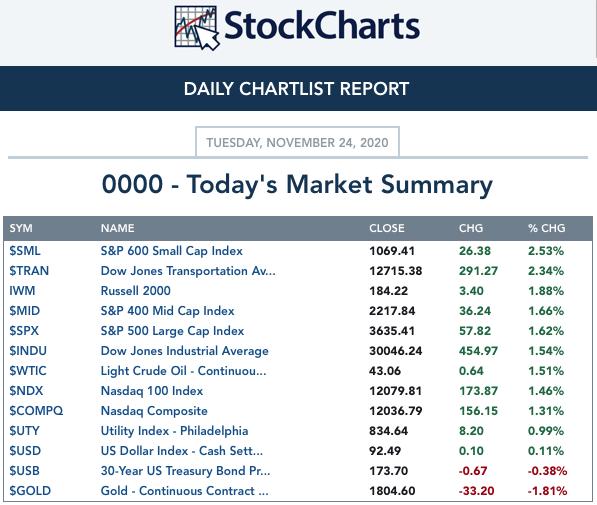
MAJOR MARKET INDEXES
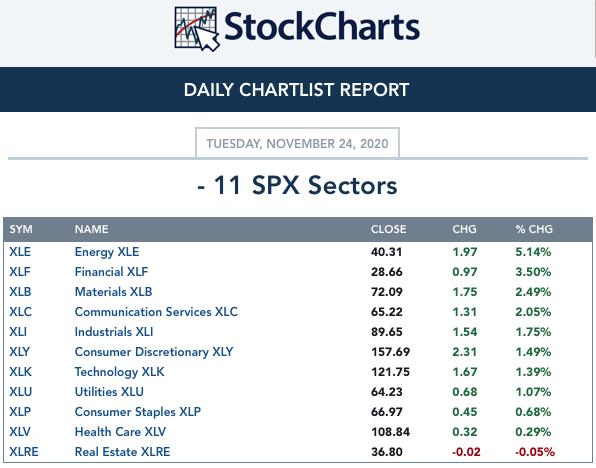
SECTORS
Each S&P 500 Index component stock is assigned to one, and only one, of 11 major sectors. This is a snapshot of the Intermediate-Term (Silver Cross) and Long-Term (Golden Cross) Trend Model signal status for those sectors.
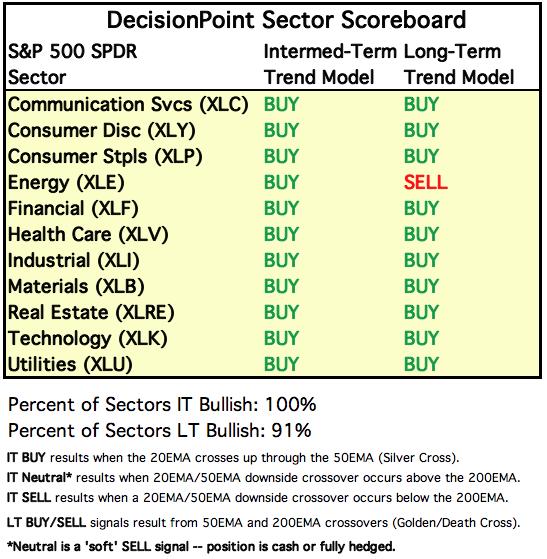
CLICK HERE for Carl's annotated Sector charts.
THE MARKET (S&P 500)
IT Trend Model: BUY as of 5/8/2020
LT Trend Model: BUY as of 6/8/2020
SPY Daily Chart: The gap up and close that was higher than the open has set up a possible initiation. I'll talk more about that later. This looks much better than the black bar that marked the exhaustion climax last time. The PMO has turned up above its signal line which is very bullish and the RSI remains positive and not overbought.
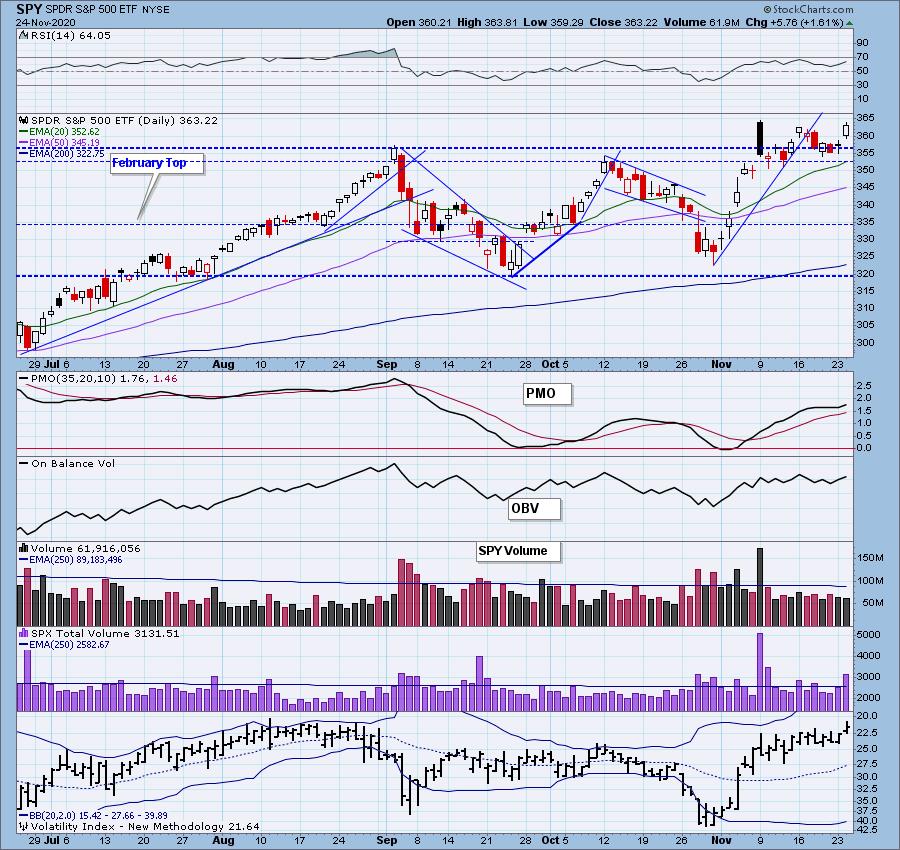
While we didn't set a new all-time intraday high, we did log a new all-time closing high.

It's Free!
***Click here to register for this recurring free DecisionPoint Trading Room on Mondays at Noon ET!***
Did you miss the 11/23 trading room? Here is a linkto the recording -- access code: EE4Xi6Y$
For best results, copy and paste the access code to avoid typos.
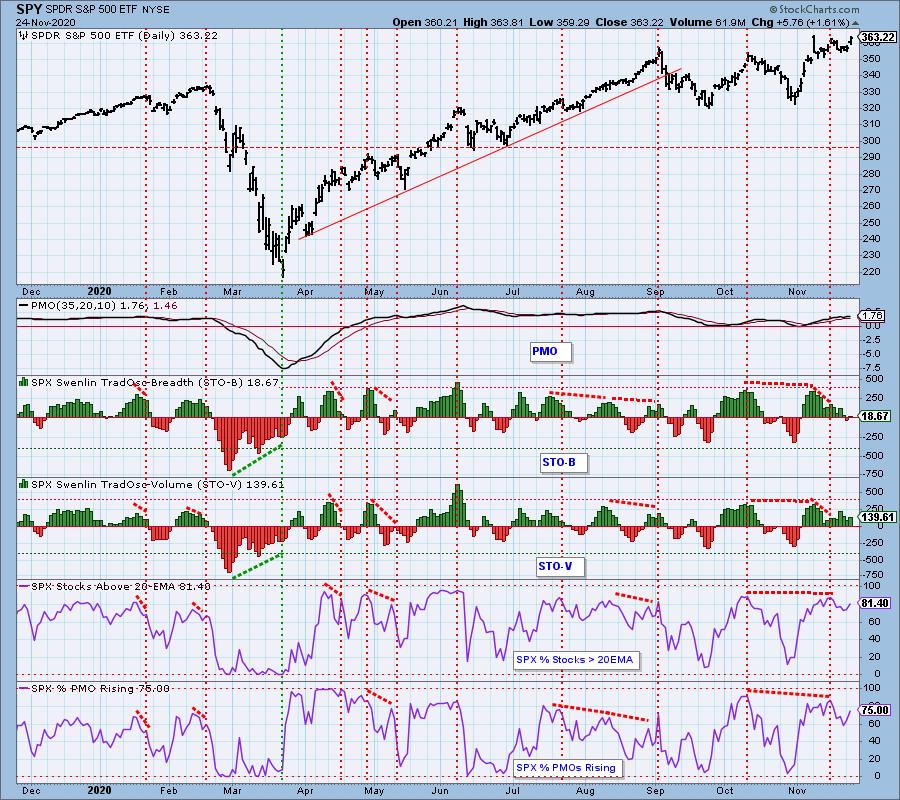
Participation: The following chart uses different methodologies for objectively showing the depth and trend of participation for intermediate- and long-term time frames.
- The Silver Cross Index (SCI) shows the percentage of SPX stocks on IT Trend Model BUY signals (20-EMA > 50-EMA).
- The Golden Cross Index (GCI) shows the percentage of SPX stocks on LT Trend Model BUY signals (50-EMA > 200-EMA).
- The Bullish Percent Index (BPI) shows the percentage of SPX stocks on Point & Figure BUY signals.
All indicators are rising, but are overbought which is always a concern.
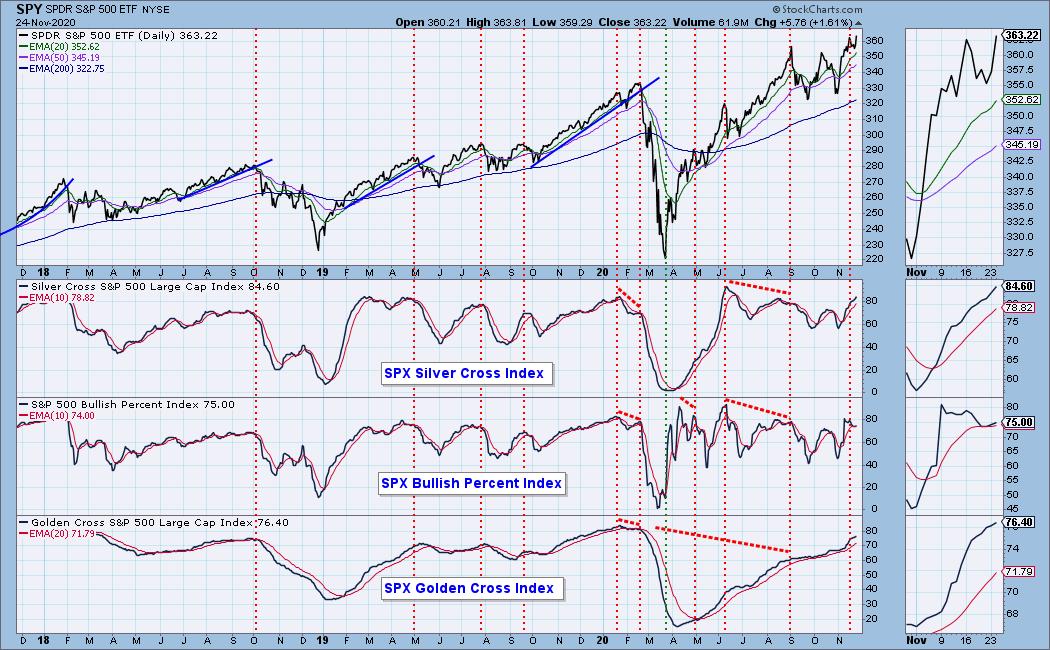
All of these indicators are overbought. They have all turned back up on today's rally which is positive, but overbought conditions are a concern here too.
Climactic Market Indicators: We saw an upside climax today on breadth as well as new highs. This likely initiation climax is confirmed based on the very high total volume. Why initiation climax and not exhaustion? As I noted earlier, the last time we saw an upside exhaustion climax was on the black bar breakout. For me, that one was fairly obvious given the close was so far below the day's high. This time we have a much better looking intraday chart and we have been mostly consolidating sideways since that last exhaustion which suggests that these climactic readings are indicative of a buying initiation. The VIX is comfortably above its EMA on the inverted scale which signifies internal strength.
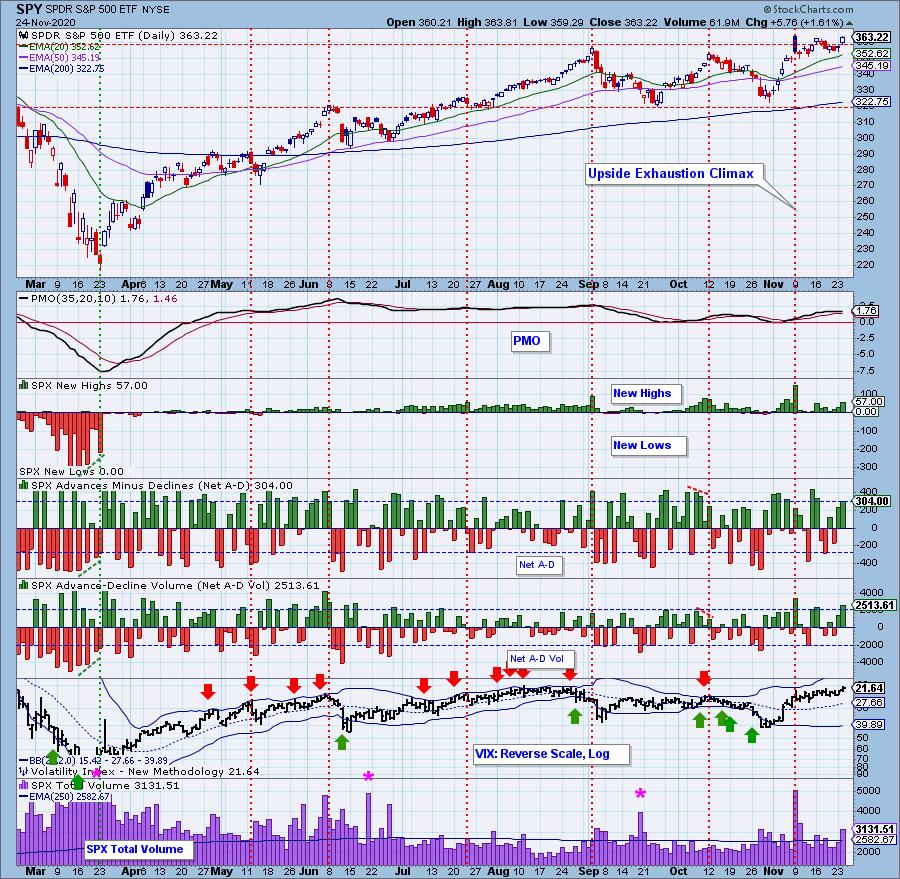
Short-Term Market Indicators: The short-term market trend is UP and the condition is NEUTRAL.
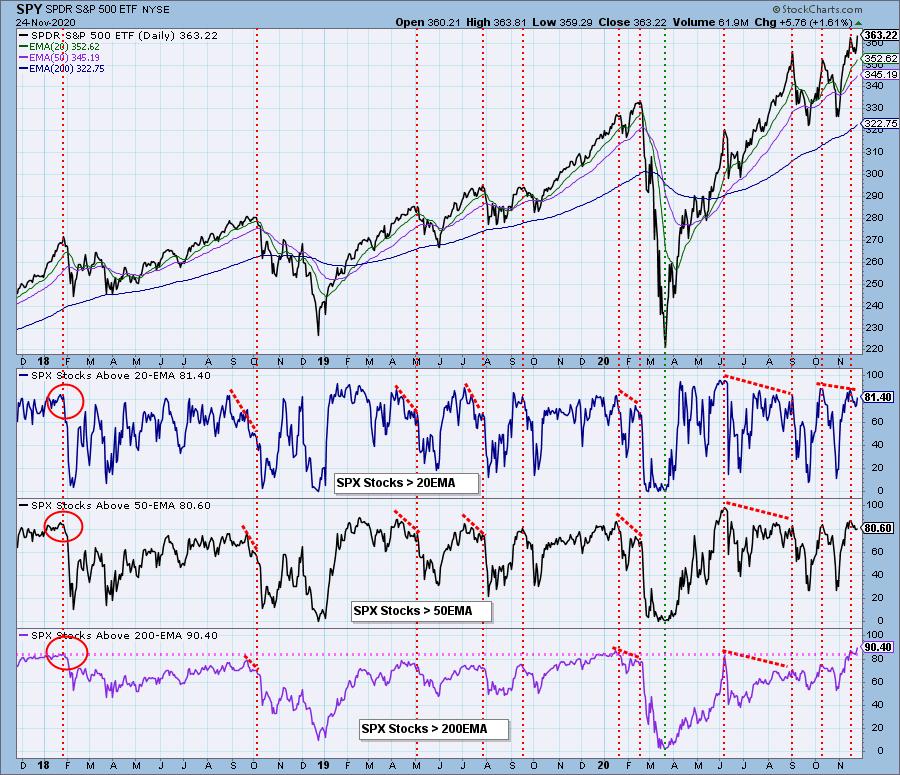
The STOs are both rising and the STO-B is now back in positive territory. %Stocks indicators are rising and are only mildly overbought.
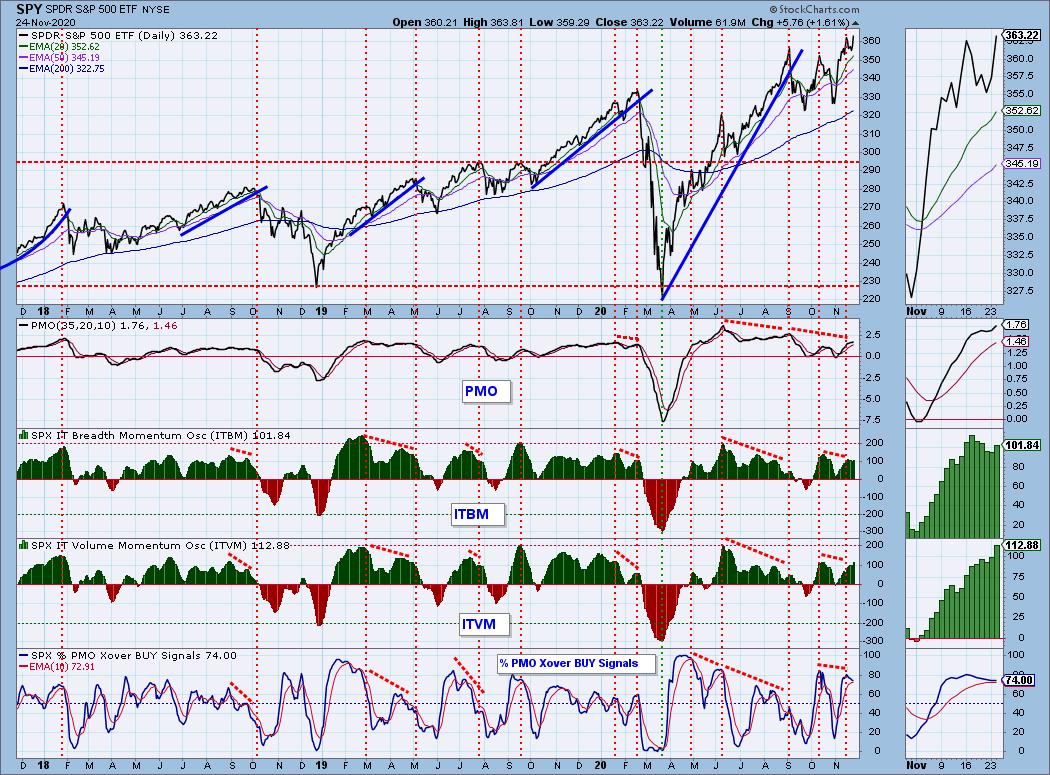
Intermediate-Term Market Indicators: The intermediate-term market trend is UP and the condition is OVERBOUGHT. The market bias is BULLISH.
Both the ITBM and ITVM moved higher today which is positive for the intermediate term. My only issue is they are overbought, but there is still some head room for them to travel higher.
CONCLUSION: So much for a boring holiday trading week! Today's strong rally with a consolidation above support, looks very much like a buying initiation. The RSI isn't overbought yet and momentum has shifted back up. There are still negative divergences and highly overbought indicators that should keep us attentive in the intermediate term. Even though we do have very overbought indicators, we are in a bull market with a bullish bias so overbought conditions can persist. Maybe Santa is coming early this year?
Have you subscribed the DecisionPoint Diamonds yet? DP does the work for you by providing handpicked stocks/ETFs from exclusive DP scans! Add it with a discount! Contact support@decisionpoint.com for more information!
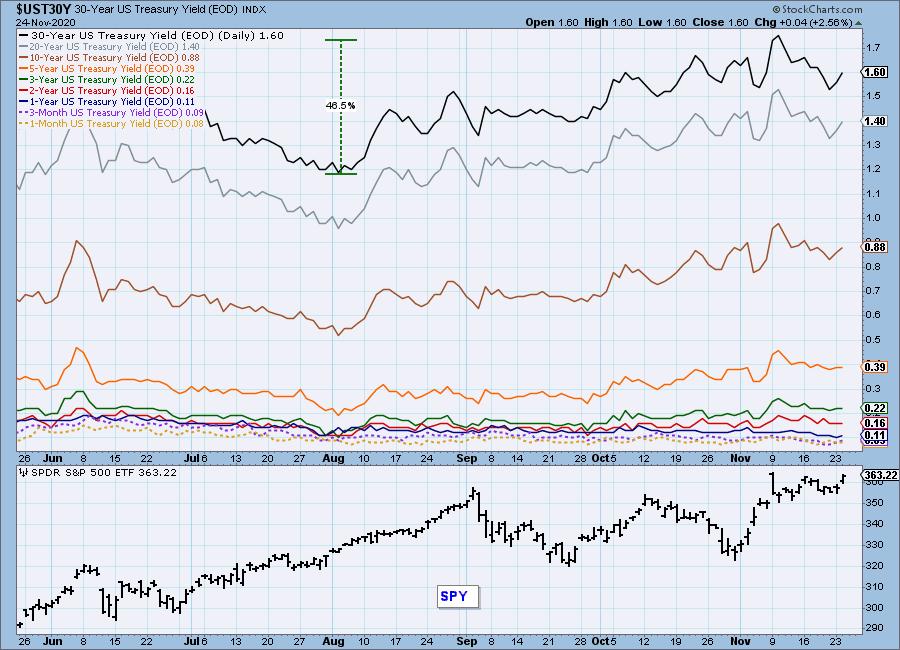
INTEREST RATES
This chart is included so we can monitor rate inversions. In normal circumstances the longer money is borrowed the higher the interest rate that must be paid. When rates are inverted, the reverse is true.
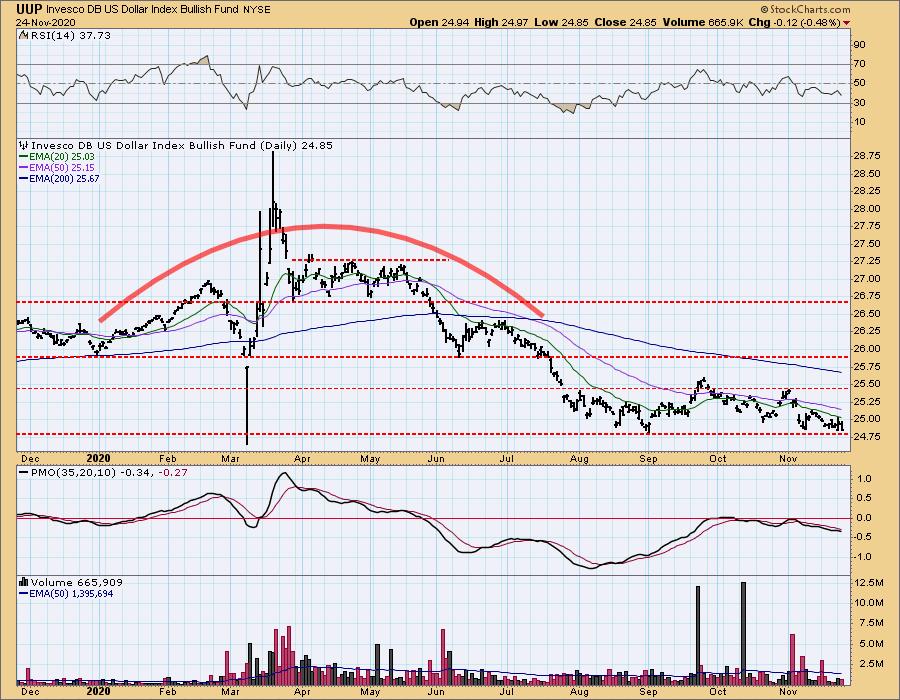
DOLLAR (UUP)
IT Trend Model: NEUTRAL as of 5/28/2020
LT Trend Model: SELL as of 7/10/2020
UUP Daily Chart: UUP made another move toward support at $24.75 after being stymied at the 20-EMA. The RSI remains negative and the PMO is falling. I still think it will hold support and maintain this trading range for now, but those indicators do suggest it may have trouble.
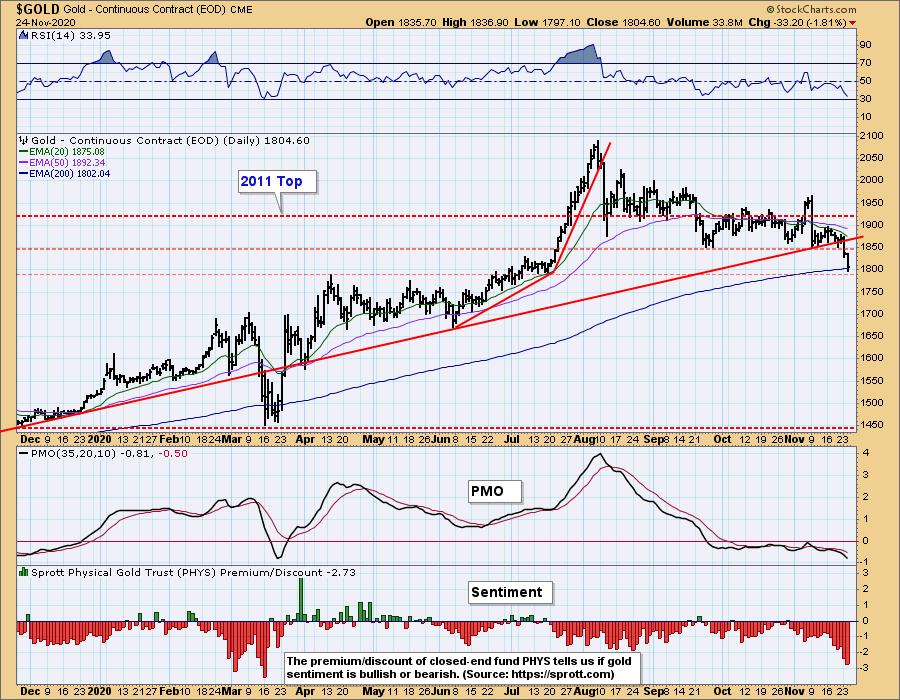
GOLD
IT Trend Model: NEUTRAL as of 10/14/2020
LT Trend Model: BUY as of 1/8/2019
GOLD Daily Chart: The Dollar was down, but Gold was down even more. Typically they have a reverse correlation so this tells me that there are plenty of sellers. The discounts are reaching very high levels. I had thought that price might test 1800, but I didn't expect it to happen in one day. The RSI and PMO are both oversold and high discounts typically occur before reversals. The 200-EMA is now holding as support and typically we see a reversal off the 200-EMA. At this point it could be hard to put the breaks on.
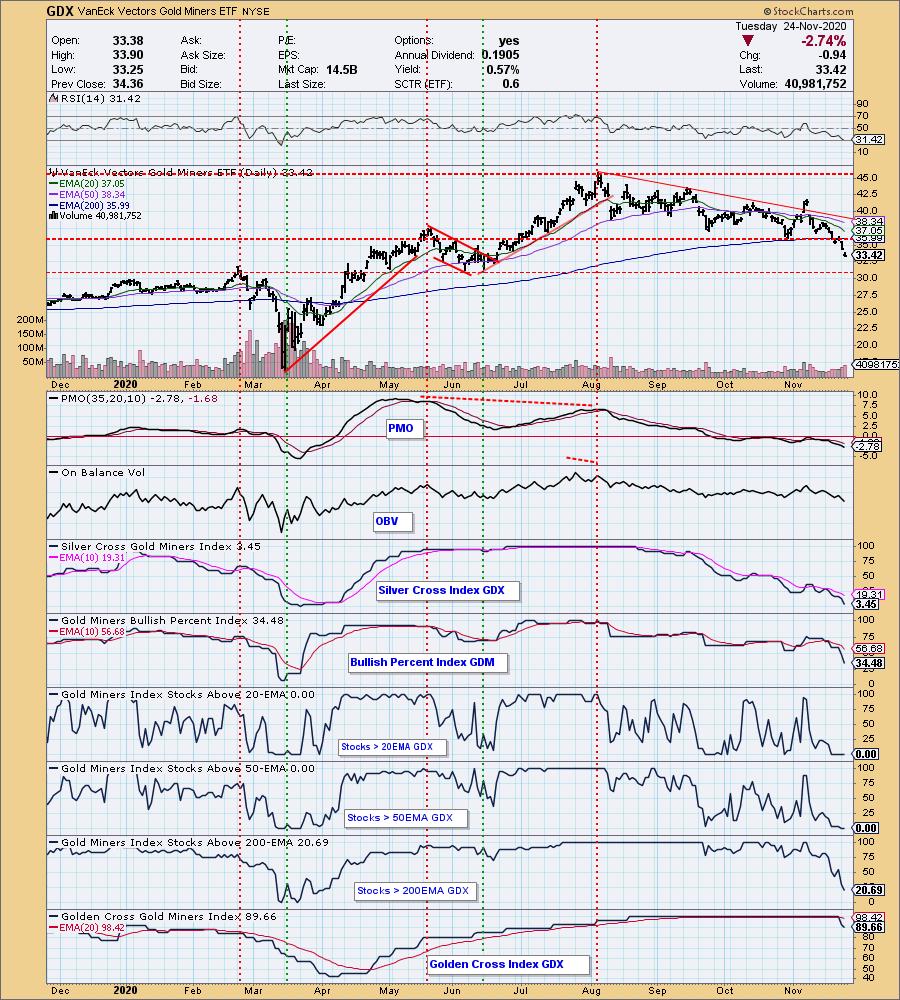
GOLD MINERS Golden and Silver Cross Indexes: The bottom has dropped out on GDX and it appears it is in for more downside. As I said yesterday, support is at $31, but boy it cut right through the 200-EMA so I'm concerned that won't hold. There is lots of weakness now in this sector as there are no components with price above the 20/50-EMAs. The SCI is at only 3.45. That means that less than 4% of components have a 20-EMA > 50-EMA. The RSI and PMO are both very oversold as well. Oversold conditions make GDX ripe for a reversal, but I won't be calling for that just yet given the strong momentum to the downside and the pressure of dropping Gold prices.
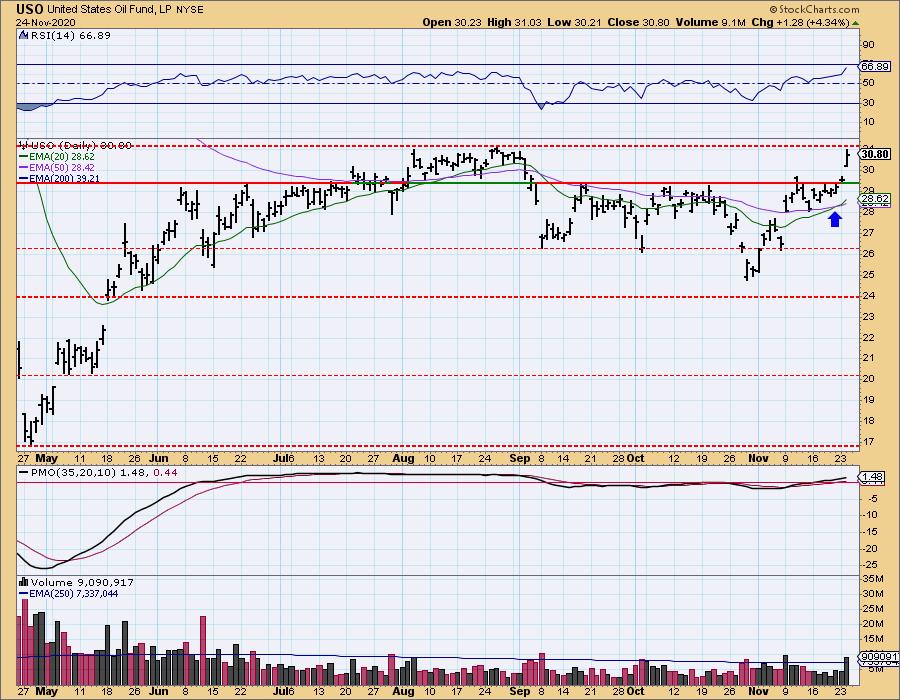
CRUDE OIL (USO)
IT Trend Model: BUY as of 10/20/2020
LT Trend Model: SELL as of 2/3/2020
USO Daily Chart: Oil continues to rally and boost the Energy sector. Even with this rally, the RSI is not yet overbought and neither is the PMO. Price is now going to have to test overhead resistance at the August highs, but given the pop in volume and big gap up, I am looking for a breakout.
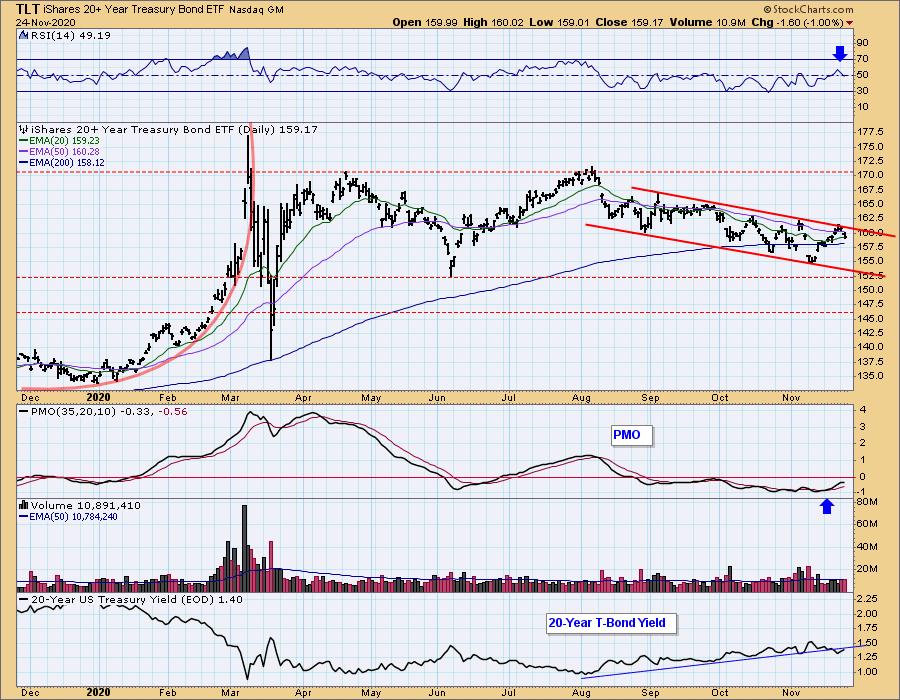
BONDS (TLT)
IT Trend Model: NEUTRAL as of 8/27/2020
LT Trend Model: BUY as of 1/2/2019
TLT Daily Chart: Once again TLT failed to hold a breakout. Every time it gets above the 50-EMA it fails. The RSI is now negative and the PMO is topping below the zero line. I'm throwing out the bullish wedge in favor of a declining trend channel.
Full Disclosure: I own TLT
Technical Analysis is a windsock, not a crystal ball.
Happy Charting! - Erin
Disclaimer: This blog is for educational purposes only and should not be construed as financial advice. The ideas and strategies should never be used without first assessing your own personal and financial situation, or without consulting a financial professional. Any opinions expressed herein are solely those of the author, and do not in any way represent the views or opinions of any other person or entity.
NOTE: The signal status reported herein is based upon mechanical trading model signals, specifically, the DecisionPoint Trend Model. They define the implied bias of the price index based upon moving average relationships, but they do not necessarily call for a specific action. They are information flags that should prompt chart review. Further, they do not call for continuous buying or selling during the life of the signal. For example, a BUY signal will probably (but not necessarily) return the best results if action is taken soon after the signal is generated. Additional opportunities for buying may be found as price zigzags higher, but the trader must look for optimum entry points. Conversely, exit points to preserve gains (or minimize losses) may be evident before the model mechanically closes the signal.
Helpful DecisionPoint Links:
DecisionPoint Alert Chart List
DecisionPoint Golden Cross/Silver Cross Index Chart List
DecisionPoint Sector Chart List
Price Momentum Oscillator (PMO)
Swenlin Trading Oscillators (STO-B and STO-V)