
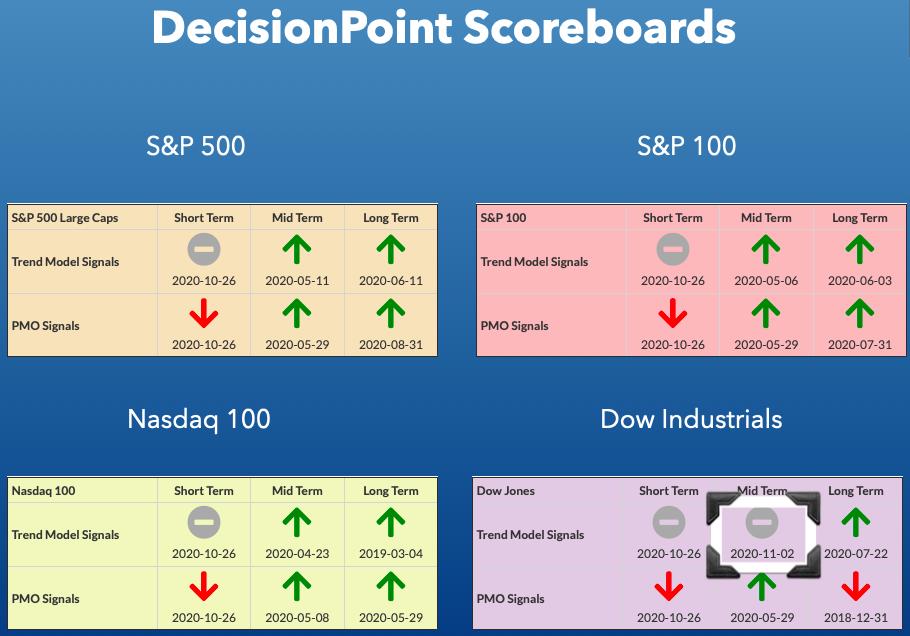
We had a new signal change on the Dow Industrials ($INDU) today. Looking at the Scoreboards below, we note that this is the first loss of a BUY signal in the intermediate term. The IT Trend Model Neutral signal was generated when the 20-EMA crossed below the 50-EMA while the 50-EMA was above the 200-EMA. Had the negative crossover occurred below the 200-EMA, it would've been listed as a SELL signal.
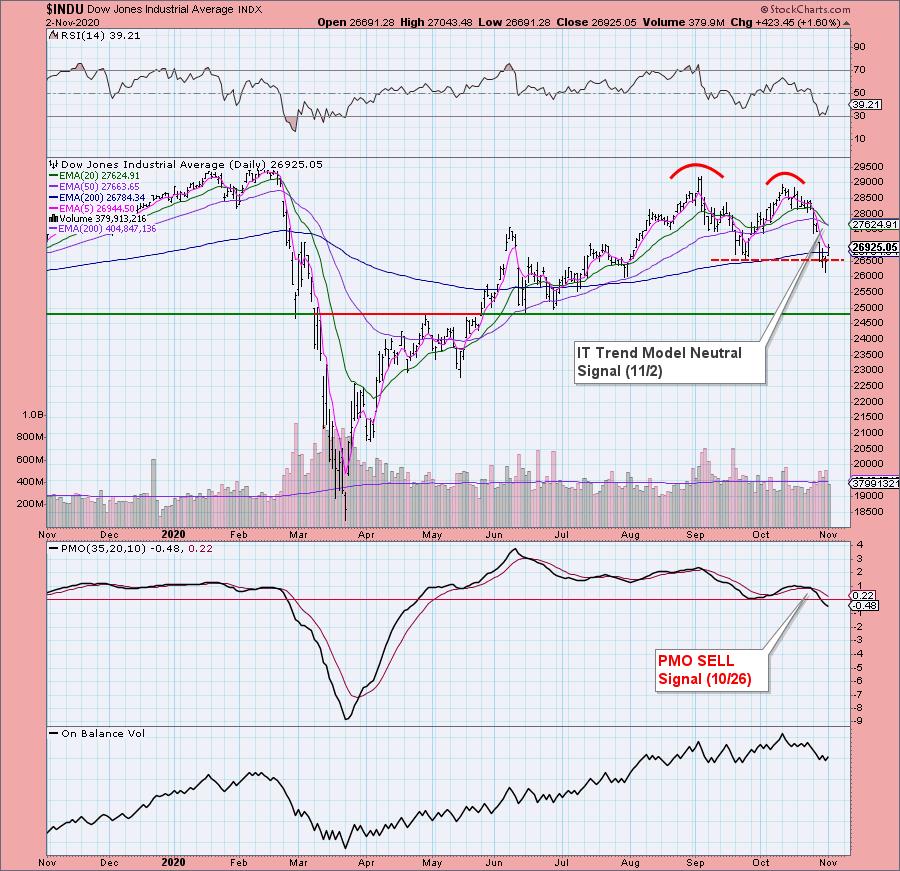
Note on the Dow daily bar chart below that the "confirmation line" of the double-top pattern was breached last week. Despite those breaches, price closed on the confirmation line Friday. Today's market reversal moved price back above the confirmation line. That doesn't fix the declining PMO on a SELL signal further below the zero line. The RSI is negative, but at least rising.
The DecisionPoint Alert Weekly Wrap presents an end-of-week assessment of the trend and condition of the Stock Market, the U.S. Dollar, Gold, Crude Oil, and Bonds. The DecisionPoint Alert daily report (Monday through Thursday) is abbreviated and gives updates on the Weekly Wrap assessments.
Watch the latest episode of DecisionPoint on StockCharts TV's YouTube channel here!
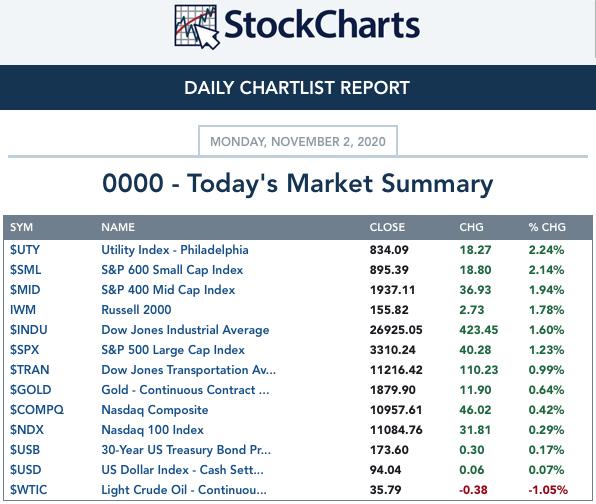
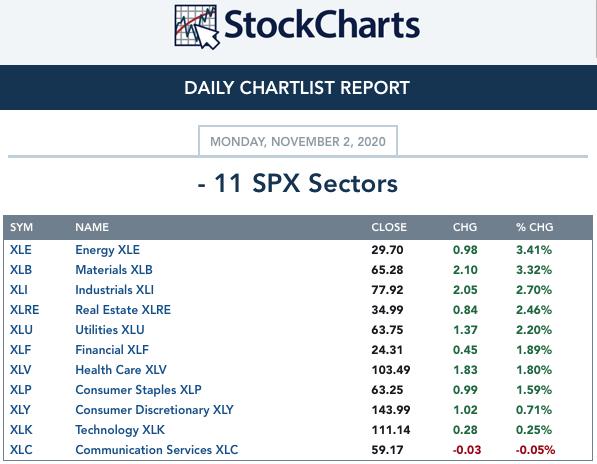
MAJOR MARKET INDEXES
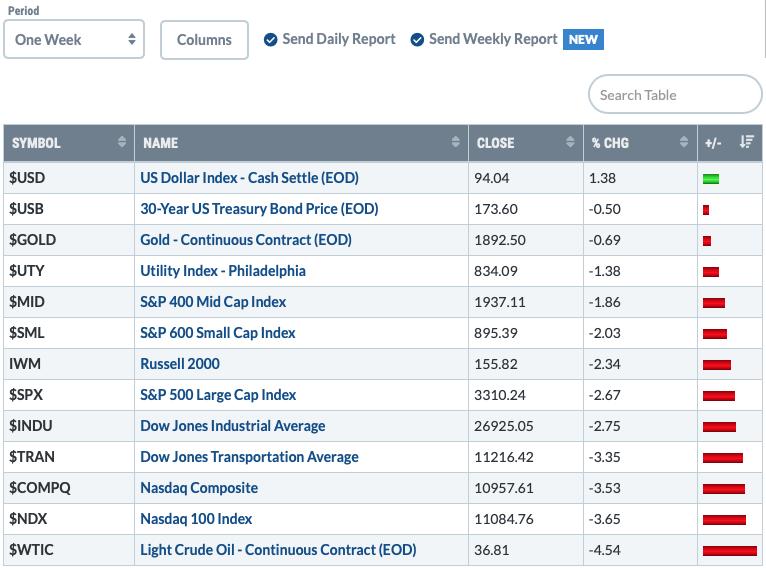
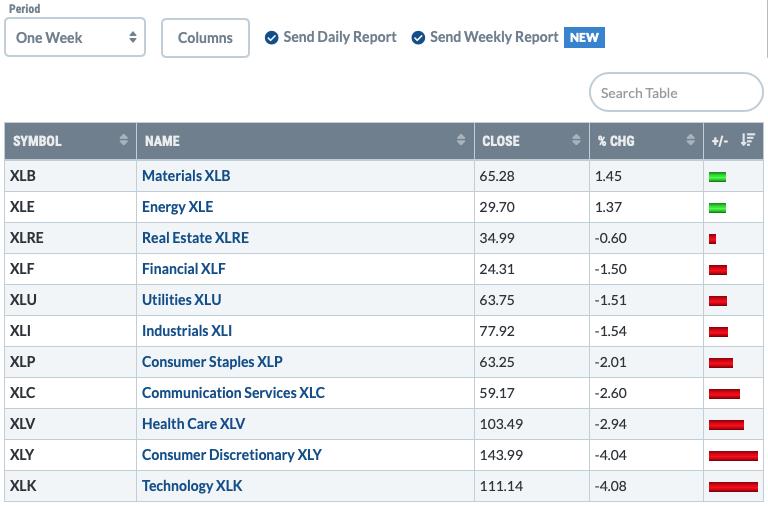
One Week Results:
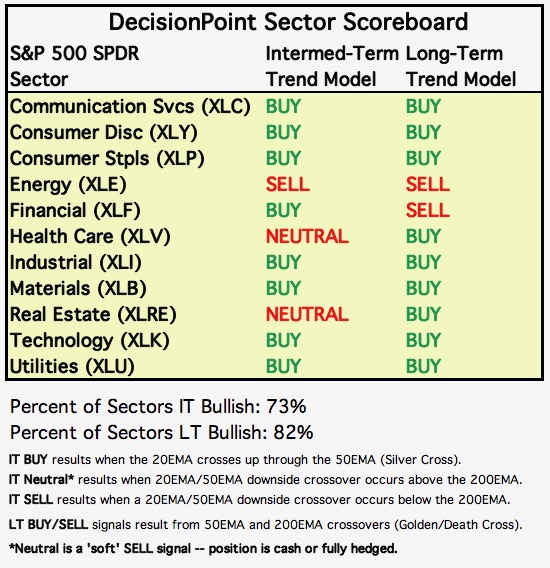
SECTORS
Each S&P 500 Index component stock is assigned to one, and only one, of 11 major sectors. This is a snapshot of the Intermediate-Term (Silver Cross) and Long-Term (Golden Cross) Trend Model signal status for those sectors.
One Week Results:
THE MARKET (S&P 500)
IT Trend Model: BUY as of 5/8/2020
LT Trend Model: BUY as of 6/8/2020
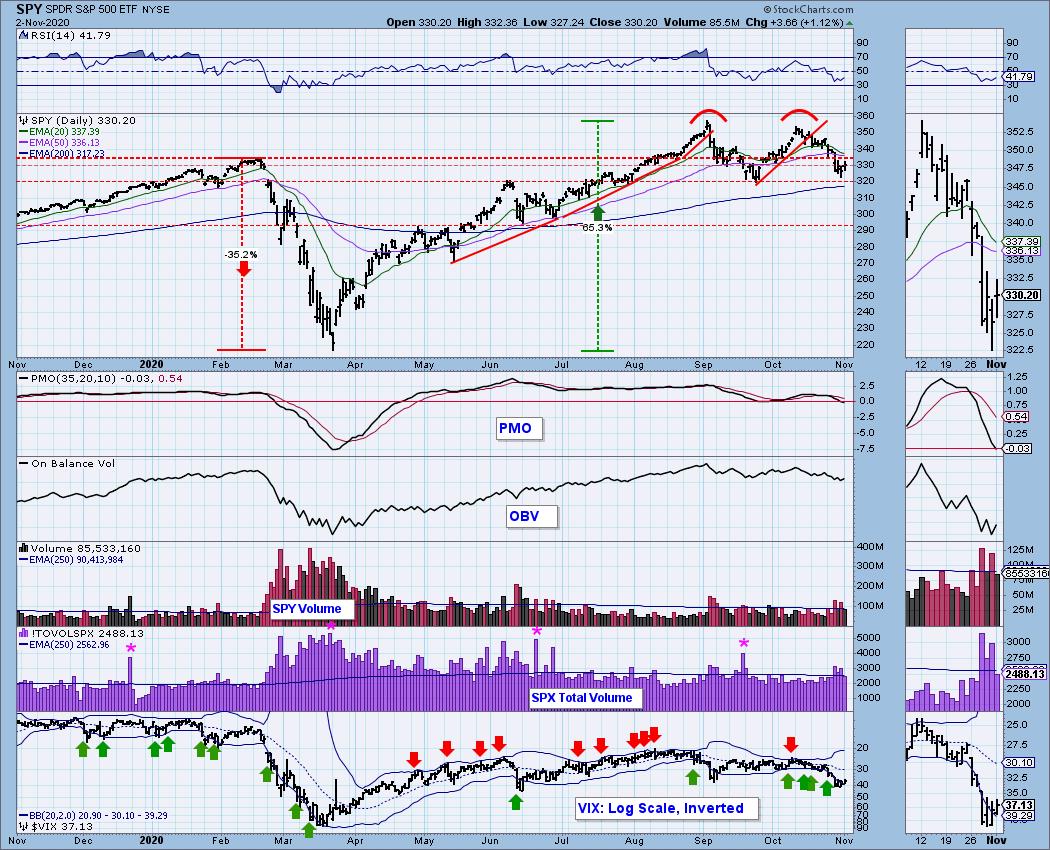
SPY Daily Chart: We have a perfectly formed "doji" candlestick as price closed on the opening price. What this tells us is that bulls and bears are in a complete state of indecision with neither holding an advantage. The PMO has reached negative territory below zero. While volume was elevated, but not climactic.
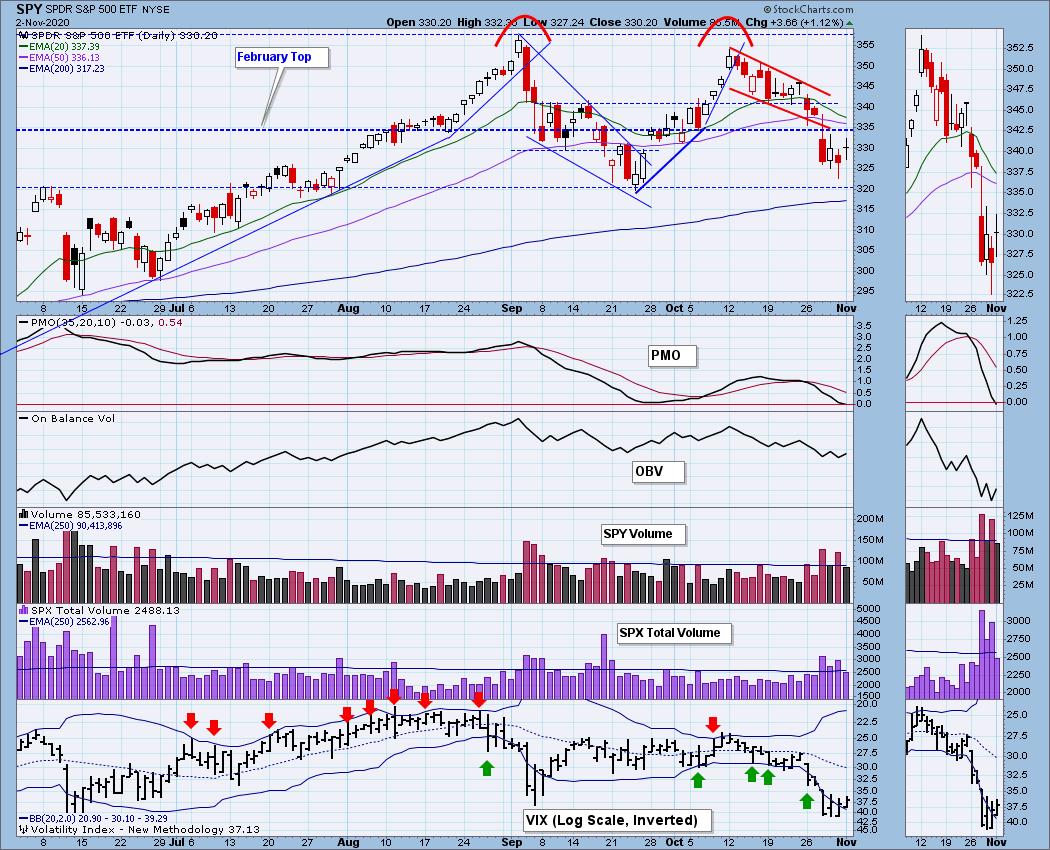
The double-top is still in play even though price has turned up before breaking down and executing the pattern with a drop below the September low (which forms the confirmation line of the double-top pattern).

It's Free!
***Click here to register for this recurring free DecisionPoint Trading Room on Mondays at Noon ET!***
Did you miss the 10/26 trading room? Here is a link to the recording (access code: X+2gJfpd).
For best results, copy and paste the access code to avoid typos.
Participation: The following chart uses different methodologies for objectively showing the depth and trend of participation for intermediate- and long-term time frames.
- The Silver Cross Index (SCI) shows the percentage of SPX stocks on IT Trend Model BUY signals (20-EMA > 50-EMA).
- The Golden Cross Index (GCI) shows the percentage of SPX stocks on LT Trend Model BUY signals (50-EMA > 200-EMA).
- The Bullish Percent Index (BPI) shows the percentage of SPX stocks on Point & Figure BUY signals.
The BPI ticked up on today's rally, but the SCI and GCI were both unfazed and are continuing lower.
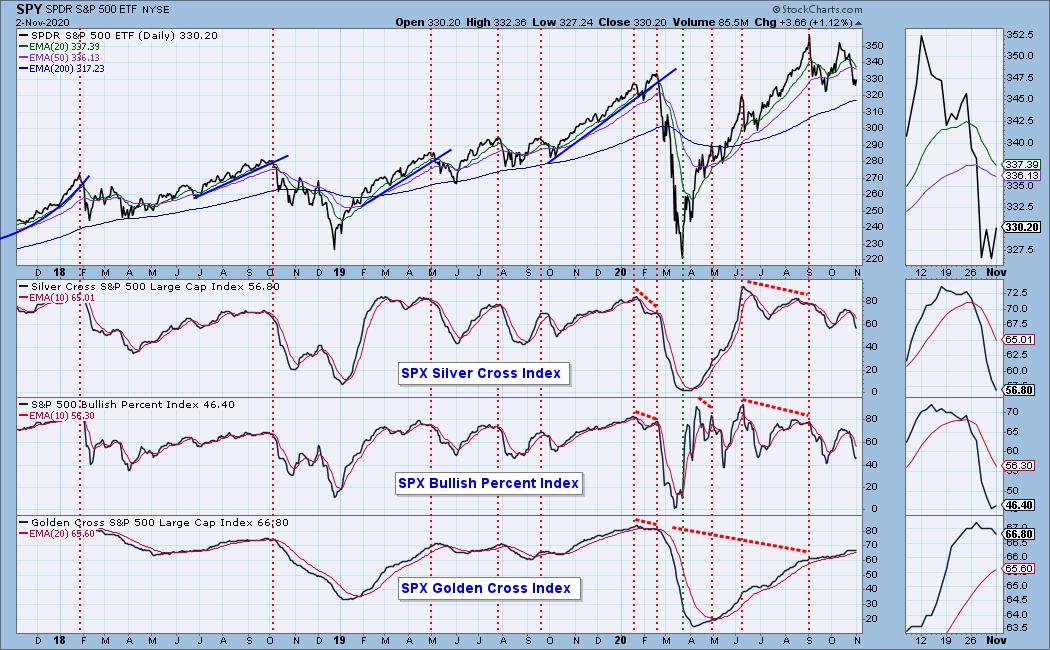
It is bullish to see these oversold indicators rising again.
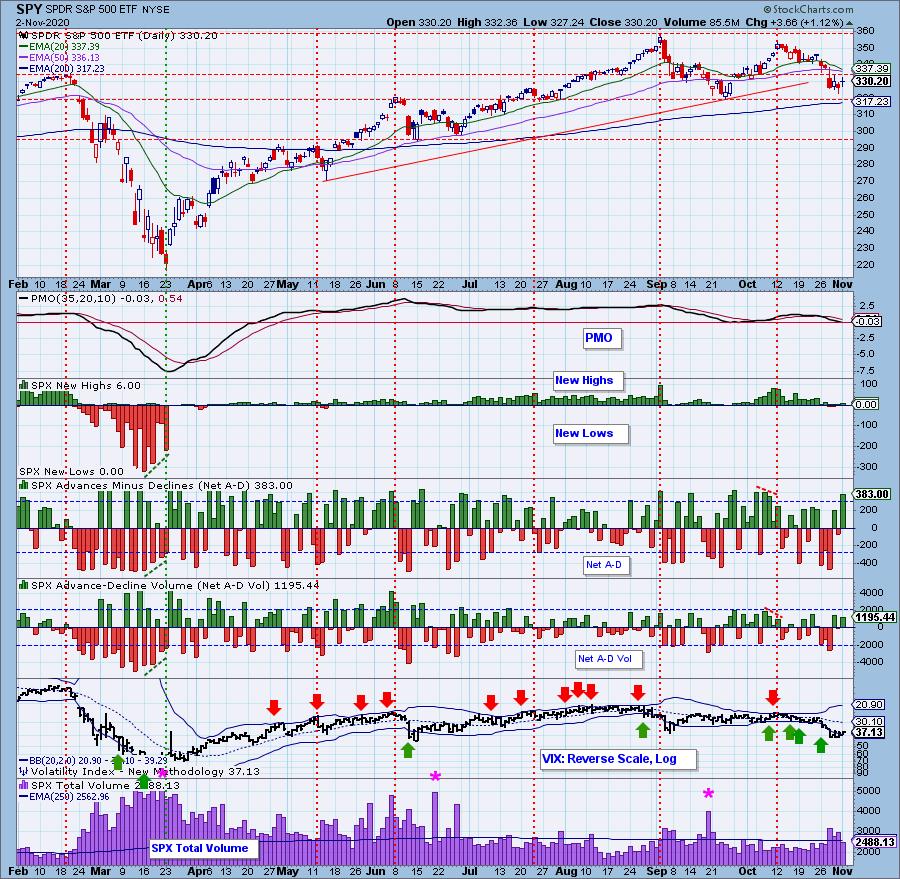
Climactic Market Indicators: We did see a climactic reading on Net A-D, but we didn't get the coordinating climaxes from Net A-D Volume nor on Total Volume. The VIX is traveling a bit higher on the inverted scale after puncturing the lower Bollinger Band everyday last week. Typically, when the VIX rises out of oversold territory on that inverted scale, it is joined by a price rally. This is certainly possible in the short term, but remember high VIX readings whether rising or falling are thin ice for the market.
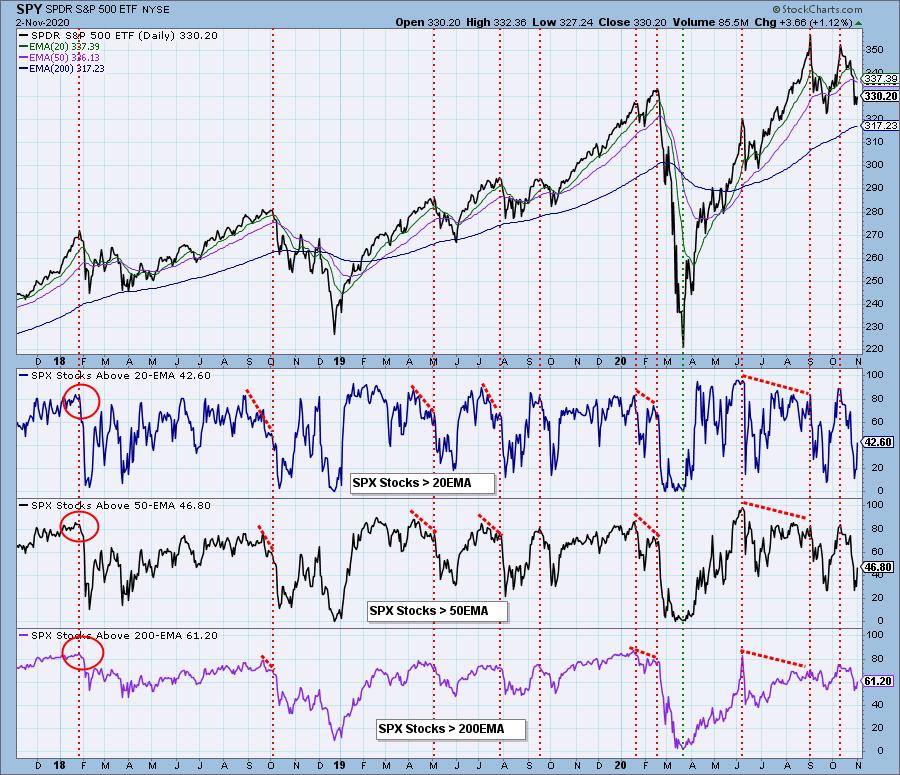
Short-Term Market Indicators: The STOs have reached oversold territory and are rising again. Oversold %Stocks indicators are also rising out of overbought territory.
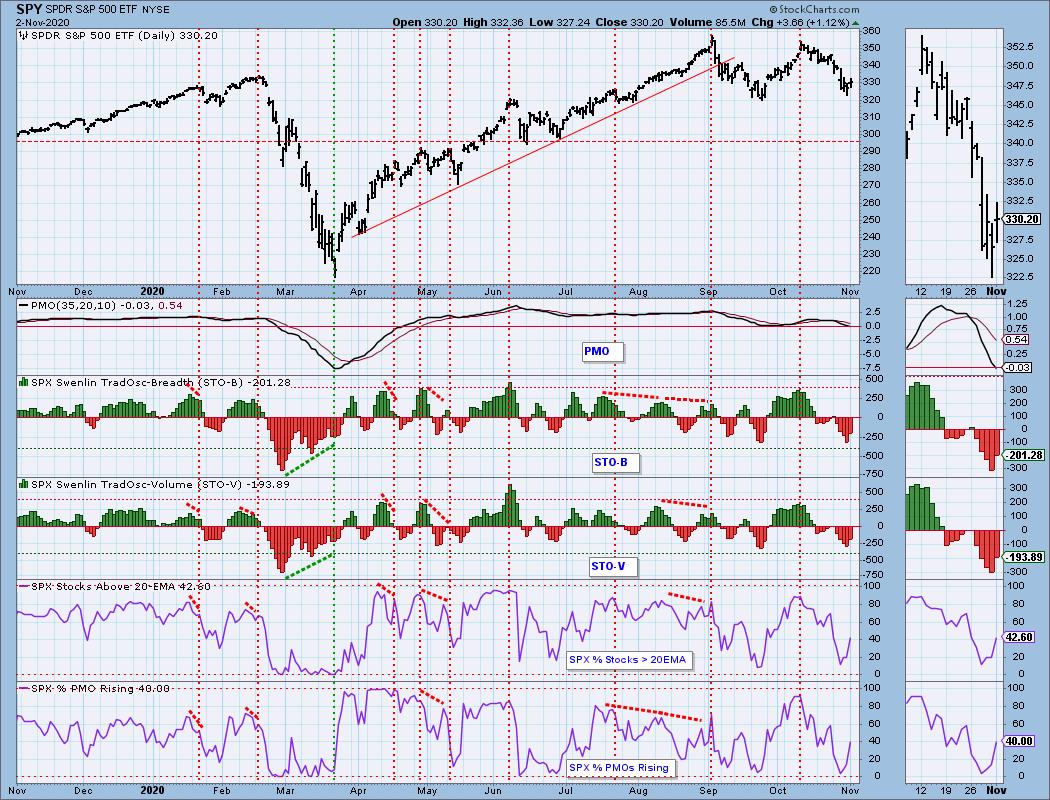
Intermediate-Term Market Indicators: The ITBM/ITVM are still falling and in fact, the ITVM is now logging negative readings. The %Stocks with crossover buy signals is very oversold and today it ticked upward.
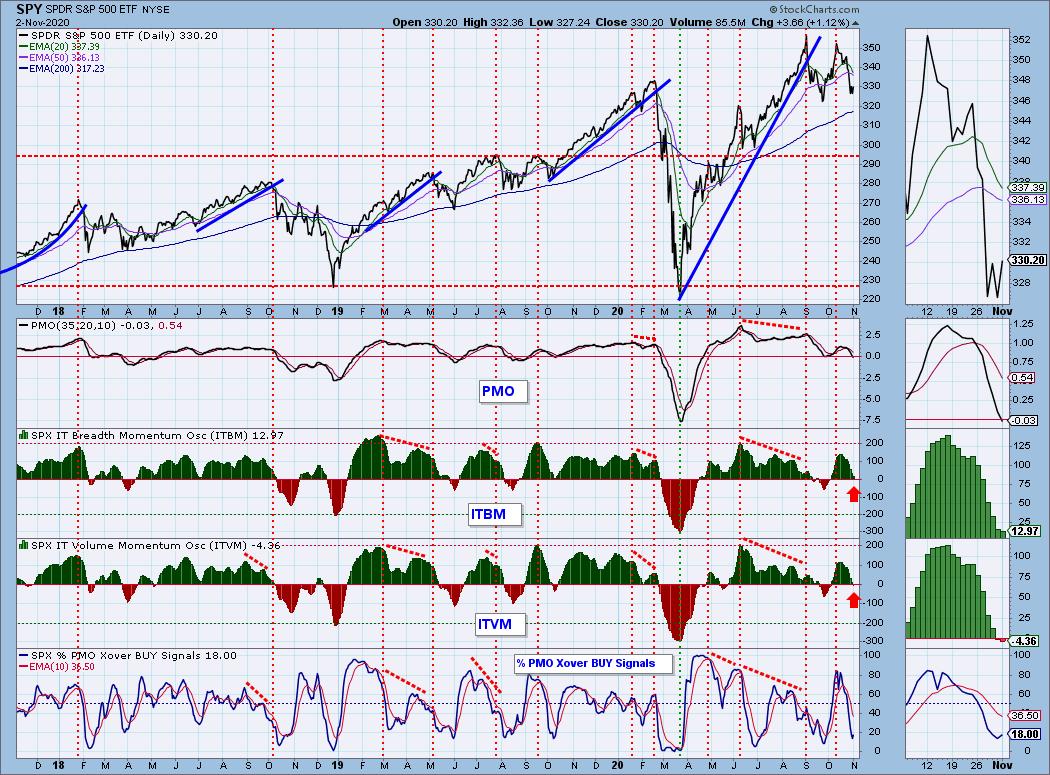
CONCLUSION: The short-term indicators are now trying to improve. We are seeing oversold indicators rising again in the short term. Unfortunately, the intermediate term is deteriorating. The ITVM is now in negative territory and we just got an IT Trend Model Neutral signal on the Dow Industrials. The intermediate-term double-top still looms large on the SPY and other major indexes.
Have you subscribed the DecisionPoint Diamonds yet? DP does the work for you by providing handpicked stocks/ETFs from exclusive DP scans! Add it with a discount! Contact support@decisionpoint.com for more information!
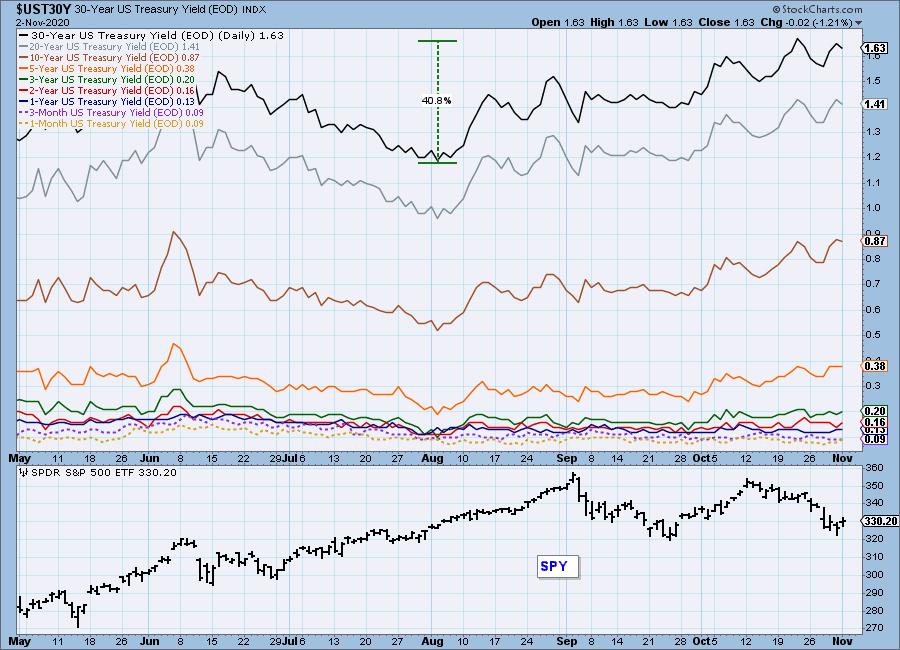
INTEREST RATES
This chart is included so we can monitor rate inversions. In normal circumstances the longer money is borrowed the higher the interest rate that must be paid. When rates are inverted, the reverse is true.
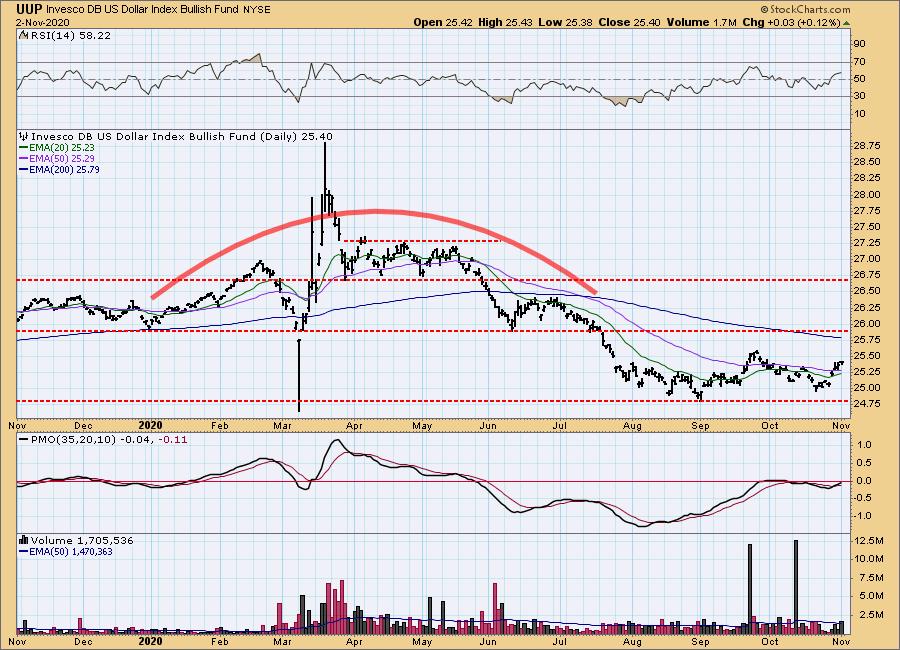
DOLLAR (UUP)
IT Trend Model: NEUTRAL as of 5/28/2020
LT Trend Model: SELL as of 7/10/2020
UUP Daily Chart: We could be looking at a double-bottom on UUP. The RSI and PMO are rising. The PMO is still below the zero line, but likely not for long. We had a fake out breakout at the end of September.
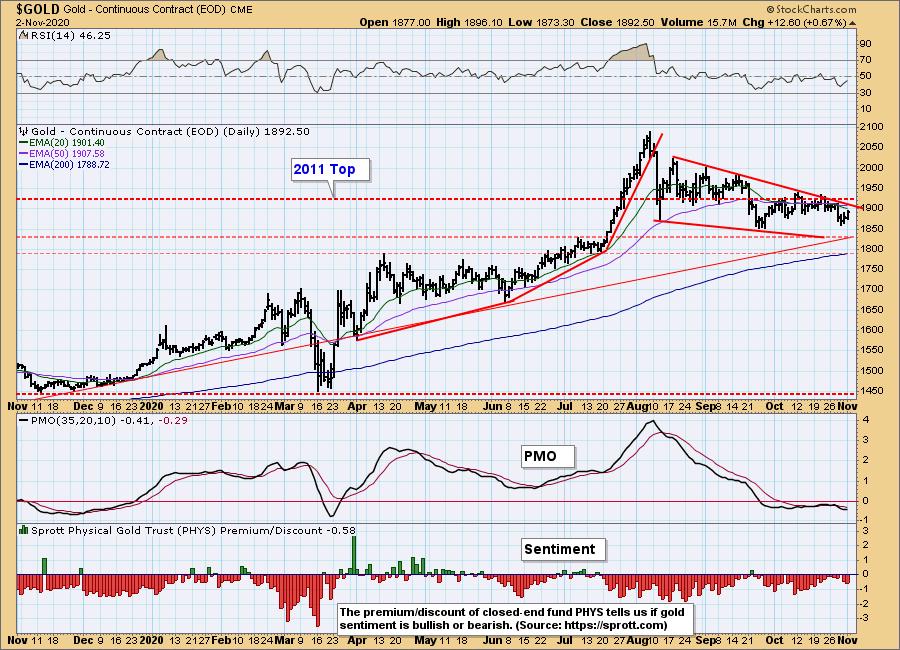
GOLD
IT Trend Model: NEUTRAL as of 10/14/2020
LT Trend Model: BUY as of 1/8/2019
GOLD Daily Chart: Gold got a boost today from an increase in buyers. I say this because the Dollar was up today and generally you'll see Gold move in the equal and opposite direction when the reverse correlation is a perfect -1. Seeing them travel in the same direction and seeing Gold rise more than the Dollar, we can surmise that we had more buyers and/or interest in Gold. Sentiment for Gold remains mostly bearish given the current discount on PHYS.
Full disclosure: I own GLD.
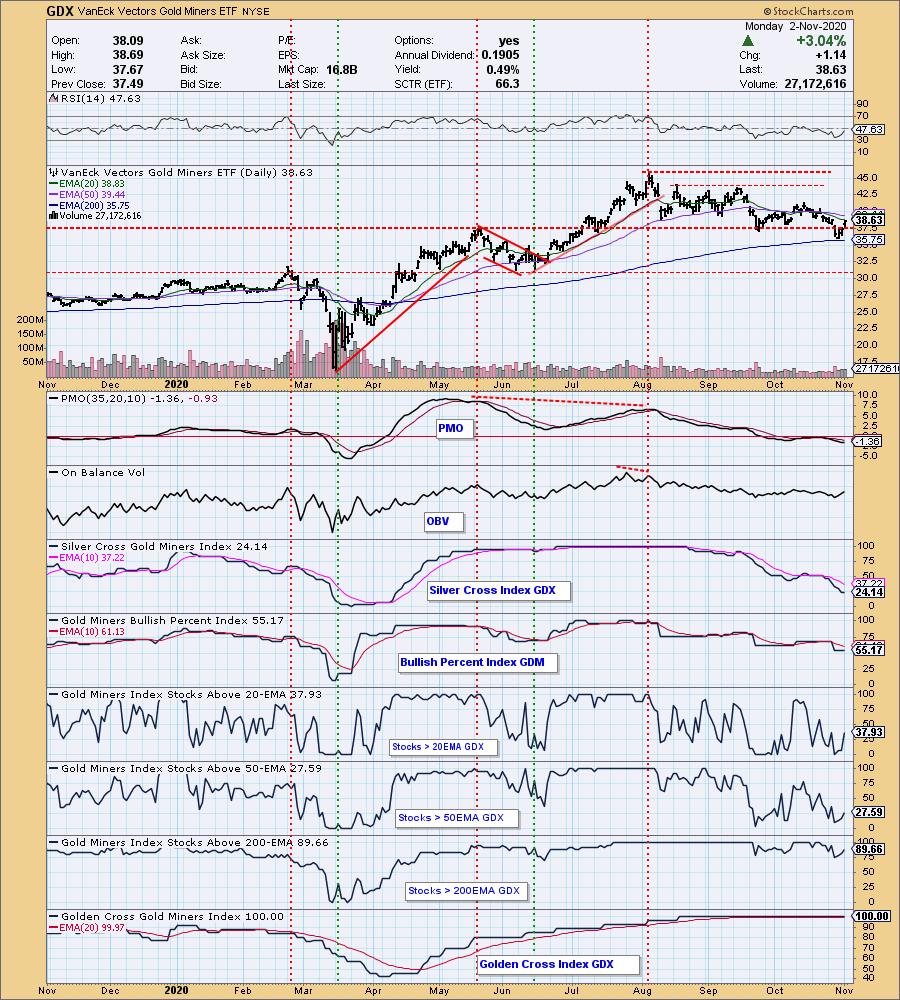
GOLD MINERS Golden and Silver Cross Indexes: I talked at length about Gold Miners in today's DecisionPoint Show. GDX had lost critical support at the May top, but managed to find it at the 200-EMA. We have very oversold indicators that are beginning to see some improvement. I like Miners, but I now see the 20/50-EMAs as overhead resistance. The picture is getting brighter for Miners, but we still have a negative RSI and PMO.
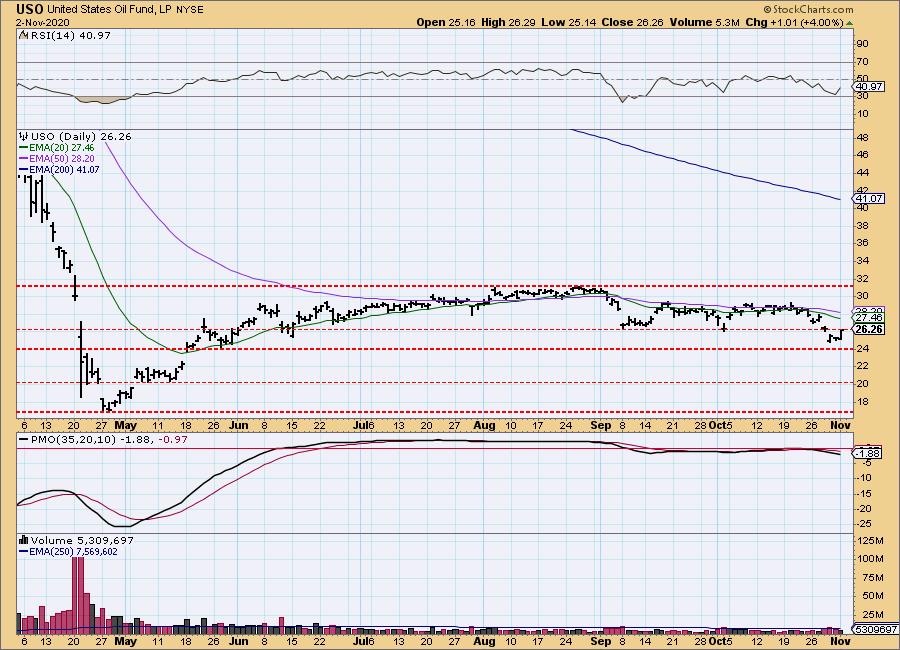
CRUDE OIL (USO)
IT Trend Model: SELL as of 9/8/2020
LT Trend Model: SELL as of 2/3/2020
USO Daily Chart: Oil rallied strongly today, up +4%! However, that did not get price back above overhead resistance. The PMO is flat, but below the zero line. The RSI is negative but is showing some improvement. Just note how far price is below the 200-EMA. This is a highly bearish configuration for the EMAs so expectations should be tempered. There are now two levels of overhead resistance that will be a challenge. Current level at the September low and the 20/50-EMAs further up.
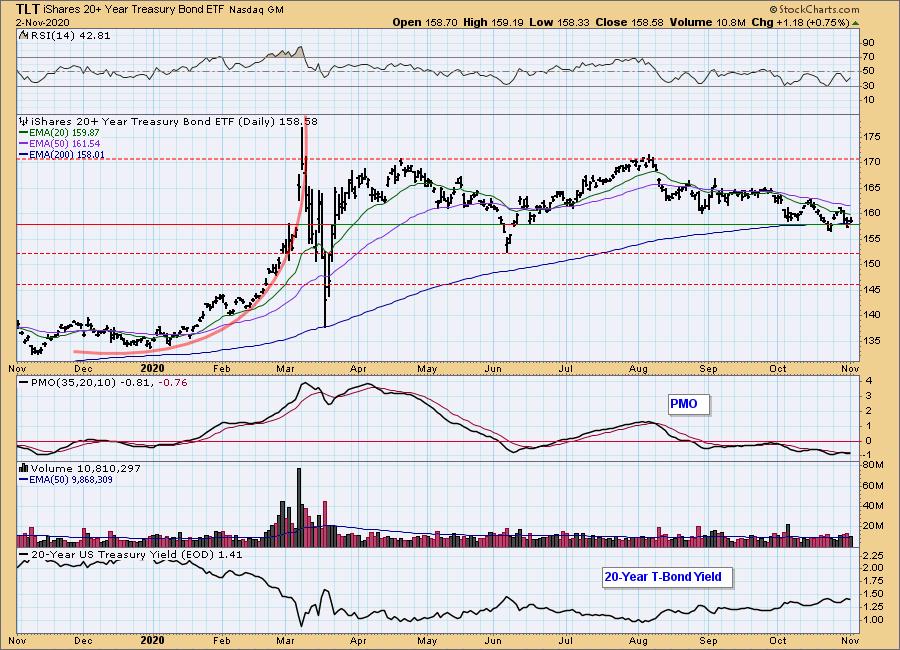
BONDS (TLT)
IT Trend Model: NEUTRAL as of 8/27/2020
LT Trend Model: BUY as of 1/2/2019
TLT Daily Chart: The 200-EMA is currently holding as support, but price hasn't been able to even challenge the 50-EMA. The PMO is flat and on a crossover SELL signal. The RSI is negative and has been since mid-August. fd
Full Disclosure: I own TLT.
Technical Analysis is a windsock, not a crystal ball.
Happy Charting! - Erin
Disclaimer: This blog is for educational purposes only and should not be construed as financial advice. The ideas and strategies should never be used without first assessing your own personal and financial situation, or without consulting a financial professional. Any opinions expressed herein are solely those of the author, and do not in any way represent the views or opinions of any other person or entity.
NOTE: The signal status reported herein is based upon mechanical trading model signals, specifically, the DecisionPoint Trend Model. They define the implied bias of the price index based upon moving average relationships, but they do not necessarily call for a specific action. They are information flags that should prompt chart review. Further, they do not call for continuous buying or selling during the life of the signal. For example, a BUY signal will probably (but not necessarily) return the best results if action is taken soon after the signal is generated. Additional opportunities for buying may be found as price zigzags higher, but the trader must look for optimum entry points. Conversely, exit points to preserve gains (or minimize losses) may be evident before the model mechanically closes the signal.
Helpful DecisionPoint Links:
DecisionPoint Alert Chart List
DecisionPoint Golden Cross/Silver Cross Index Chart List
DecisionPoint Sector Chart List
Price Momentum Oscillator (PMO)