
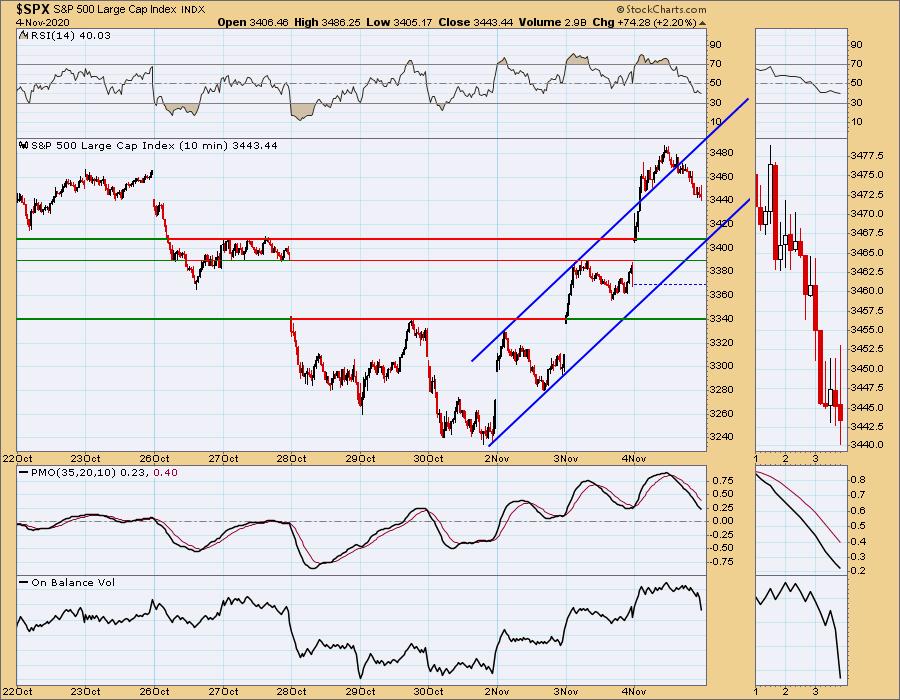
We have established over and over that uncertainty is something that the market doesn't like; but something the market DOES like is gridlock. There is a high likelihood that the Senate will remain in republican hands, while the House will remain in democrat hands. Regardless of what happens in the announcement of a President, the market knows that a split congress will make large programs more difficult to pass. However, we care most about what the charts are saying versus business news outlets. We can see that this week's market action brought a very strong rally leading up to the election. When price moved very overbought and out of the rising trend channel, price fell, taking many of today's gains with it.
The DecisionPoint Alert Weekly Wrap presents an end-of-week assessment of the trend and condition of the Stock Market, the U.S. Dollar, Gold, Crude Oil, and Bonds. The DecisionPoint Alert daily report (Monday through Thursday) is abbreviated and gives updates on the Weekly Wrap assessments.
Watch the latest episode of DecisionPoint on StockCharts TV's YouTube channel here!
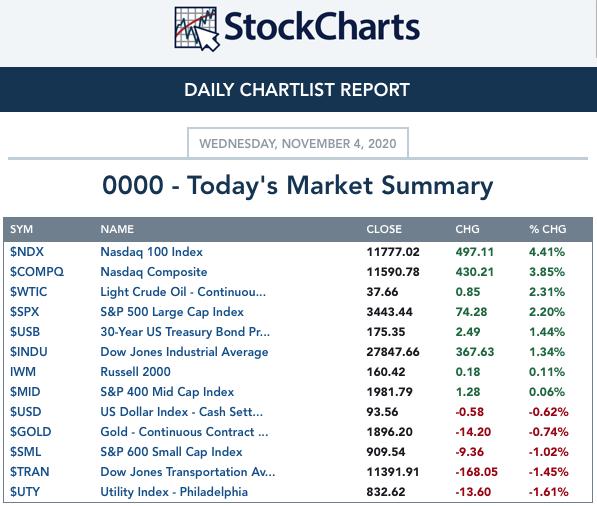
MAJOR MARKET INDEXES
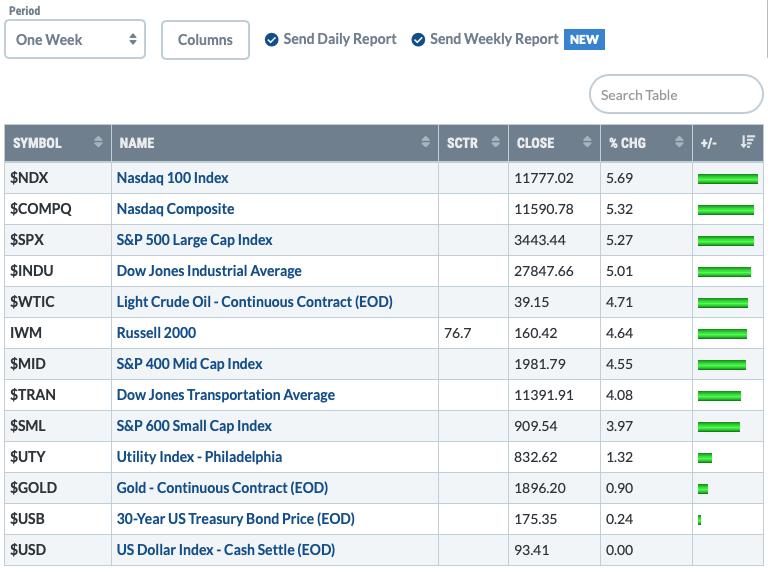
One Week Results:
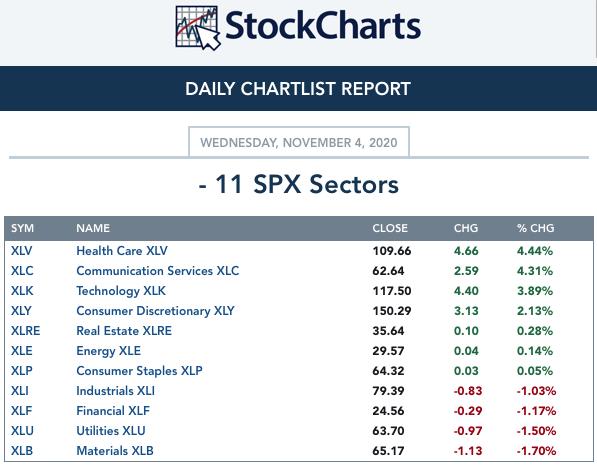
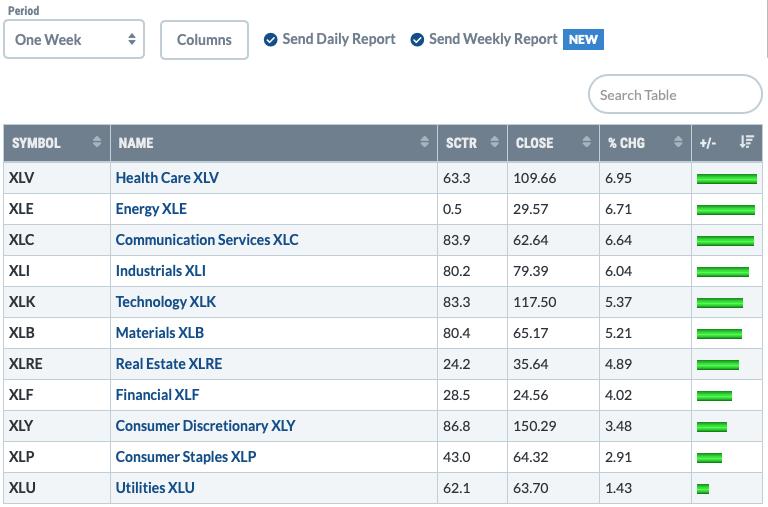
SECTORS
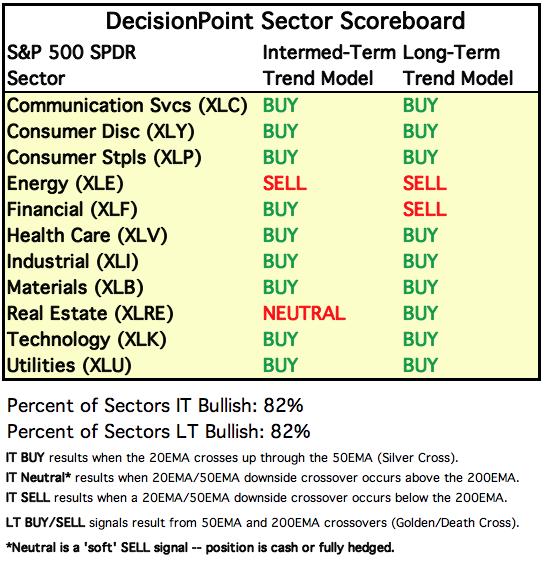
Each S&P 500 Index component stock is assigned to one, and only one, of 11 major sectors. This is a snapshot of the Intermediate-Term (Silver Cross) and Long-Term (Golden Cross) Trend Model signal status for those sectors.
One Week Results:
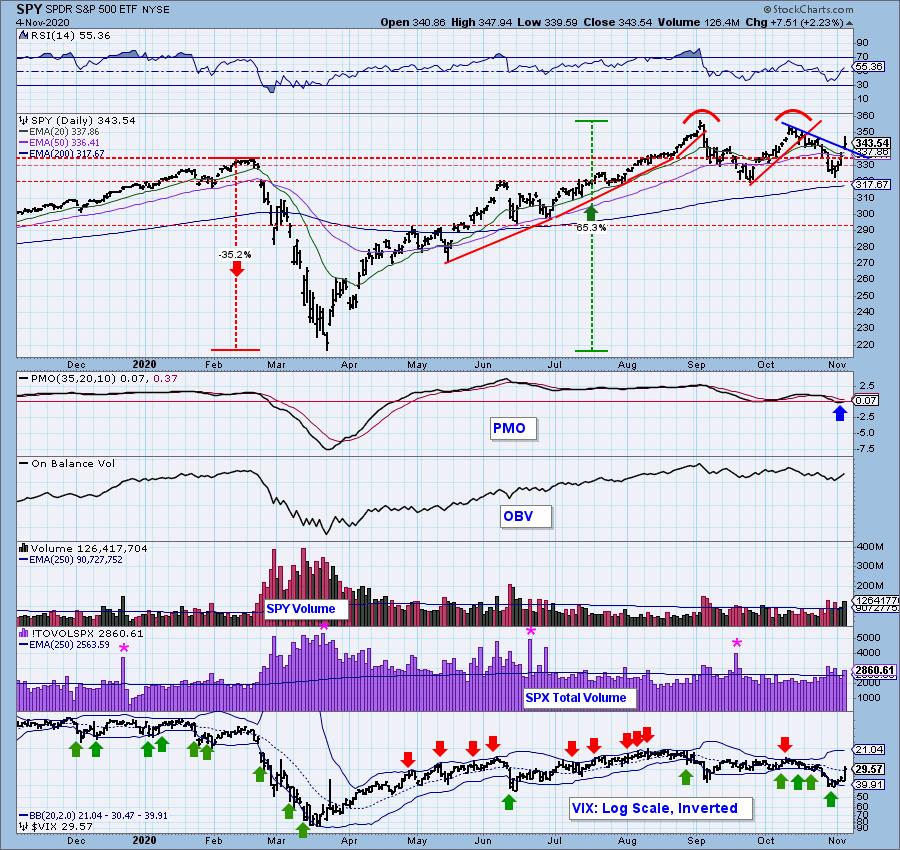
THE MARKET (S&P 500)
IT Trend Model: BUY as of 5/8/2020
LT Trend Model: BUY as of 6/8/2020
SPY Daily Chart: The volume today was climactic on today's gap up. The VIX reading fell mightily as participants seem to be taking a collective sigh of relief. The PMO is now back in positive territory.
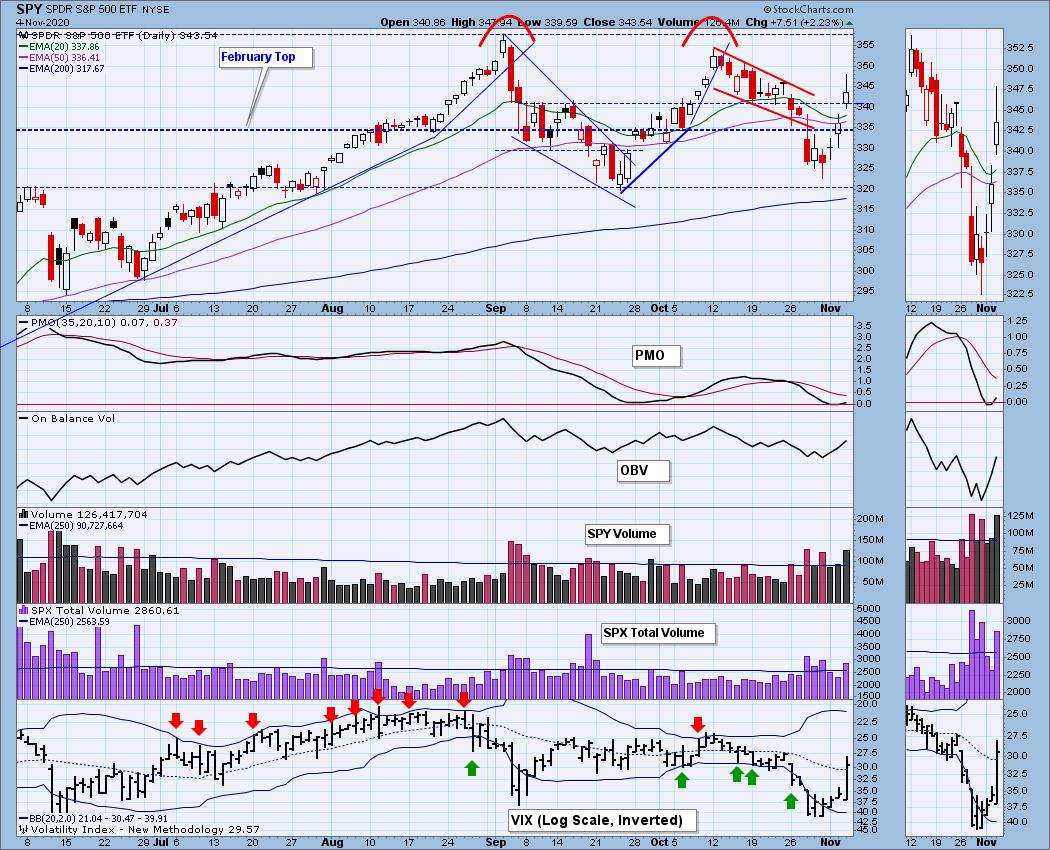
The double-top has now disintegrated as we can see the power move above the declining trendline off the October top. The RSI has now entered positive territory.

It's Free!
***Click here to register for this recurring free DecisionPoint Trading Room on Mondays at Noon ET!***
There was no trading room on 11/2, but did you miss the 10/26 trading room? Here is a link to the recording (access code: X+2gJfpd).
For best results, copy and paste the access code to avoid typos.
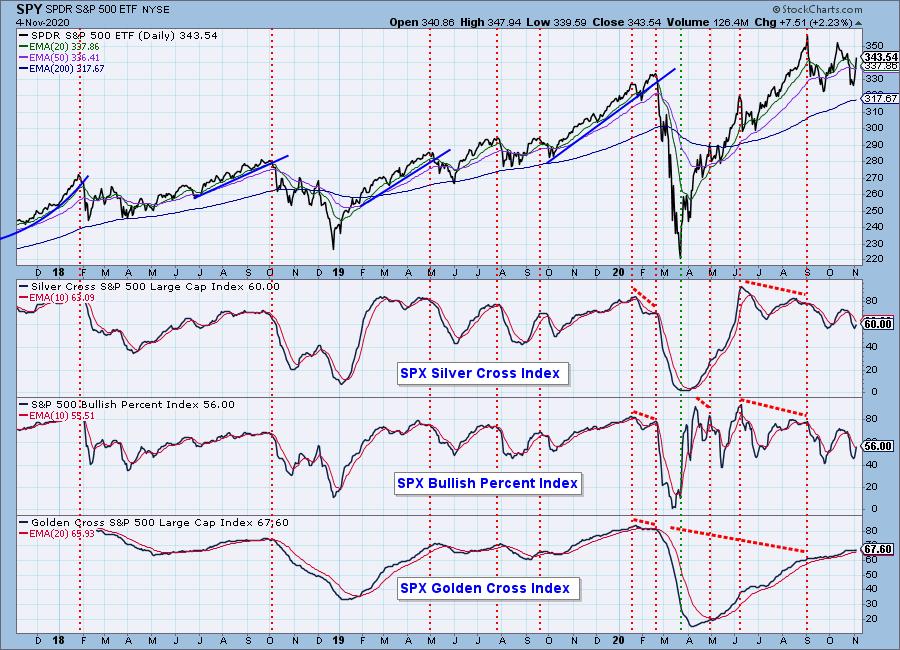
Participation: The following chart uses different methodologies for objectively showing the depth and trend of participation for intermediate- and long-term time frames.
- The Silver Cross Index (SCI) shows the percentage of SPX stocks on IT Trend Model BUY signals (20-EMA > 50-EMA).
- The Golden Cross Index (GCI) shows the percentage of SPX stocks on LT Trend Model BUY signals (50-EMA > 200-EMA).
- The Bullish Percent Index (BPI) shows the percentage of SPX stocks on Point & Figure BUY signals.
The BPI had a positive crossover today which suggests higher prices. The SCI has turned back up which is bullish. The GCI remains flat.
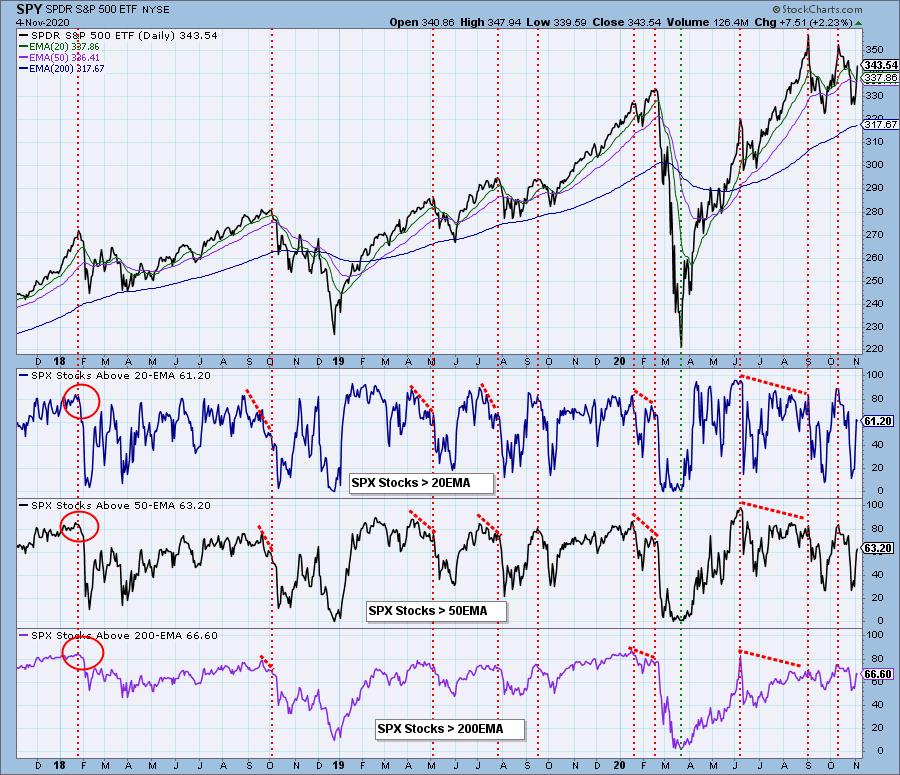
This should bother us. After a strong rally like we had today, we saw fewer stocks with prices above their 20-EMA and barely a rise on %Stocks > 50-EMA.
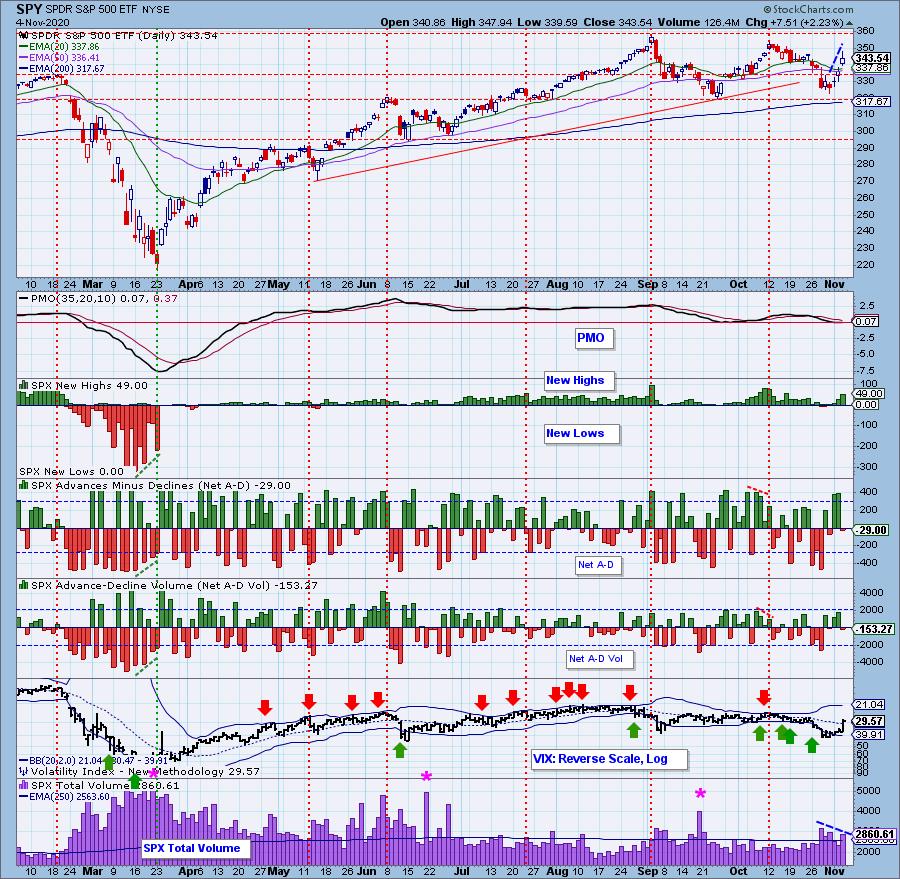
Climactic Market Indicators: Carl and I were expecting to see climactic readings on this chart today. Instead on a rally of 2.23%, we saw NEGATIVE Net A-D and Net A-D Volume. We also can see a declining trend with volume accompanying a very strong rising trend. New Highs were positive but I do not like Net A-D numbers.
Short-Term Market Indicators: Very bullish spikes on the STOs arrived today. But again, those %Stocks indicators should not be accompanying a rally like today's.
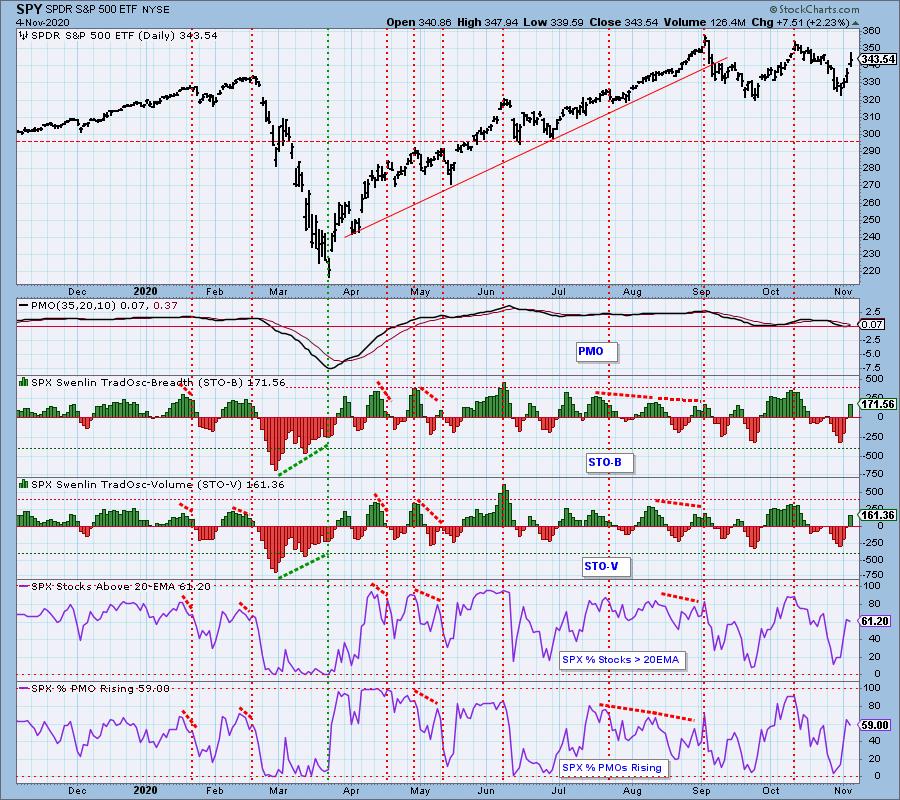
Intermediate-Term Market Indicators: Both of these indicators are rising and we at least have about one-third of SPX stocks with PMO BUY signals.
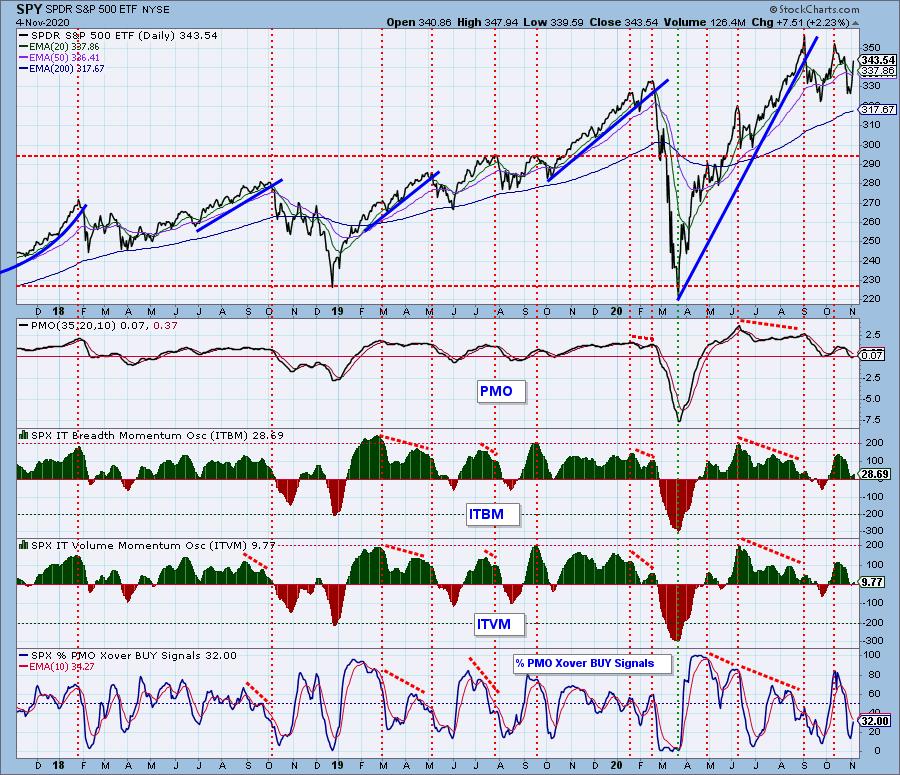
CONCLUSION: It's time to scrap the intermediate-term double-top. It is clear we are now in a trading range. While the bulls enjoyed a very strong rally today, not all stocks participated. A gain of 2.23% on the SPY should have given us positive Net A-D numbers at the very least and it failed to. This looks like a possible buying exhaustion based on the lack of participation. However, the STOs moved quickly higher; rising STOs usually lead to higher prices.
Have you subscribed the DecisionPoint Diamonds yet? DP does the work for you by providing handpicked stocks/ETFs from exclusive DP scans! Add it with a discount! Contact support@decisionpoint.com for more information!
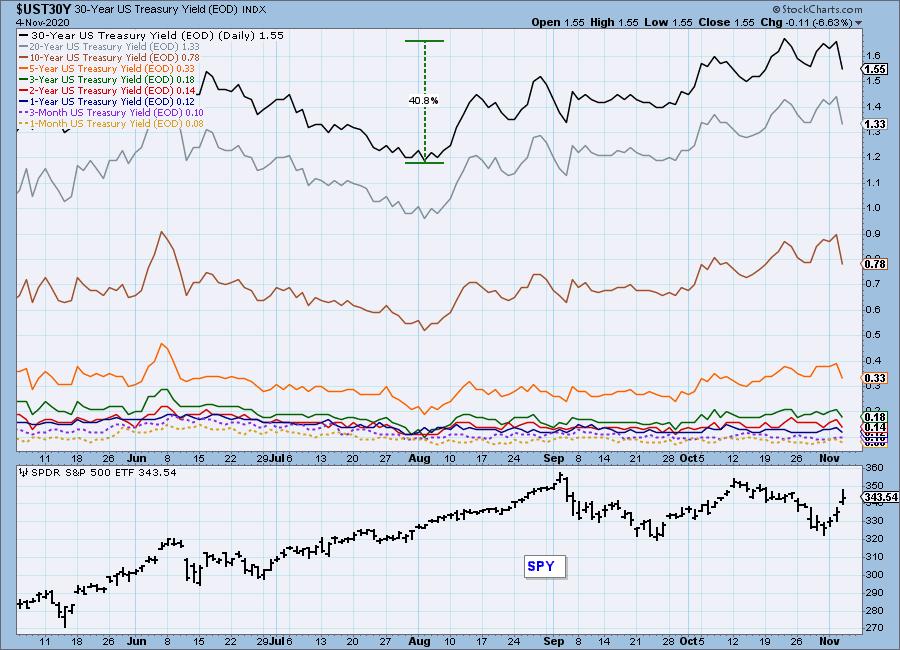
INTEREST RATES
This chart is included so we can monitor rate inversions. In normal circumstances the longer money is borrowed the higher the interest rate that must be paid. When rates are inverted, the reverse is true.
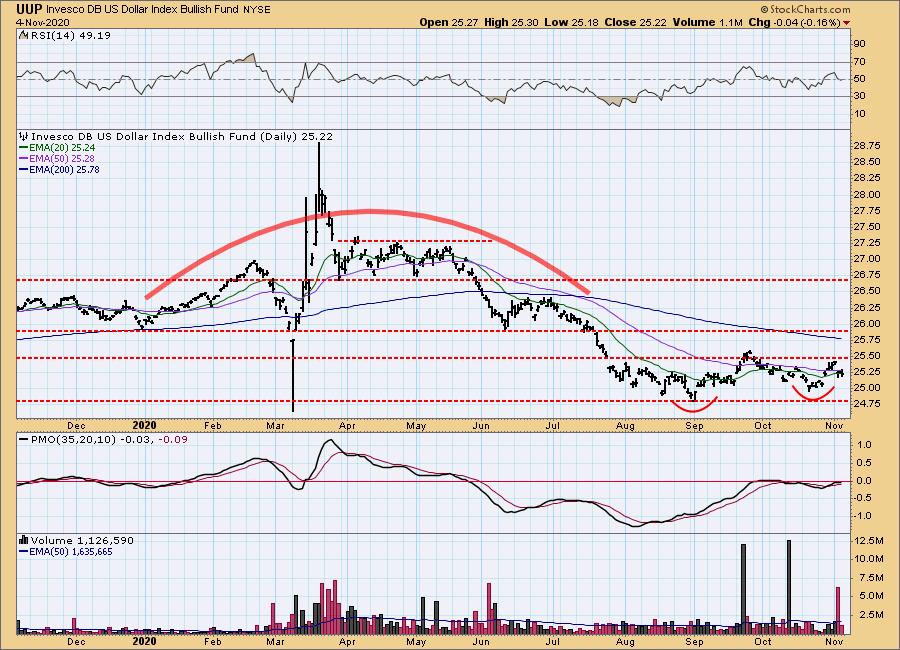
DOLLAR (UUP)
IT Trend Model: NEUTRAL as of 5/28/2020
LT Trend Model: SELL as of 7/10/2020
UUP Daily Chart: A double-bottom is still a possible pattern, but seeing price stopped at $25.50 and a decline below the 20/50-EMAs, we will likely see more sideways movement rather than a breakout to confirm a double-bottom.
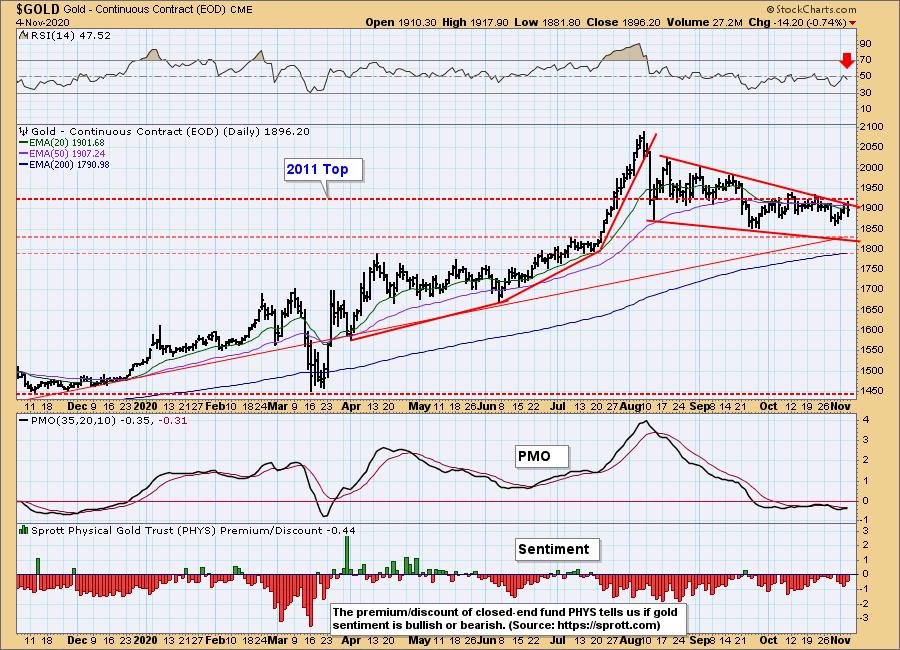
GOLD
IT Trend Model: NEUTRAL as of 10/14/2020
LT Trend Model: BUY as of 1/8/2019
GOLD Daily Chart: Gold continues to be stuck under overhead resistance at the top of the bullish falling wedge and the 20/50-EMAs. The PMO is flat, but the RSI is negative. I would look for a decline before a breakout.
Full disclosure: I own GLD.
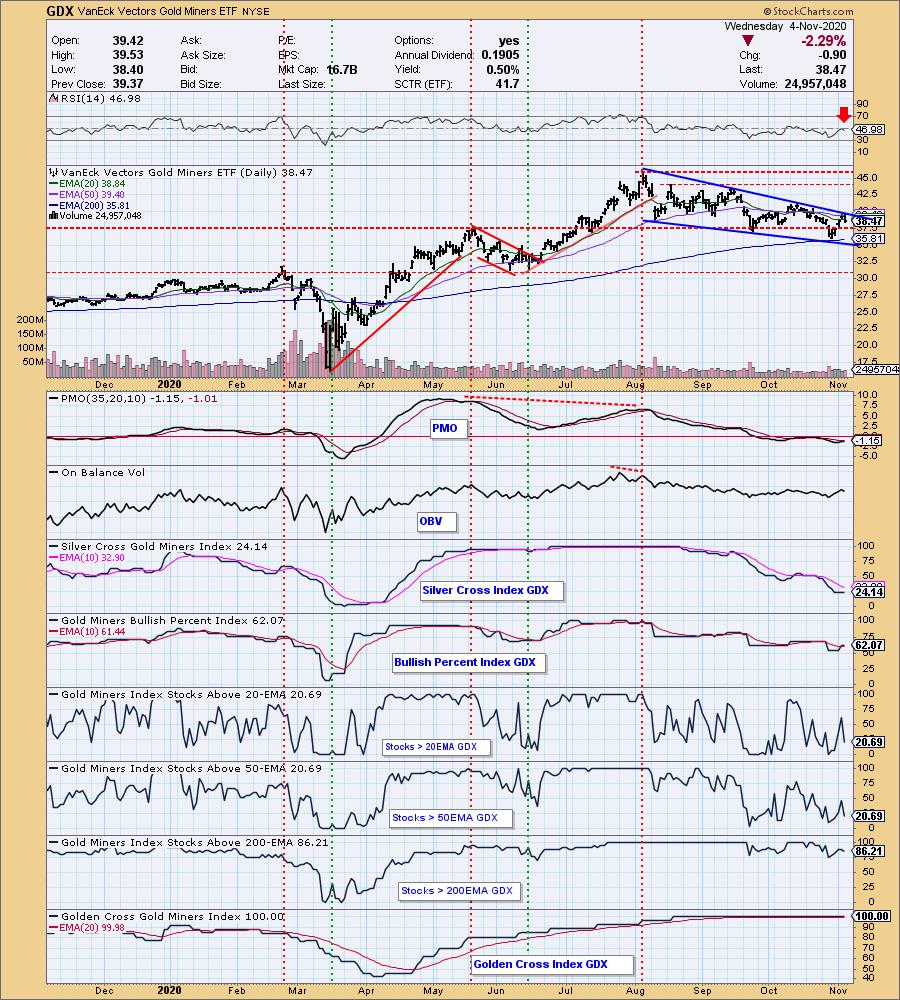
GOLD MINERS Golden and Silver Cross Indexes: Miners are mimicking Gold right now as they struggle to break from a bullish falling wedge. Price continues to get stuck at the top of the pattern and cannot sustain a move above the 20/50-EMAs. The RSI turned down before reaching positive territory, but we did see a positive crossover on the BPI. The pullback on %Stocks > 20/50-EMAs has put these indicators back in oversold territory.
CRUDE OIL (USO)
IT Trend Model: SELL as of 9/8/2020
LT Trend Model: SELL as of 2/3/2020
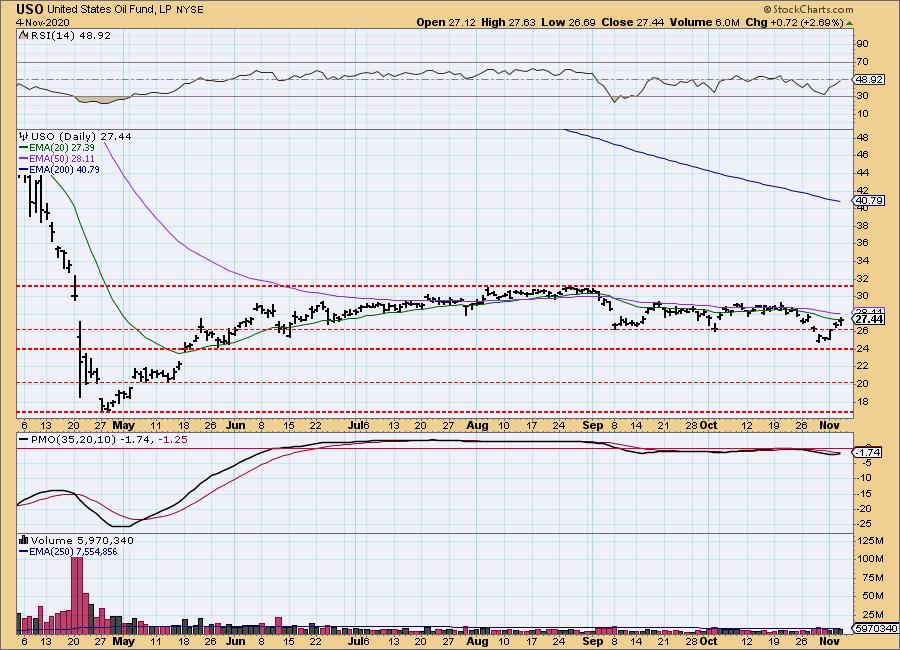
USO Daily Chart: Yesterday's comments still apply:
"Oil continued to rally today which has put price back above resistance at the September low. Now it must contend with the EMAs. The RSI is rising and the PMO is turning up as well. I expect to see Oil continue to move sideways in this large trading range between $31 and $24."
BONDS (TLT)
IT Trend Model: NEUTRAL as of 8/27/2020
LT Trend Model: BUY as of 1/2/2019
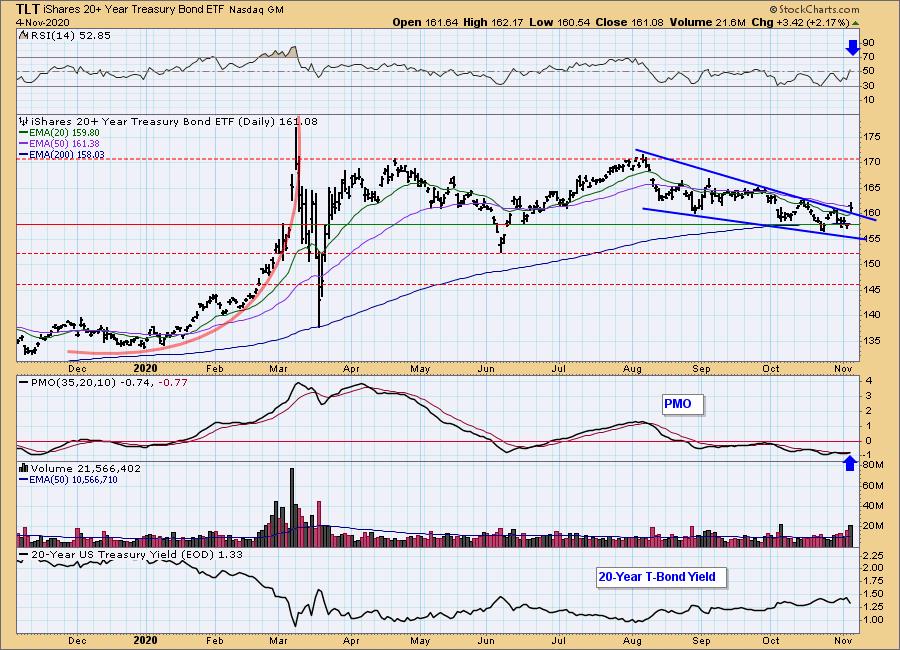
TLT Daily Chart: Here we have a falling wedge that has been confirmed with today's breakout. The RSI has turned positive and the PMO triggered a crossover BUY signal. Bonds are looking very bullish right now. As an aside, when I ran some of my scans for the DP Diamonds Report today, I had numerous Bond ETFs come up as "momentum sleepers".
Full Disclosure: I own TLT.
Technical Analysis is a windsock, not a crystal ball.
Happy Charting! - Erin
Disclaimer: This blog is for educational purposes only and should not be construed as financial advice. The ideas and strategies should never be used without first assessing your own personal and financial situation, or without consulting a financial professional. Any opinions expressed herein are solely those of the author, and do not in any way represent the views or opinions of any other person or entity.
NOTE: The signal status reported herein is based upon mechanical trading model signals, specifically, the DecisionPoint Trend Model. They define the implied bias of the price index based upon moving average relationships, but they do not necessarily call for a specific action. They are information flags that should prompt chart review. Further, they do not call for continuous buying or selling during the life of the signal. For example, a BUY signal will probably (but not necessarily) return the best results if action is taken soon after the signal is generated. Additional opportunities for buying may be found as price zigzags higher, but the trader must look for optimum entry points. Conversely, exit points to preserve gains (or minimize losses) may be evident before the model mechanically closes the signal.
Helpful DecisionPoint Links:
DecisionPoint Alert Chart List
DecisionPoint Golden Cross/Silver Cross Index Chart List
DecisionPoint Sector Chart List
Price Momentum Oscillator (PMO)