
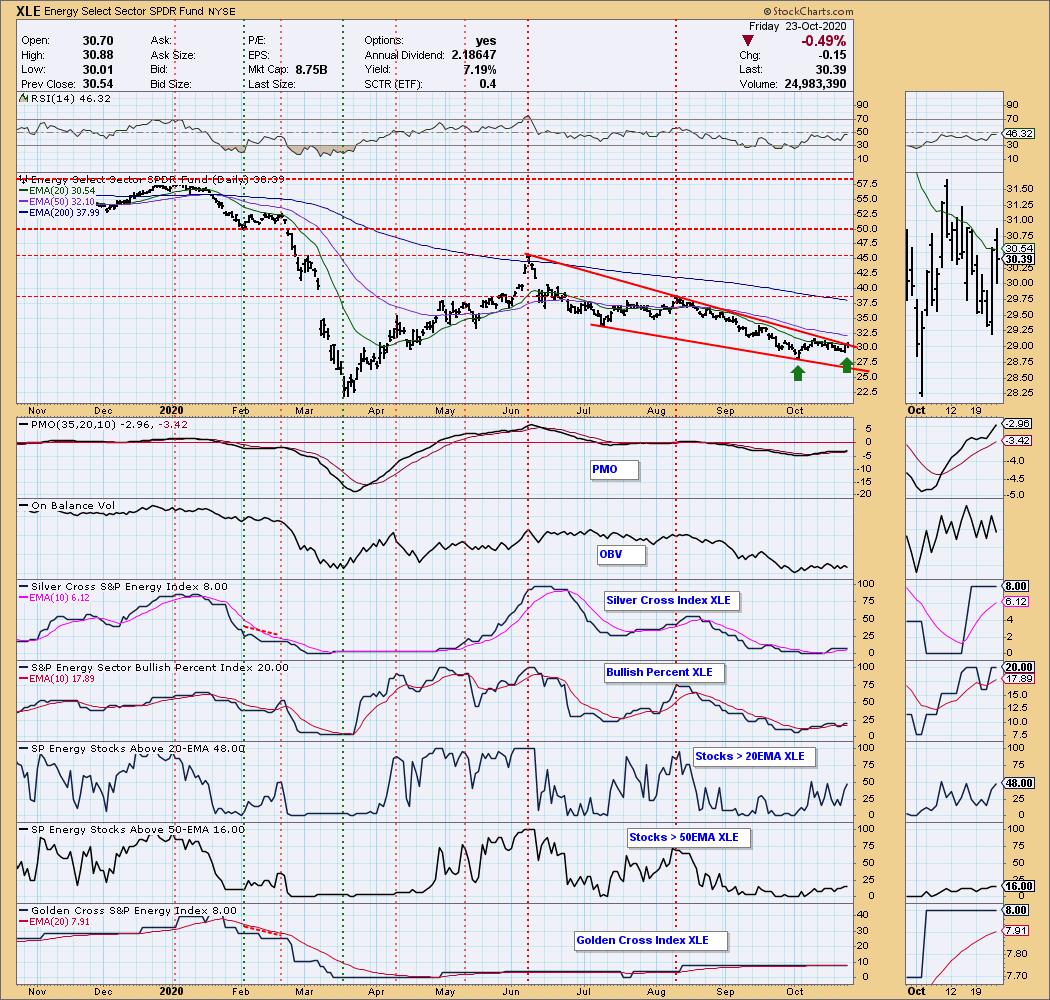
This week the Energy Sector tried mightily to break out of the bullish falling wedge formation with a potential double bottom as leverage. It didn't quite make it, but the sector is coming off very oversold readings on most of the indicators shown. With the economy improving, increased demand is a given. We see reasonable upside potential to be the August top (+25%) or the June top (+47%). No guarantees, of course.
The DecisionPoint Alert Weekly Wrap presents an end-of-week assessment of the trend and condition of the Stock Market, the U.S. Dollar, Gold, Crude Oil, and Bonds. The DecisionPoint Alert daily report (Monday through Thursday) is abbreviated and gives updates on the Weekly Wrap assessments.
Watch the latest episode of DecisionPoint on StockCharts TV's YouTube channel here!
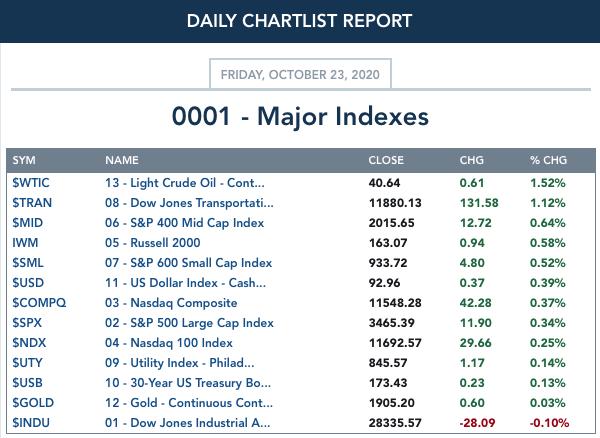
MAJOR MARKET INDEXES
So that we are consistent with the Monday through Thursday DPAs, we have decided to stick with a daily, rather than weekly, report.
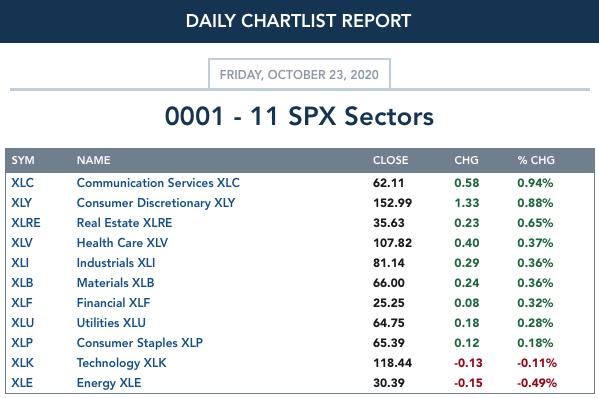
SECTORS
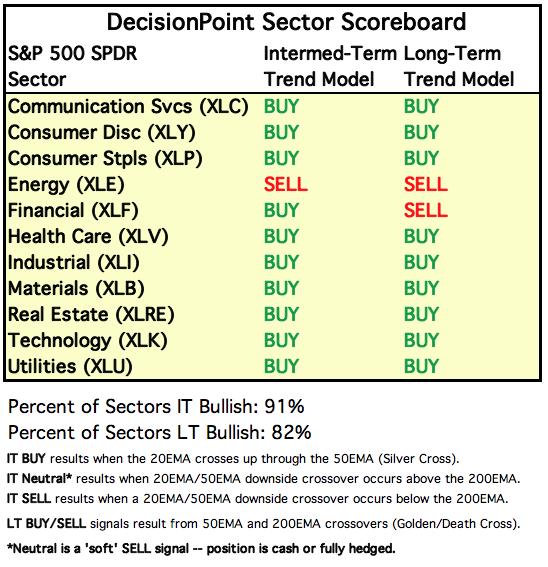
Each S&P 500 Index component stock is assigned to one, and only one, of 11 major sectors. This is a snapshot of the Intermediate-Term (Silver Cross) and Long-Term (Golden Cross) Trend Model signal status for those sectors.
THE MARKET (S&P 500)
IT Trend Model: BUY as of 5/8/2020
LT Trend Model: BUY as of 6/8/2020
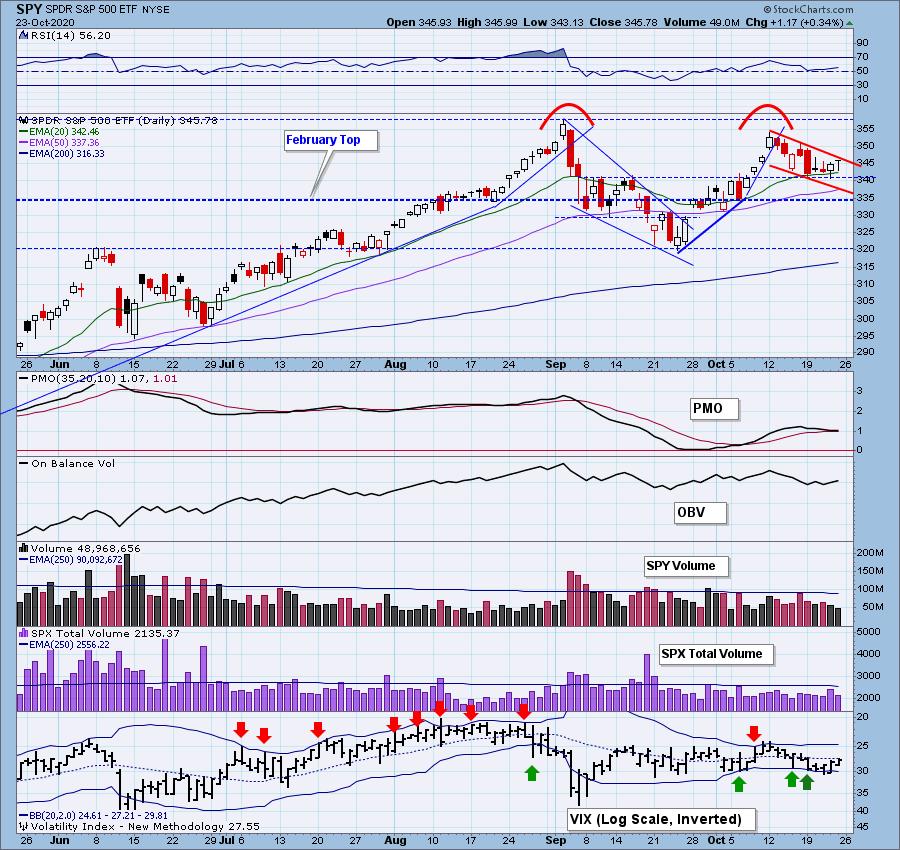
SPY Daily Chart: The market was up today but wasn't able to push out of the short-term declining trend channel. This trend channel could be interpreted as the flag on a flagpole in the short term. However, note in the intermediate term this could be the leg down to finish forming a double-top. The RSI is positive and the PMO is currently clinging to a BUY signal. Total volume shrunk on today's rally which tells us there is a lack of conviction in this rally.
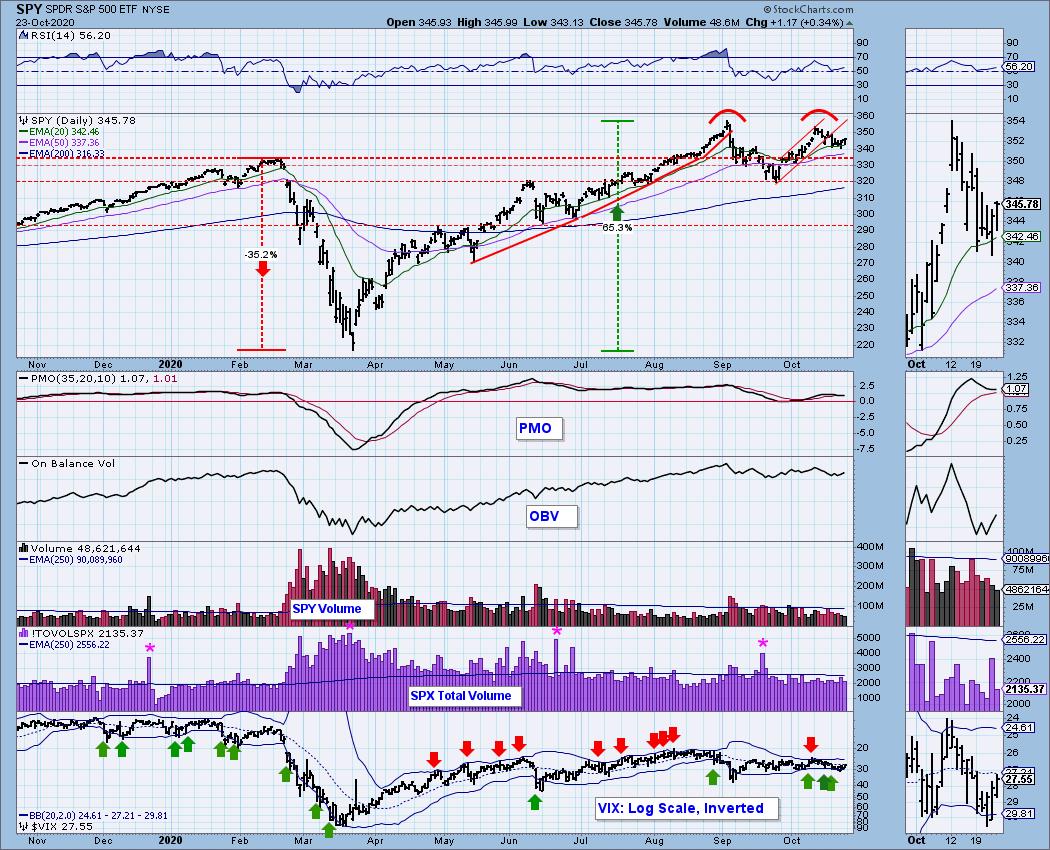
The double-top that could be forming is more clear on the 1-year chart.
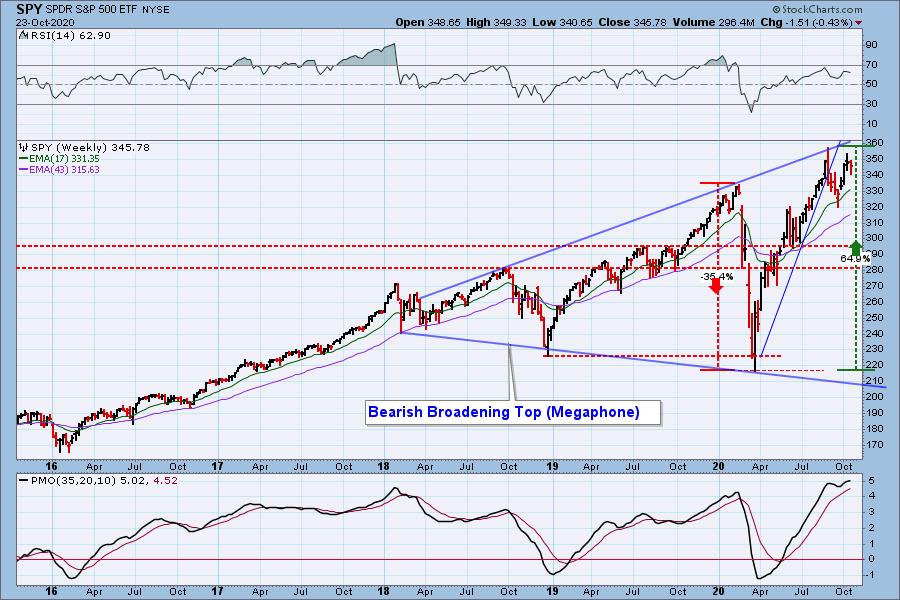
SPY Weekly Chart: The long-term chart doesn't inspire confidence. We have a very large broadening top or "megaphone". These are bearish patterns as they show more and more volatility in price. The September and October tops show a declining trend. Price was not able to challenge the top of the megaphone this month. That is bearish.
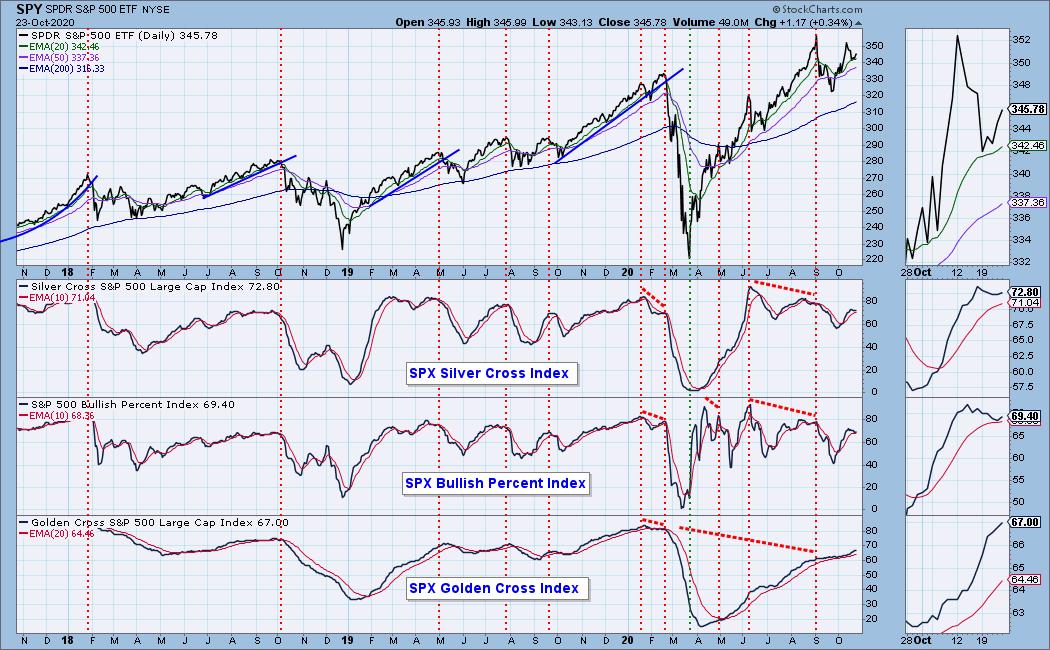
Participation: The following chart uses different methodologies for objectively showing the depth and trend of participation for intermediate- and long-term time frames.
- The Silver Cross Index (SCI) shows the percentage of SPX stocks on IT Trend Model BUY signals (20-EMA > 50-EMA).
- The Golden Cross Index (GCI) shows the percentage of SPX stocks on LT Trend Model BUY signals (50-EMA > 200-EMA).
- The Bullish Percent Index (BPI) shows the percentage of SPX stocks on Point & Figure BUY signals.
The BPI and SCI turned up today above their signal lines which is positive. However, we have confirming declining tops on both those indicators. The GCI continues higher. We do not like that after this 60%+ move out of the bear market lows, the GCI has not been able to challenge its previous top.
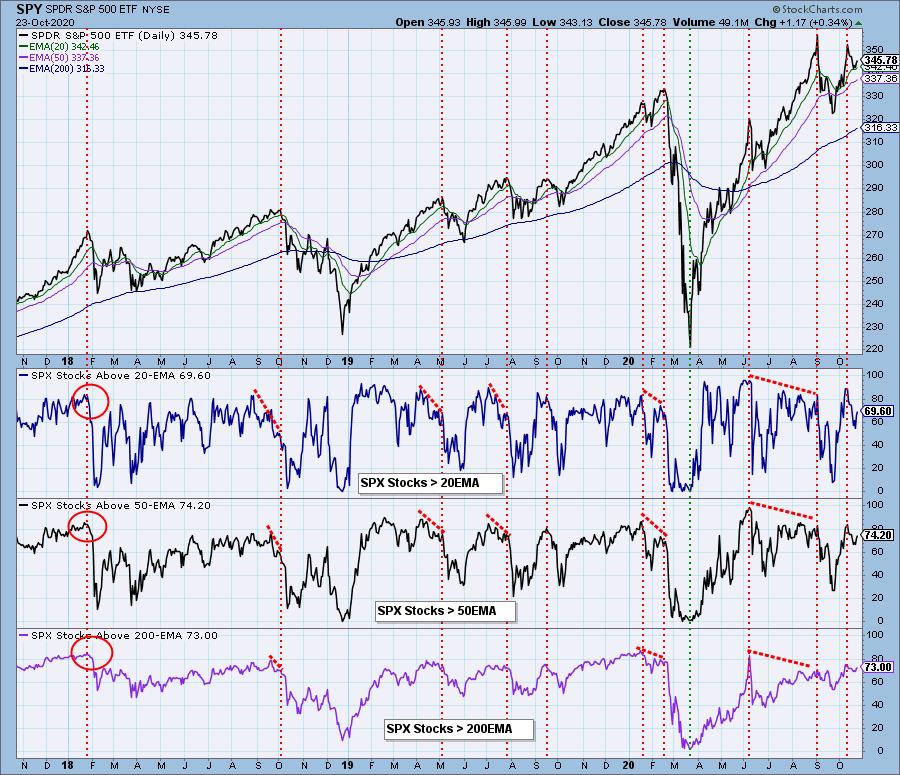
The SPY was down for the week, but we did see an expansion in %Stocks above their 20/50/200-EMAs.
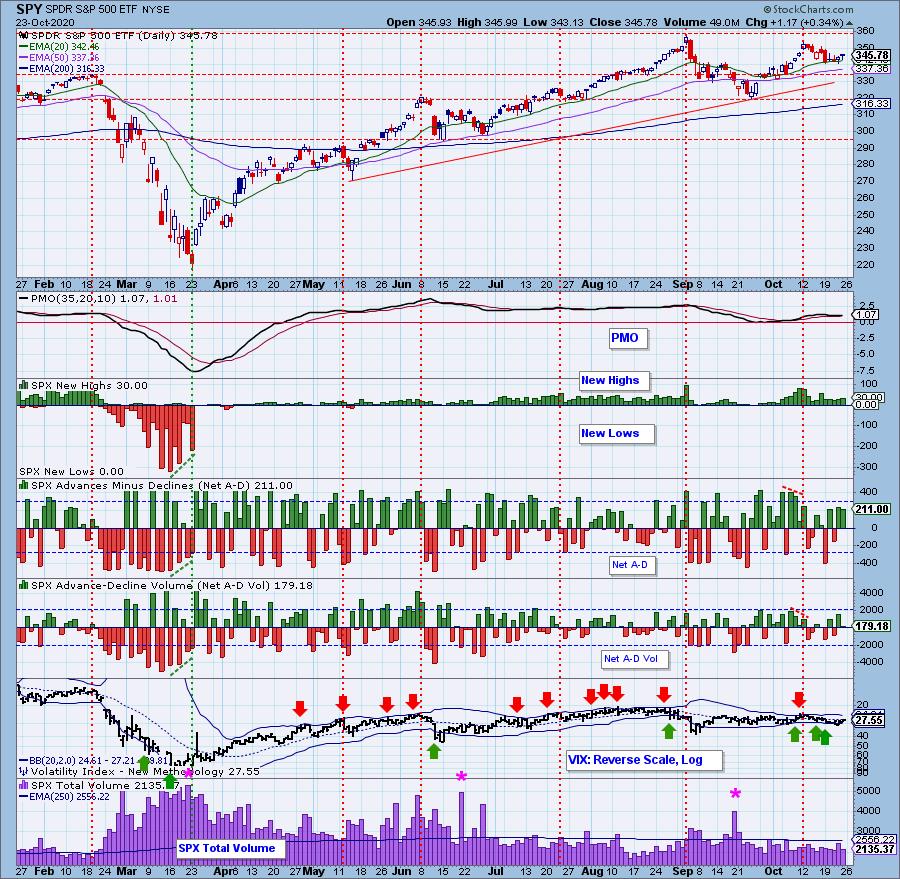
Climactic Market Indicators: No climactic readings today. At the beginning of the week we saw a selling exhaustion. New Highs have been rising. Net A-D numbers are lower today on a follow-on rally. The VIX is still below its EMA on the inverted scale which suggests weakness.
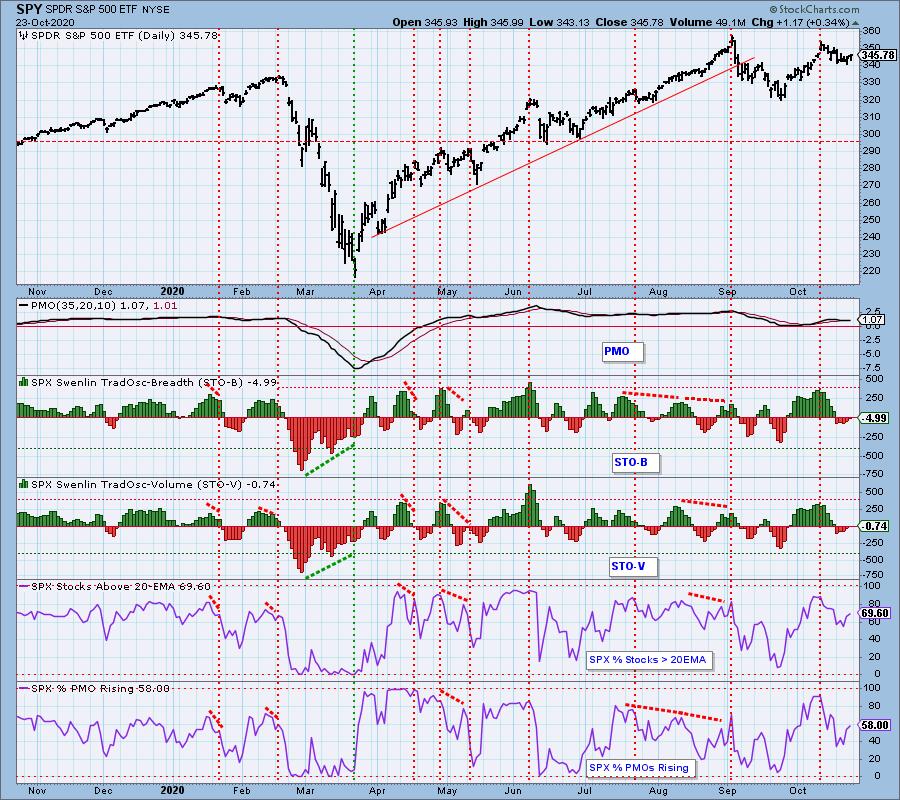
Short-Term Market Indicators: The short-term market trend is DOWN and the condition is NEUTRAL. The STOs spent most of the week in negative territory. It is good that they are rising.
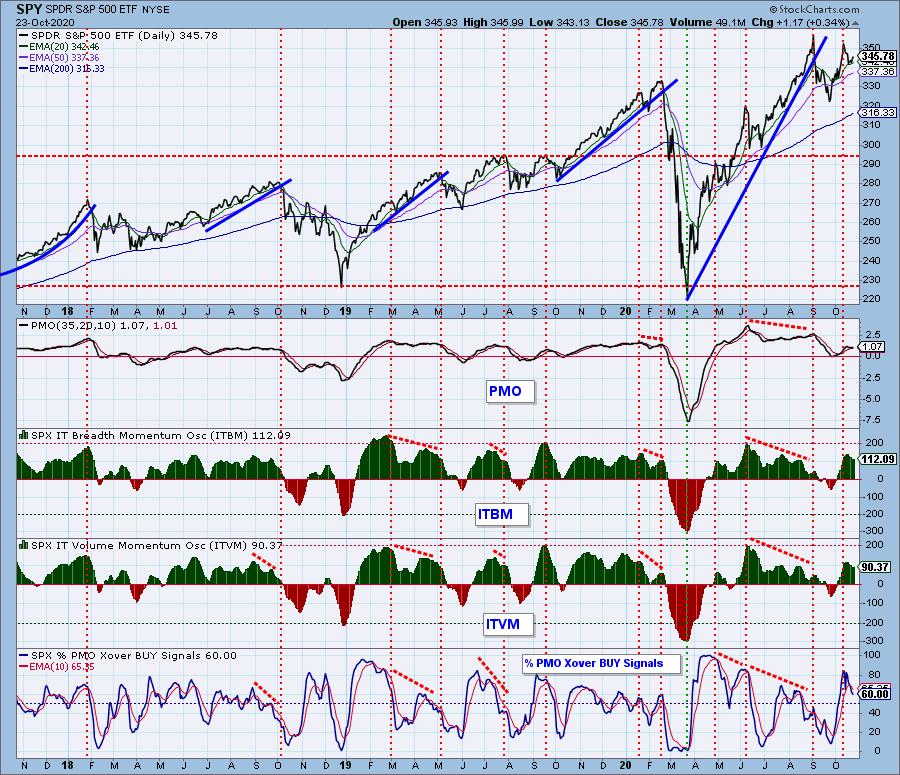
Intermediate-Term Market Indicators: The intermediate-term market trend is UP and the condition is OVERBOUGHT. The market bias is BULLISH. We have overbought readings on the ITBM/ITVM. They declined all week until today's rally. Their rise was minimal, it's barely visible on the chart. The PMO crossover BUY signals dropped this week.
CONCLUSION: There are short-term bullish indicators suggesting a breakout from this declining trend channel. Conversely we have a PMO SELL signal on tap and a loss of momentum in SP500 components. In order to break out of the declining trend channel, the SPY will need components with increasing momentum not losing momentum. While there is a short-term bullish flag on the SPY, there is the menacing intermediate-term double-top forming.
Have you subscribed the DecisionPoint Diamonds yet? DP does the work for you by providing handpicked stocks/ETFs from exclusive DP scans! Add it with a discount! Contact support@decisionpoint.com for more information!
INTEREST RATES
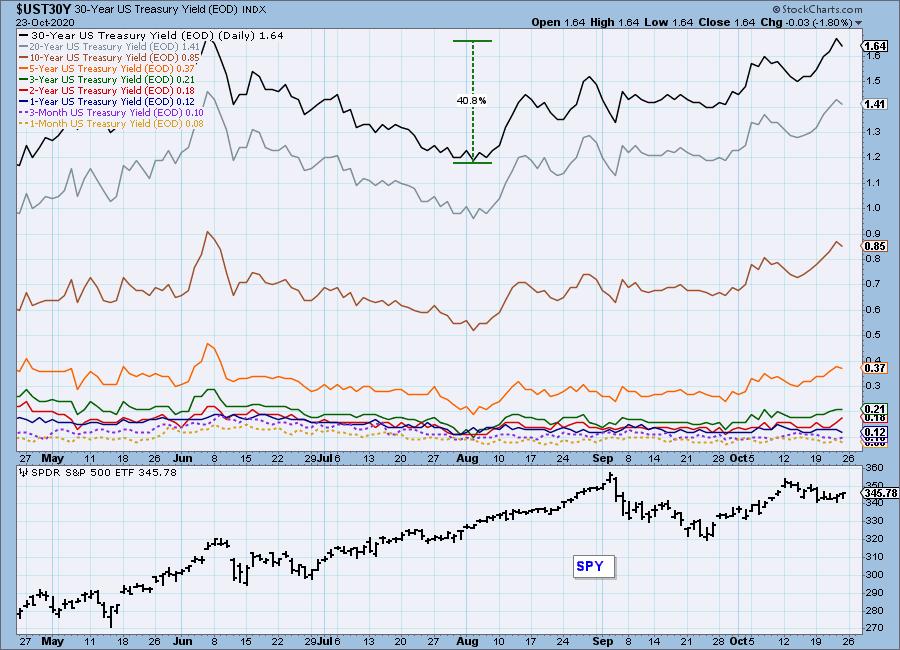
It is clear that rates are trending higher. The 30-year bond yield has risen less than a half of a percentage point, but it's a 40% increase from the August low! We were surprised to hear a pundit on a business show say that we are in a rising rate environment. Easy to miss with rates so low, but the chart confirms it.
DOLLAR (UUP)
IT Trend Model: NEUTRAL as of 5/28/2020
LT Trend Model: SELL as of 7/10/2020
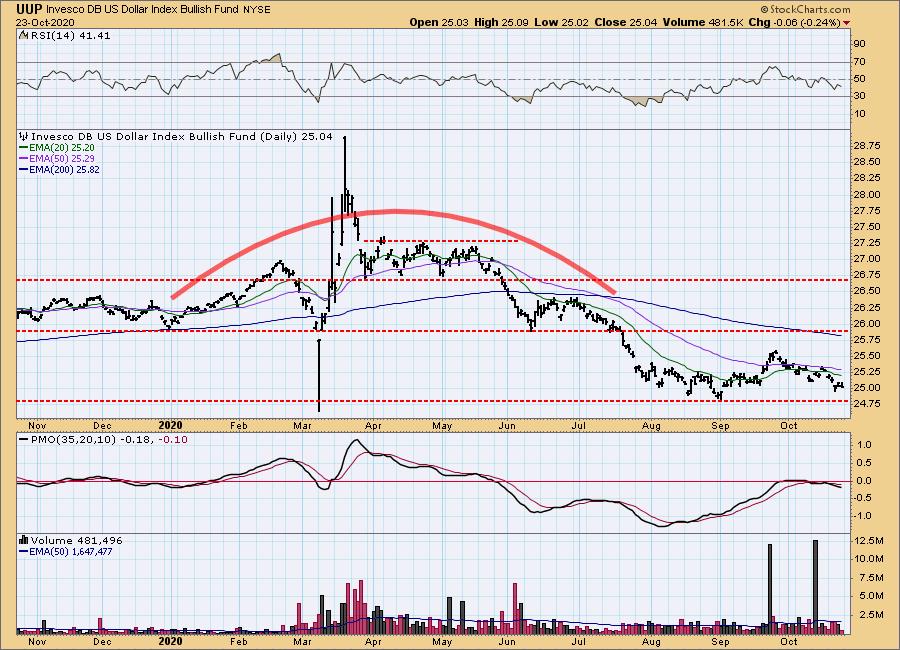
UUP Daily Chart: We had been following a saucer with handle on this chart, but price has dipped far below the top of the saucer, and we have given up on that bullish formation. The three EMAs are negatively stacked, and the daily PMO is below the zero line and signal line, and it is falling.
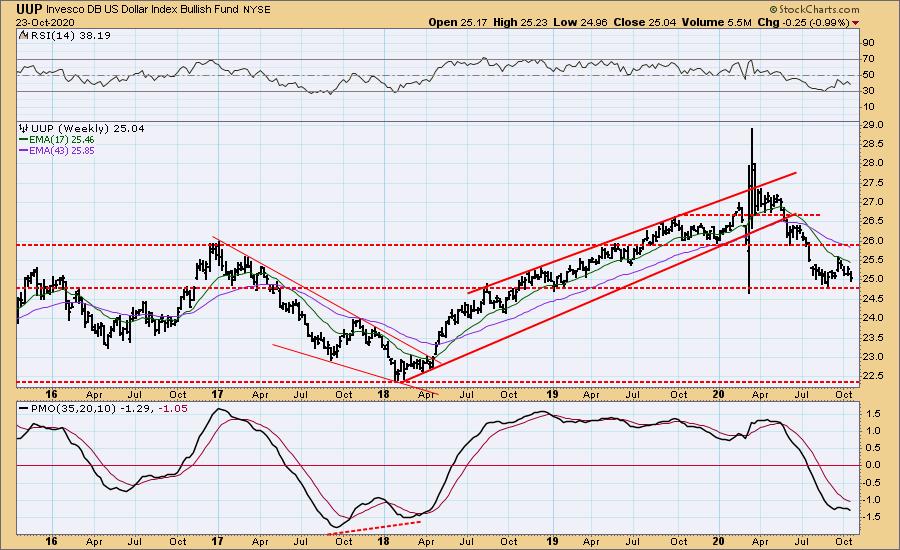
UUP Weekly Chart: The weekly PMO is oversold, but it is still falling. Price seems to be headed toward a retest of last quarter's low.
GOLD
IT Trend Model: NEUTRAL as of 10/23/2020
LT Trend Model: BUY as of 1/8/2019
GOLD Daily Chart: Today the 20EMA crossed back down through the 50EMA, resulting in an IT Trend Model signal change from BUY to NEUTRAL. Gold is correcting within a bullish falling wedge. The immediate technical problem is that sideways price movement has the 20EMA and 50EMA following almost identical paths. As a result, we're getting a lot of whipsaw crossovers, causing frequent IT Trend Model signal changes. We'll record the signals, but we really need to keep looking for an obvious change in trend.
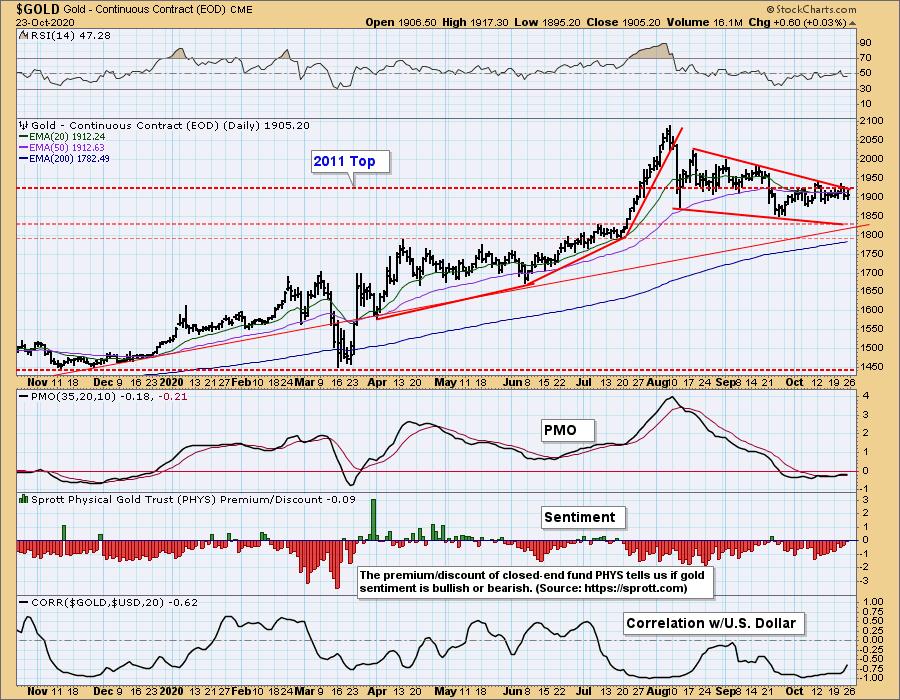
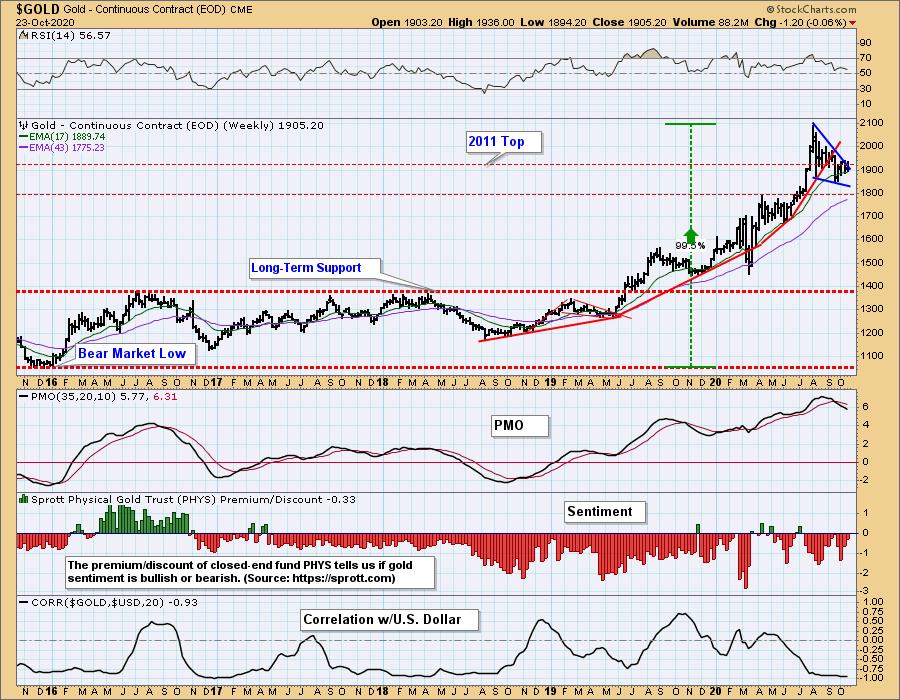
GOLD Weekly Chart: Gold is experiencing a a much needed correction following a near-vertical advance this summer. We'd like to see it consolidate a bit longer, but gold tends to be inversely correlated with the dollar, and current dollar weakness may push gold higher sooner than we expect.
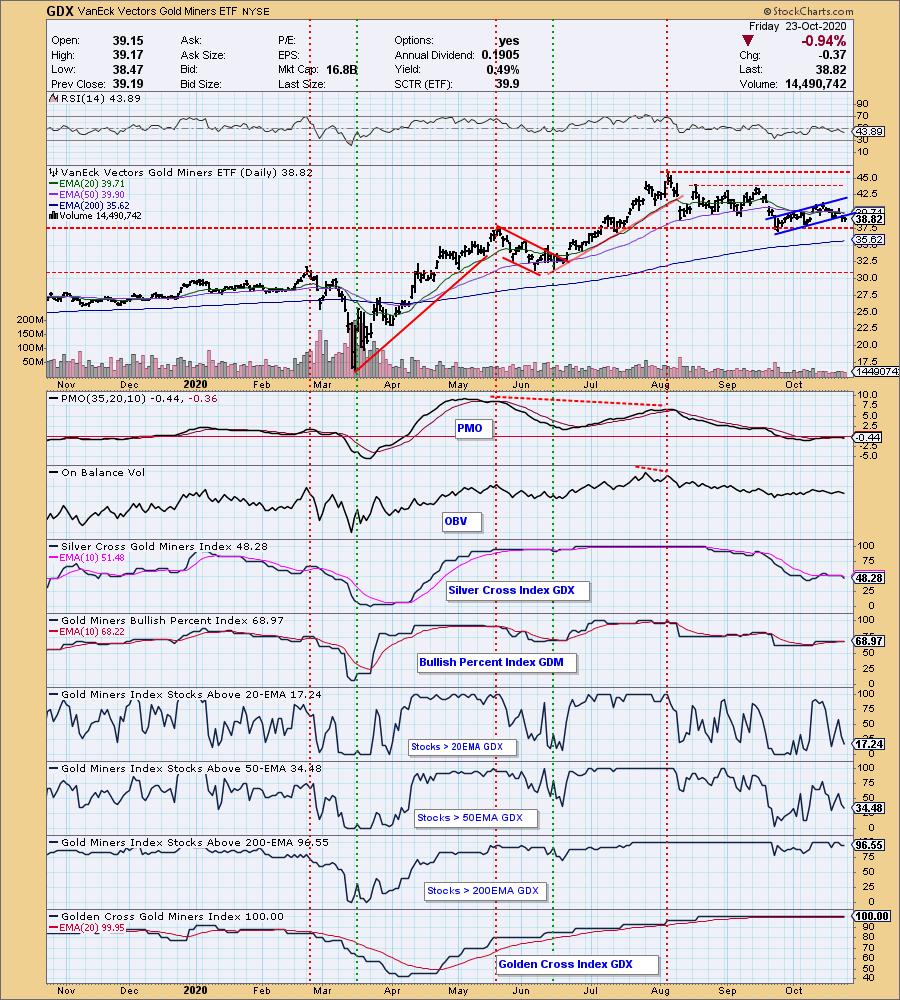
GOLD MINERS Golden and Silver Cross Indexes: GDX was beginning to form a rising trend channel, but it was broken yesterday. Good news is that support at $37.50 is nearby. The RSI is negative and the PMO has turned down below the zero line. If Gold does make a resurgence on the Dollar's weakness, Gold Miners will have the wind at their back. They will need it if the market cannot break out from its declining trend channel.
CRUDE OIL (USO)
IT Trend Model: SELL as of 9/8/2020
LT Trend Model: SELL as of 2/3/2020
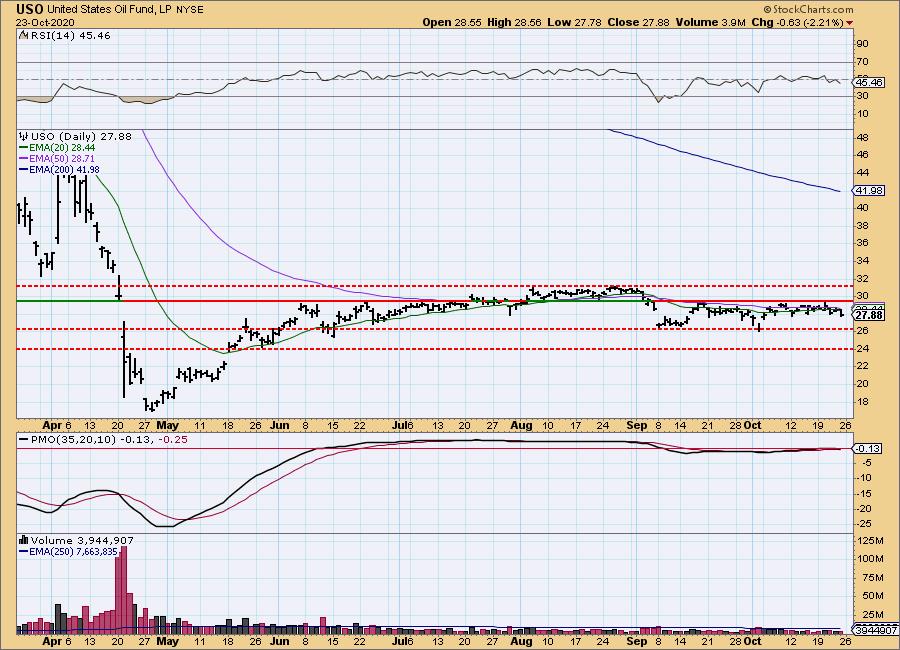
USO Daily Chart: Oil prices were hit hard, but as we discussed in the opening, demand could see an increase as states begin to reopen again. Overhead resistance lies just under $30 with support at $26. The PMO is negative but still above its signal line, for the moment. The RSI is negative and falling.
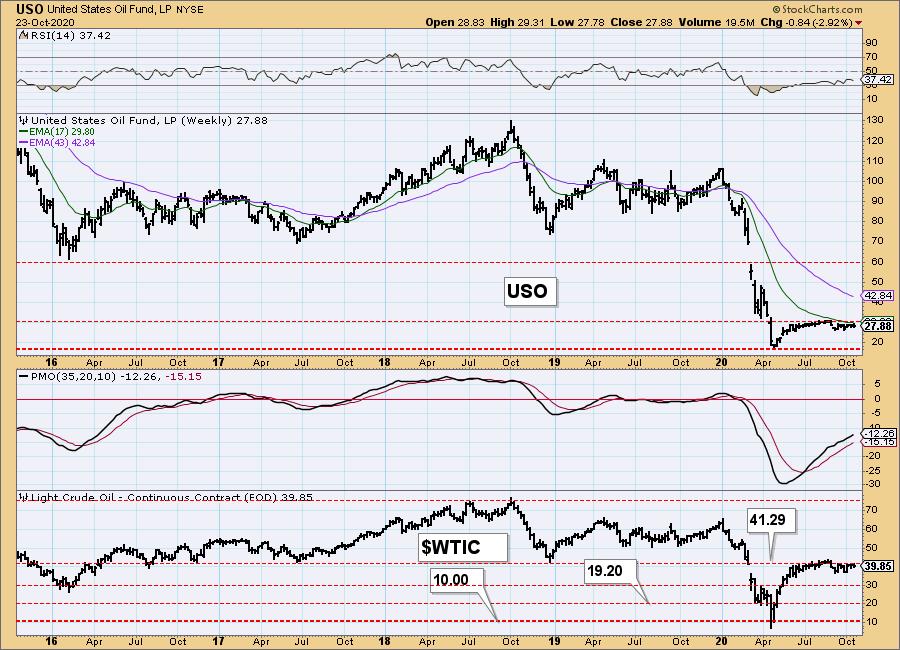
USO/$WTIC Weekly Chart: Overhead resistance is clear, as is support on the weekly chart. Oil is in a holding pattern until demand begins to increase. The RSI is negative and somewhat oversold. The weekly PMO is rising. Price is stymied by the 17-week EMA as well.
BONDS (TLT)
IT Trend Model: NEUTRAL as of 8/27/2020
LT Trend Model: BUY as of 1/2/2019
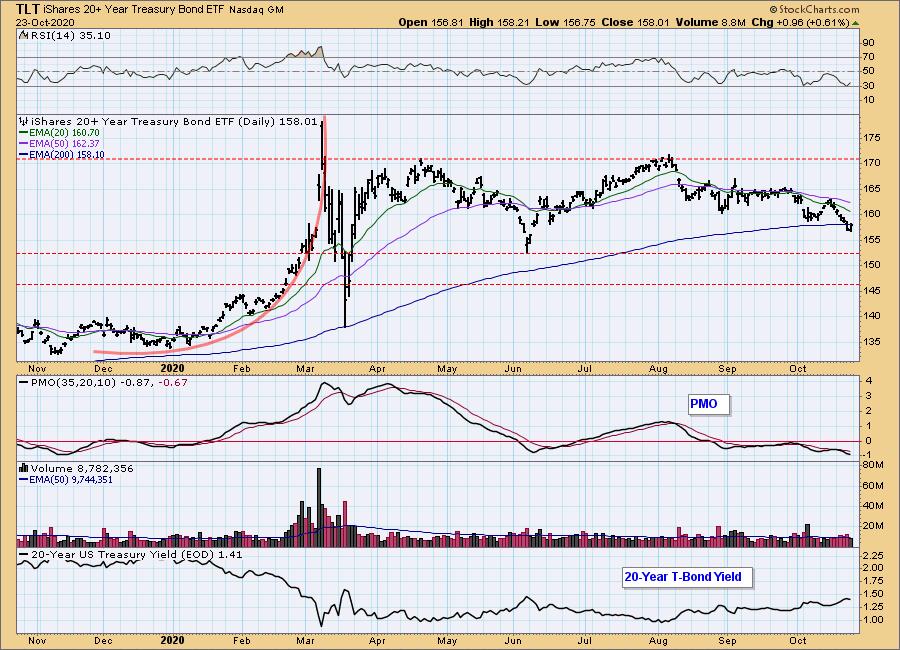
TLT Daily Chart: TLT broke down yesterday below its 200-EMA. Despite a rally today price closed below the 200-EMA. As noted in the yield array, yields are rising and that will mean lower prices on Bonds. We'll be watching support at the June low.
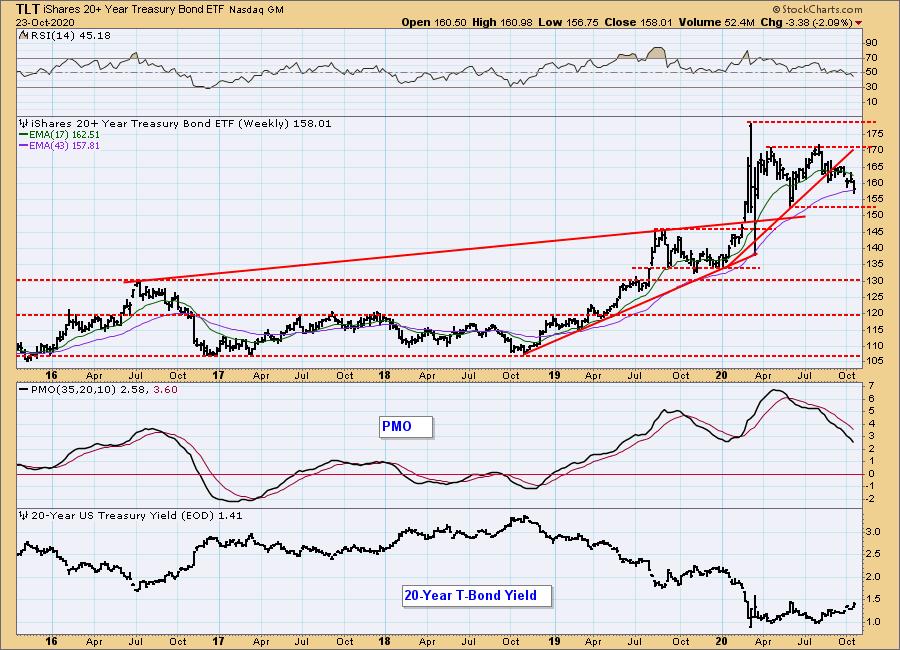
TLT Weekly Chart: The weekly chart shows an RSI that is negative, falling and not at all oversold. The weekly PMO is falling. Price also popped below the 43-week EMA this week, although it did close above it. We could be looking at a double-top in the longer term with the mid-year low as the confirmation line. Bonds will need to hold that level or we could be looking at a much larger decline.
Technical Analysis is a windsock, not a crystal ball.
-- Carl Swenlin & Erin Swenlin
__________________
Our job is not to see the future, it is to see the present very clearly.
-- Jawad Mian, stray-reflections.com
Disclaimer: This blog is for educational purposes only and should not be construed as financial advice. The ideas and strategies should never be used without first assessing your own personal and financial situation, or without consulting a financial professional. Any opinions expressed herein are solely those of the author, and do not in any way represent the views or opinions of any other person or entity.
NOTE: The signal status reported herein is based upon mechanical trading model signals, specifically, the DecisionPoint Trend Model. They define the implied bias of the price index based upon moving average relationships, but they do not necessarily call for a specific action. They are information flags that should prompt chart review. Further, they do not call for continuous buying or selling during the life of the signal. For example, a BUY signal will probably (but not necessarily) return the best results if action is taken soon after the signal is generated. Additional opportunities for buying may be found as price zigzags higher, but the trader must look for optimum entry points. Conversely, exit points to preserve gains (or minimize losses) may be evident before the model mechanically closes the signal.
Helpful DecisionPoint Links:
DecisionPoint Alert Chart List
DecisionPoint Golden Cross/Silver Cross Index Chart List
DecisionPoint Sector Chart List
Price Momentum Oscillator (PMO)
Swenlin Trading Oscillators (STO-B and STO-V)
