
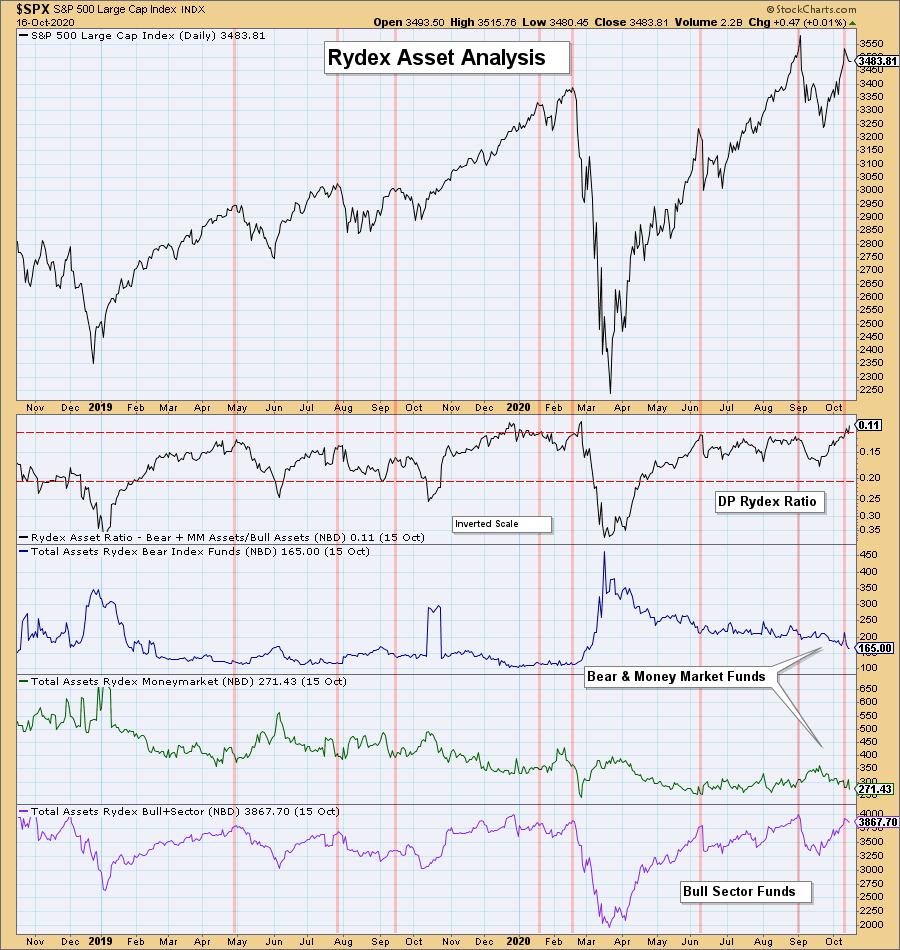
We haven't looked at the Rydex Ratio chart lately. This measures sentiment based on tracking assets in bear funds, money markets and bull funds from a group of mutual funds that used to be offered by Rydex; now Guggenheim manages them. We have heard rumblings of market participants beginning to "feel" bearish about the market. That is typically pulled from polling data.
However, Rydex Asset Analysis is different. It's a "money where your mouth is" indicator. A look at the chart below says market participants are not getting bearish. Assets are growing in the bull funds and are steadily being pulled or lost from bear funds and money markets. Participants are clearly still bullish. Notice the Rydex Ratio is now very overbought. The chart is annotated with major market tops. Overbought conditions on the Rydex Ratio is bearish.
The DecisionPoint Alert Weekly Wrap presents an end-of-week assessment of the trend and condition of the Stock Market, the U.S. Dollar, Gold, Crude Oil, and Bonds. The DecisionPoint Alert daily report (Monday through Thursday) is abbreviated and gives updates on the Weekly Wrap assessments.
Watch the latest episode of DecisionPoint on StockCharts TV's YouTube channel here!
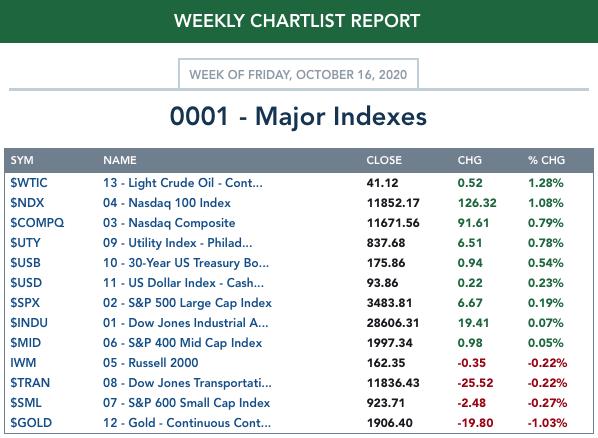
MAJOR MARKET INDEXES
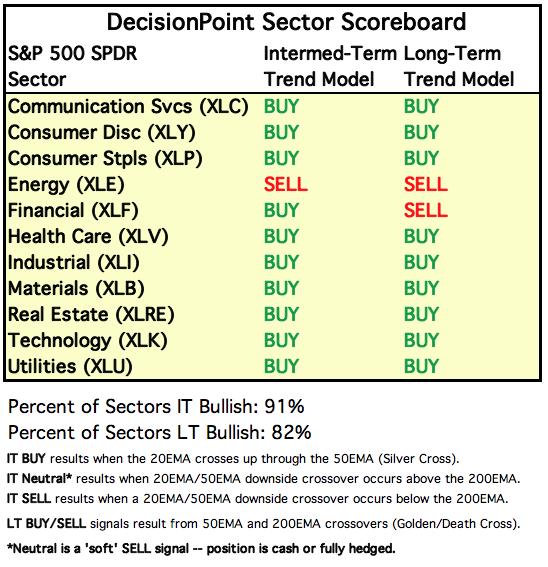
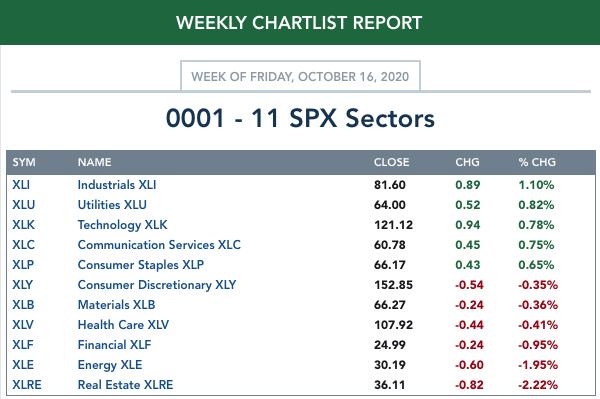
SECTORS
Each S&P 500 Index component stock is assigned to one, and only one, of 11 major sectors. This is a snapshot of the Intermediate-Term (Silver Cross) and Long-Term (Golden Cross) Trend Model signal status for those sectors.
THE MARKET (S&P 500)
IT Trend Model: BUY as of 5/8/2020
LT Trend Model: BUY as of 6/8/2020
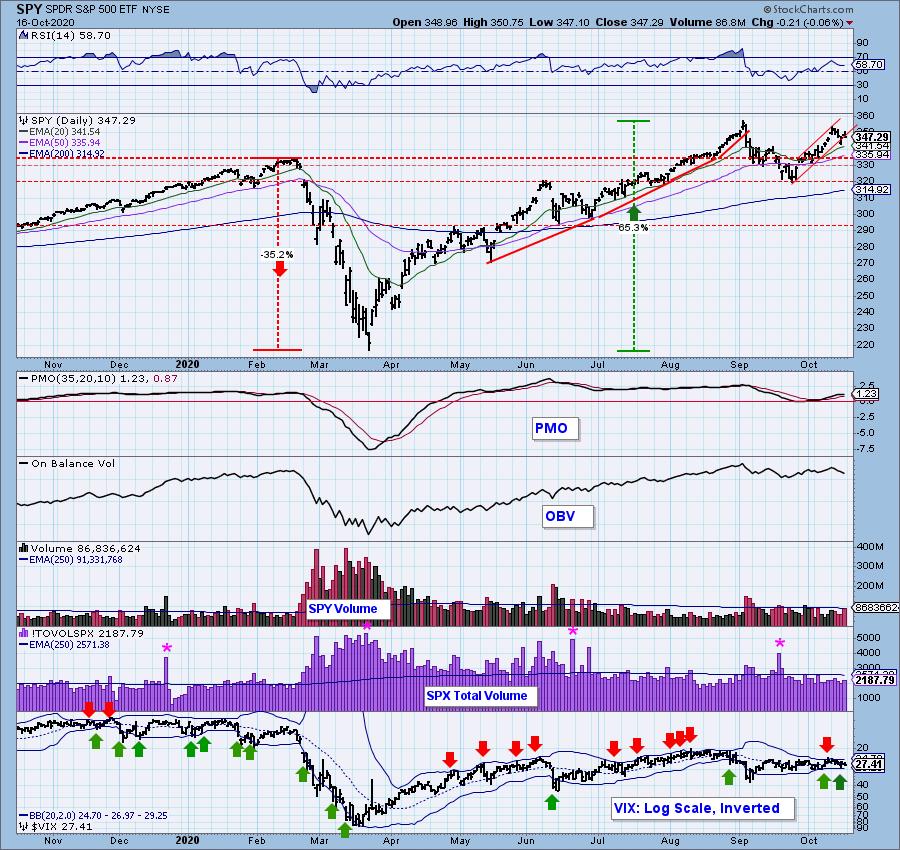
SPY Daily Chart: The steep rising trend that began last week was broken this week. The PMO is beginning to decelerate, but the RSI remains positive.
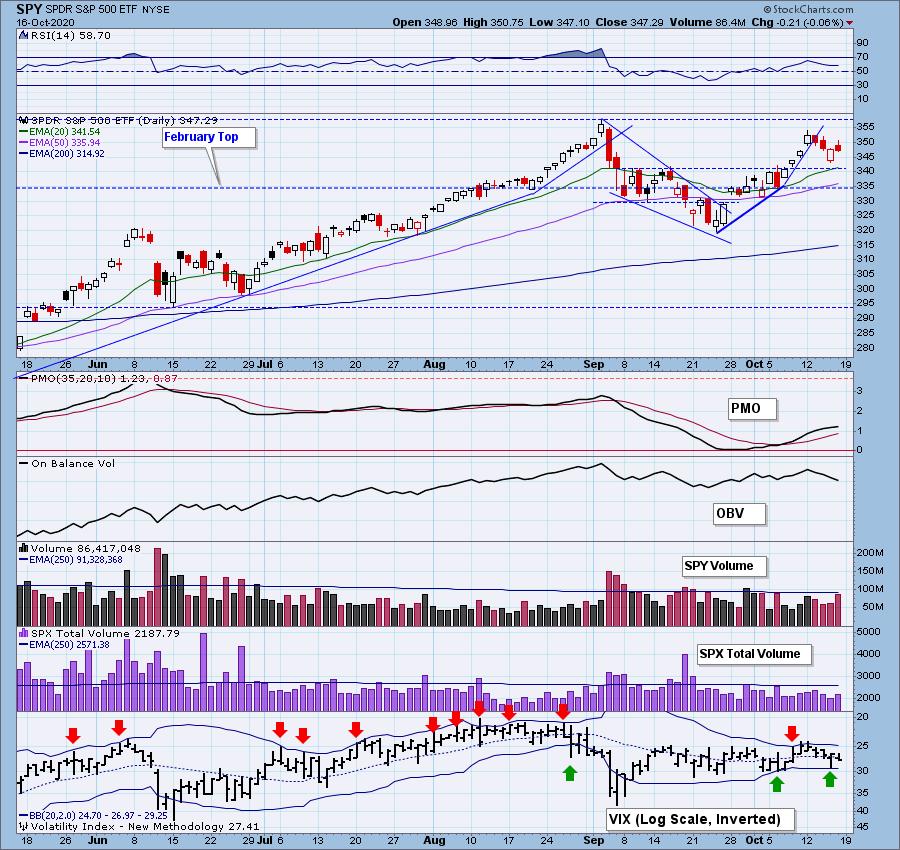
It appears that price is attempting to recapture the rising trend channel.

It's FREE!
***Click here to register for this recurring free DecisionPoint Trading Room!***
Did you miss the 10/12 trading room? Here is a link to the recording (password: qE58C9.E).
For best results, copy and paste the password to avoid typos.
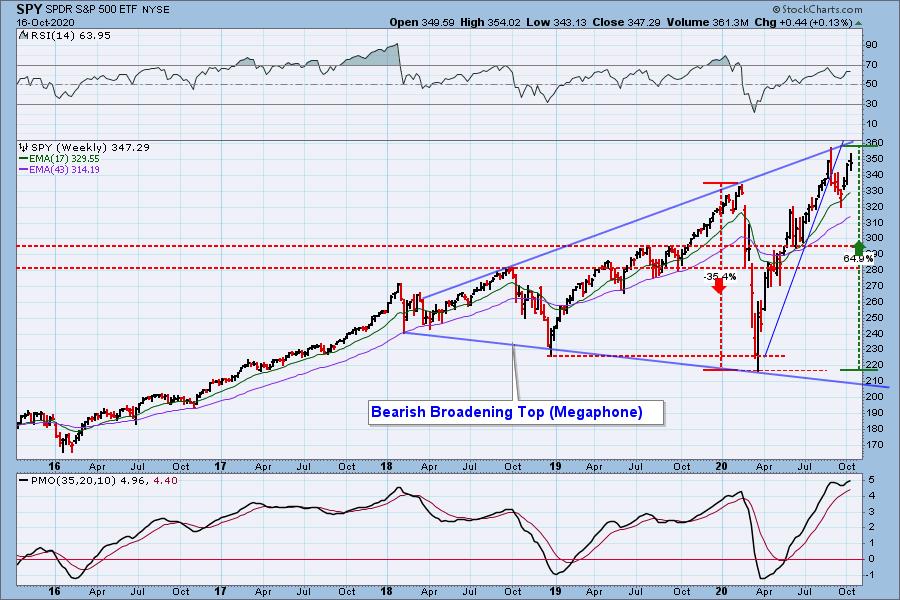
SPY Weekly Chart: On the bright side, we have a weekly PMO bottom above the signal line and a positive RSI. The overriding issue is the bearish "megaphone" or broadening top on the weekly chart.
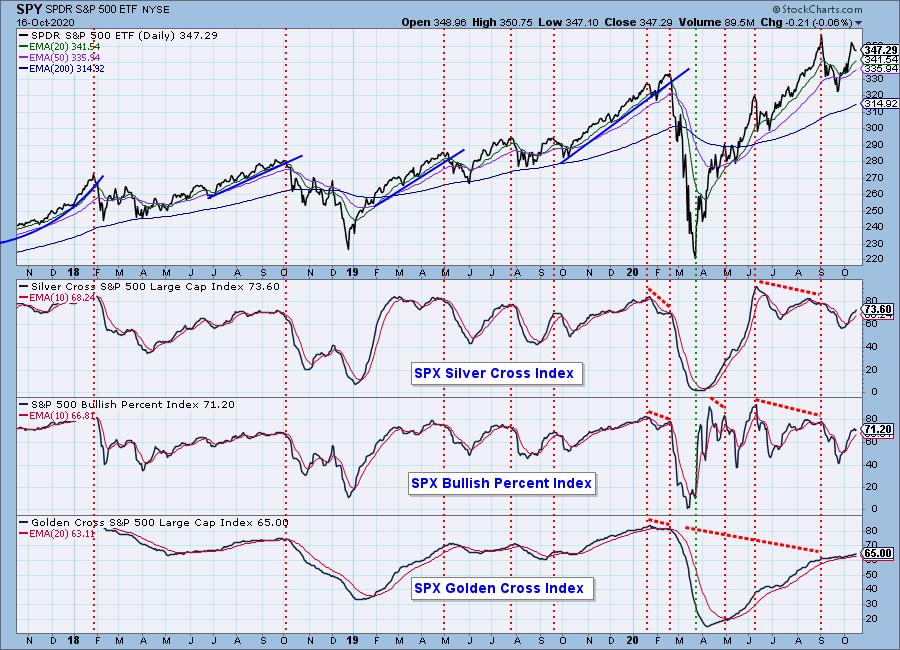
Participation: The following chart uses different methodologies for objectively showing the depth and trend of participation for intermediate- and long-term time frames.
- The Silver Cross Index (SCI) shows the percentage of SPX stocks on IT Trend Model BUY signals (20-EMA > 50-EMA).
- The Golden Cross Index (GCI) shows the percentage of SPX stocks on LT Trend Model BUY signals (50-EMA > 200-EMA).
- The Bullish Percent Index (BPI) shows the percentage of SPX stocks on Point & Figure BUY signals.
The BPI has ticked back up and both the SCI and GCI are rising nicely.
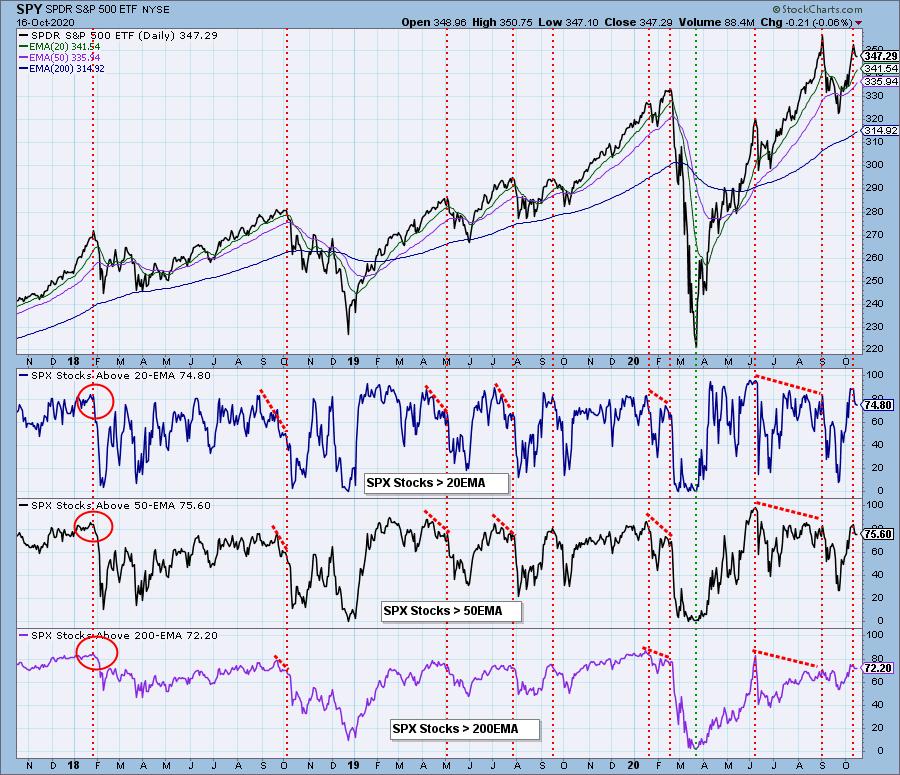
All of the %Stocks above their 20/50/200-EMAs are pulling back from overbought territory.
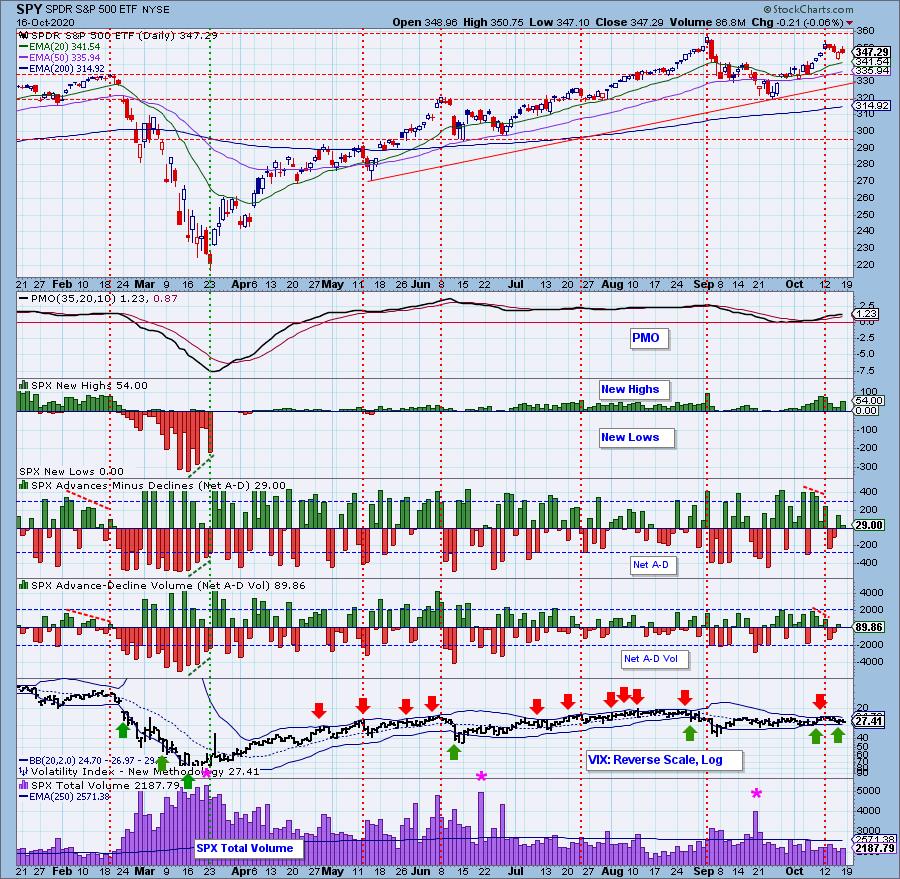
Climactic Market Indicators: Options expiration was this week, and we got the low volatility in spades. While the market traded in a 3% range, today's close was virtually unchanged from last week's close. SPX Total Volume was especially low for an expiration week.
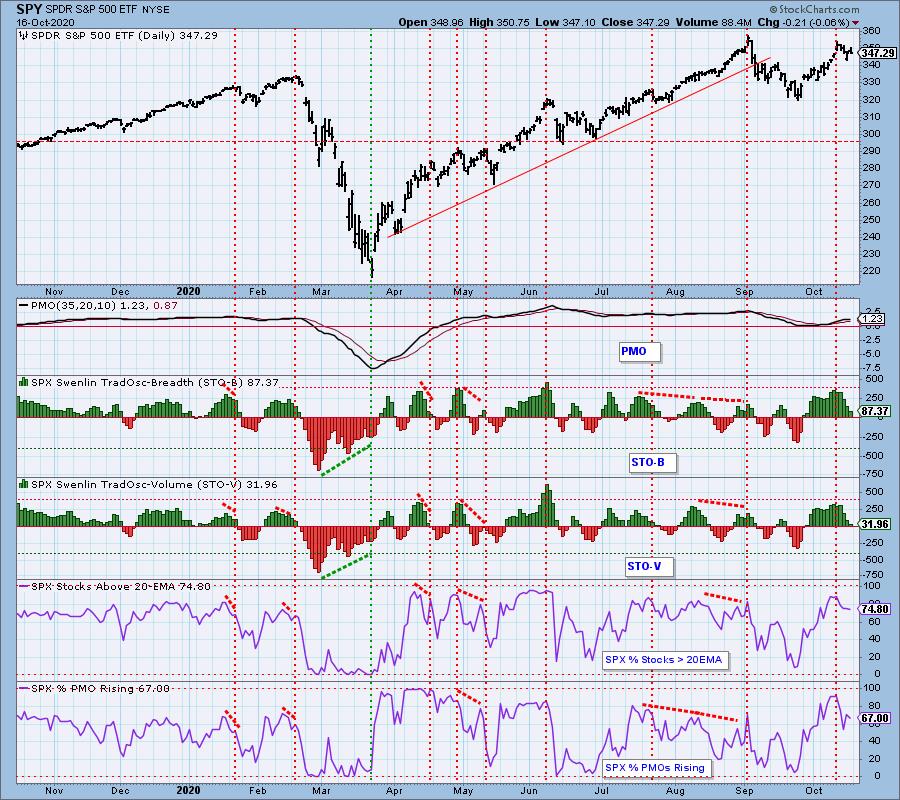
Short-Term Market Indicators: The short-term market trend is DOWN and the condition is NEUTRAL.
The STOs continue to contract and now are neutral.
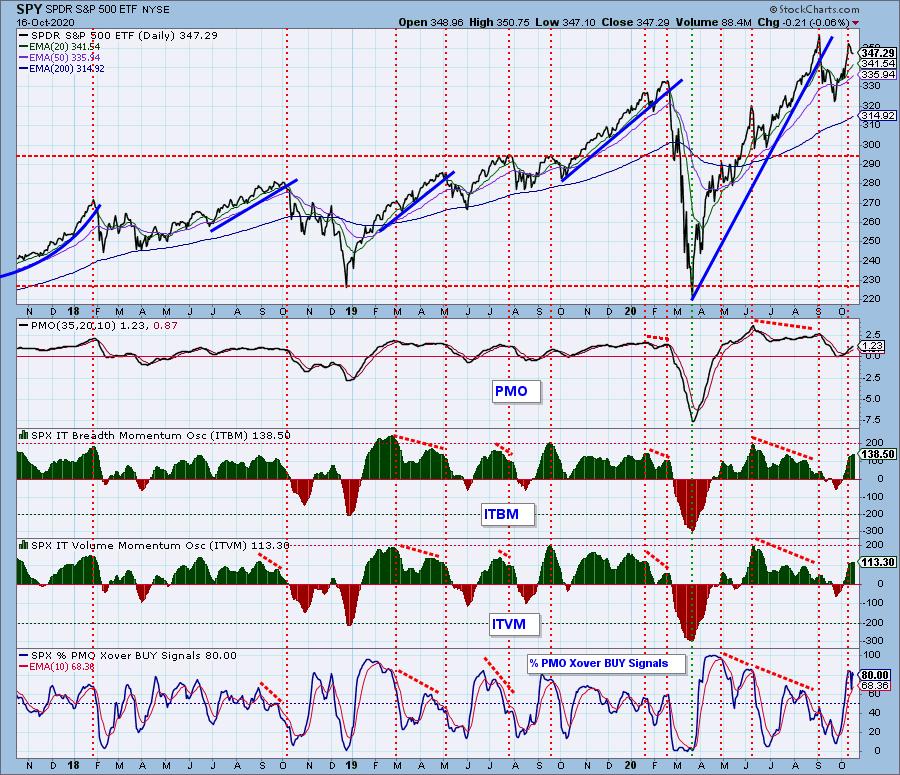
Intermediate-Term Market Indicators: The intermediate-term market trend is UP and the condition is OVERBOUGHT. The market bias is BULLISH. The ITBM/ITVM continue to rise and are getting very overbought. 80% of stocks have PMOs above their signal lines, but remember, only 67% of stocks have their PMOs rising.
CONCLUSION: The STOs continue to pull back and the SPY is struggling to recapture its rising trend channel. Short-term indicators continue to contract which tells us there is short-term weakness and it will likely continue. Intermediate-term indicators haven't seen too much damage, but if the short-term declining trend continues, that will change. Stay nimble and keep your stops in play at least until we see improvements in the Swenlin Trading Oscillators (STOs). Don't forget, the Rydex Ratio is also flashing "caution".
Have you subscribed the DecisionPoint Diamonds yet? DP does the work for you by providing handpicked stocks/ETFs from exclusive DP scans! Add it with a discount! Contact support@decisionpoint.com for more information!
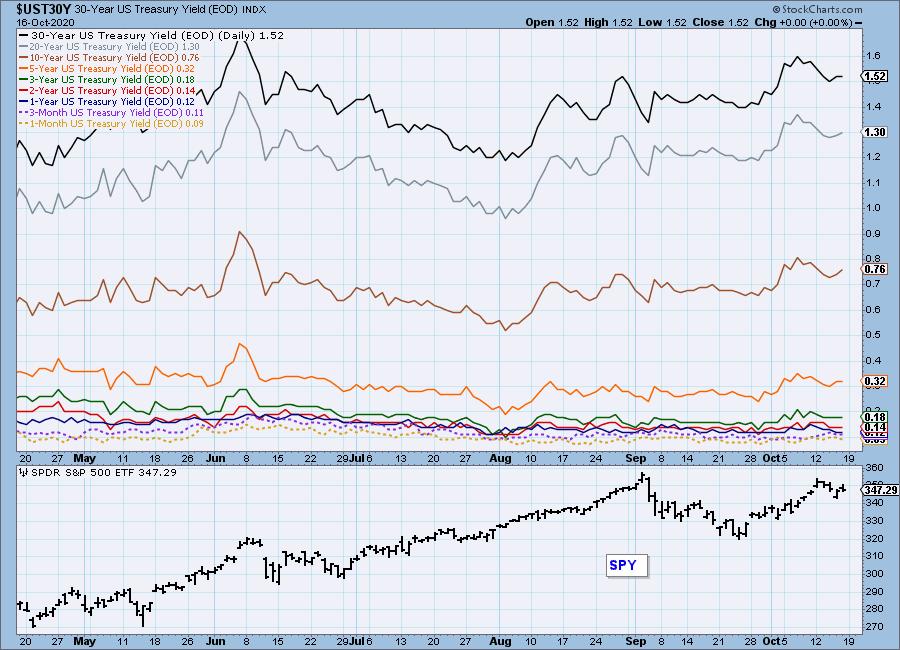
INTEREST RATES
This chart is included so we can monitor rate inversions. In normal circumstances the longer money is borrowed the higher the interest rate that must be paid. When rates are inverted, the reverse is true.
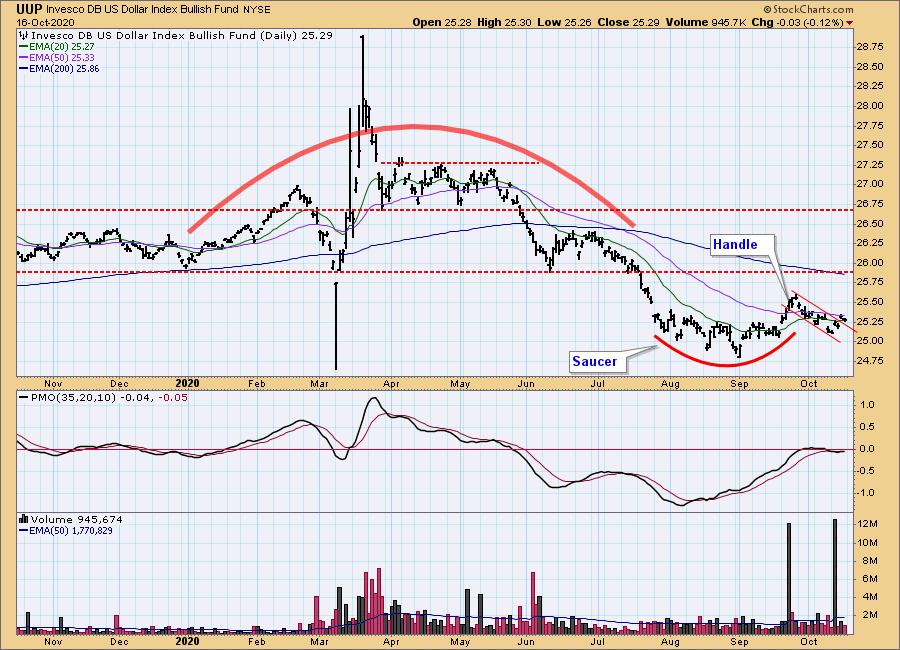
DOLLAR (UUP)
IT Trend Model: NEUTRAL as of 5/28/2020
LT Trend Model: SELL as of 7/10/2020
UUP Daily Chart: The 50-EMA held up the Dollar again. What appeared to be a nice breakout from the handle on the "cup and handle" pattern is already looking suspect. The PMO remains in negative territory.
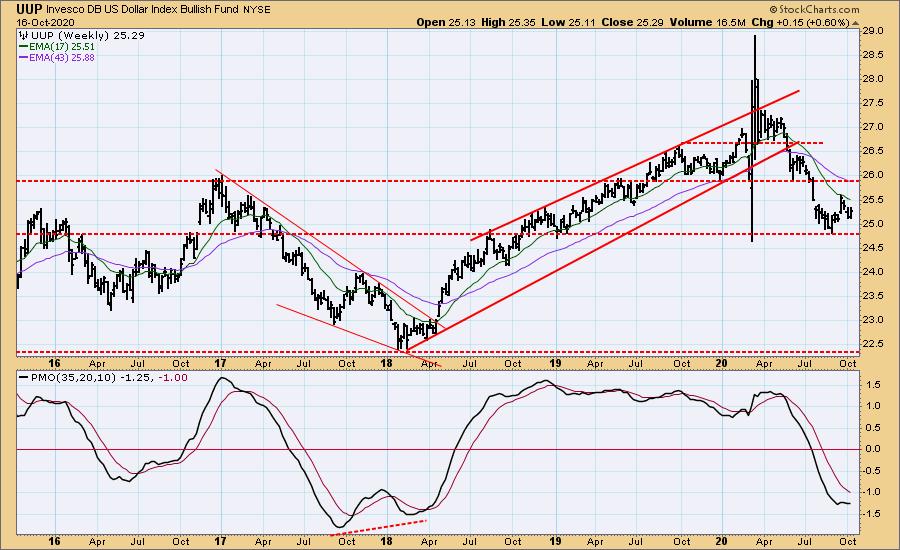
UUP Weekly Chart: Note that the weekly PMO is trying to top below the signal line which is generally a very bearish signal. Price was held up at the 17-week EMA and continues the decline.
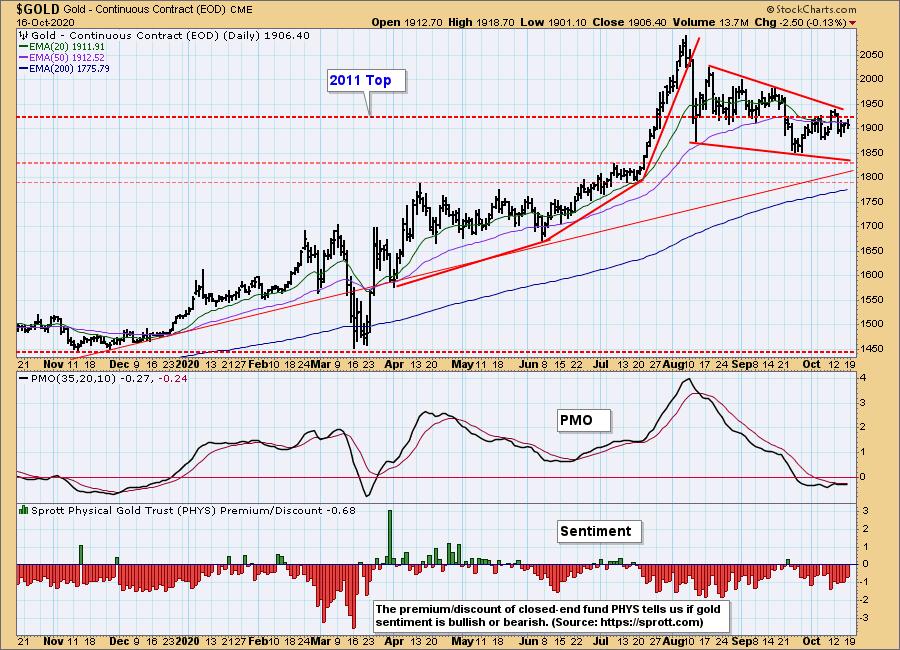
GOLD
IT Trend Model: NEUTRAL as of 10/14/2020
LT Trend Model: BUY as of 1/8/2019
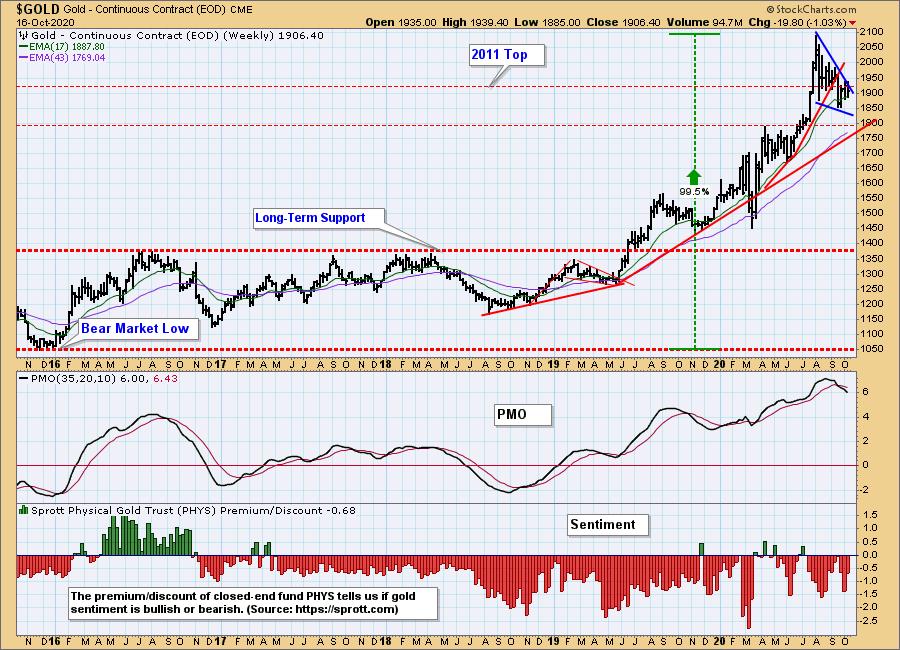
GOLD Daily Chart: The bullish falling wedge is in play. The PMO has tried all week to get above its signal line with no success. The IT Trend Model triggered a Neutral signal when the 20-EMA crossed below the 50-EMA while the 50-EMA was above the 200-EMA. If the 50-EMA had been below the 200-EMA it would have been a SELL signal. Sentiment is still bearish given the discount levels and with sentiment being contrarian that should be good for Gold.
GOLD Weekly Chart: The weekly PMO is on a SELL signal and continues to decline.
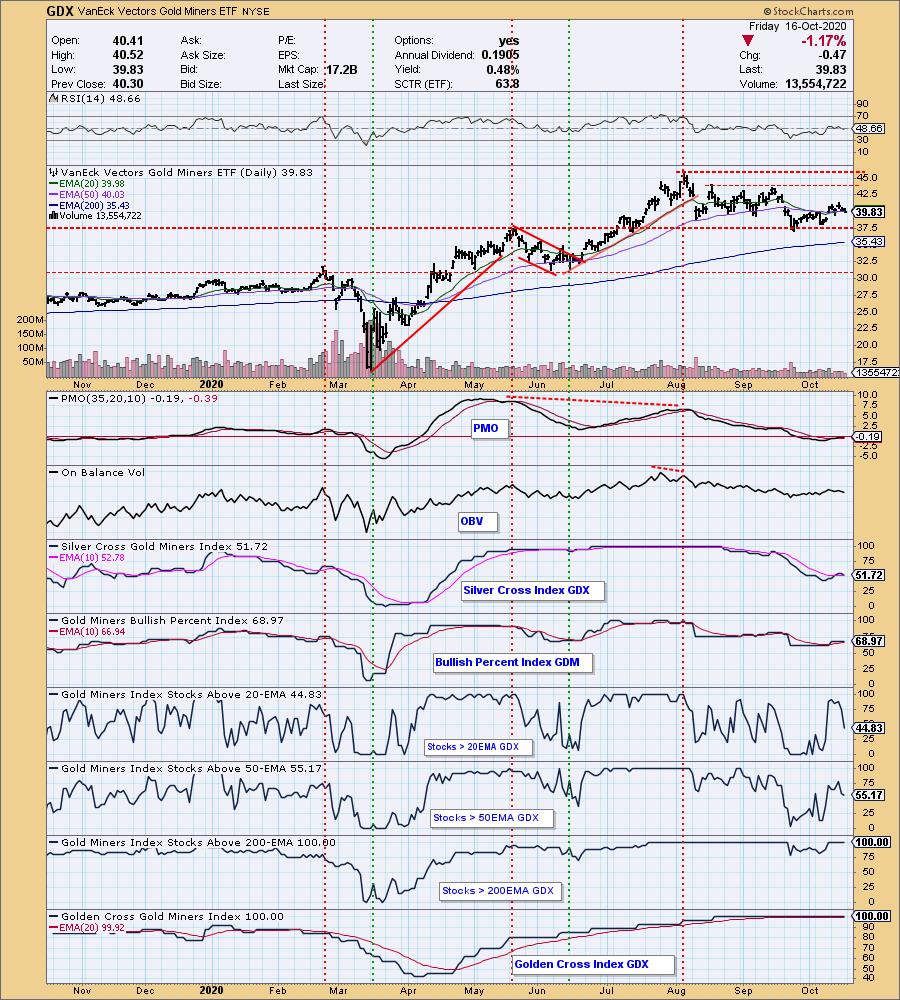
GOLD MINERS Golden and Silver Cross Indexes: Gold Miners have managed to remain above the 20/50-EMAs and today they got a PMO BUY signal. Unfortunately the underlying indicators suggest problems. The SCI had a negative crossover and the BPI has been flat the entire week. The big drop in stocks above their 20-EMA suggests short-term weakness while the drop in stocks above their 50-EMA reflects intermediate-term weakness.
CRUDE OIL (USO)
IT Trend Model: SELL as of 9/8/2020
LT Trend Model: SELL as of 2/3/2020
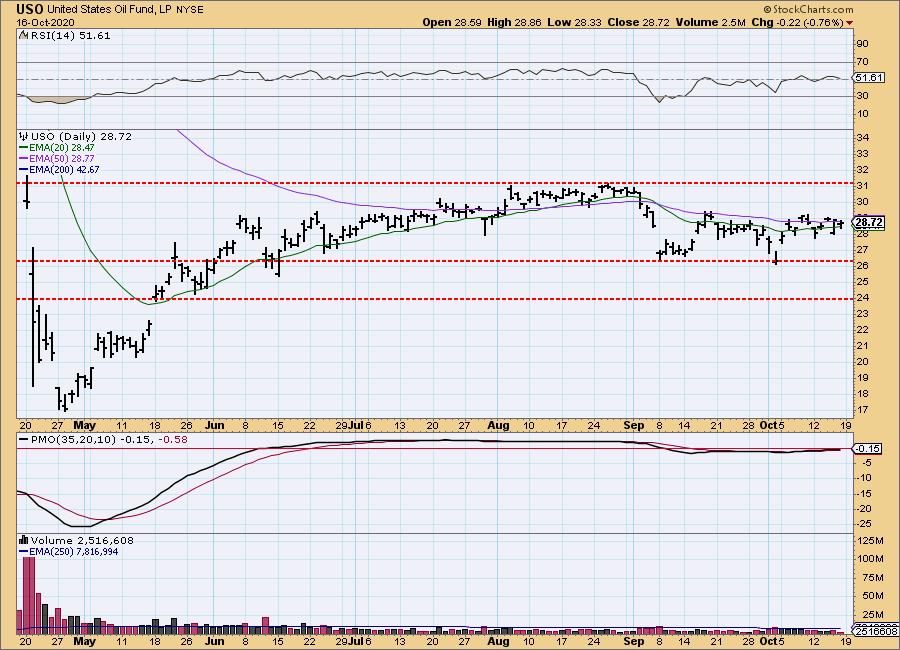
USO Daily Chart: Price is continuing its dance with the 20/50-EMAs. The PMO may be on a BUY signal and the RSI technically in positive territory, but that hasn't helped.
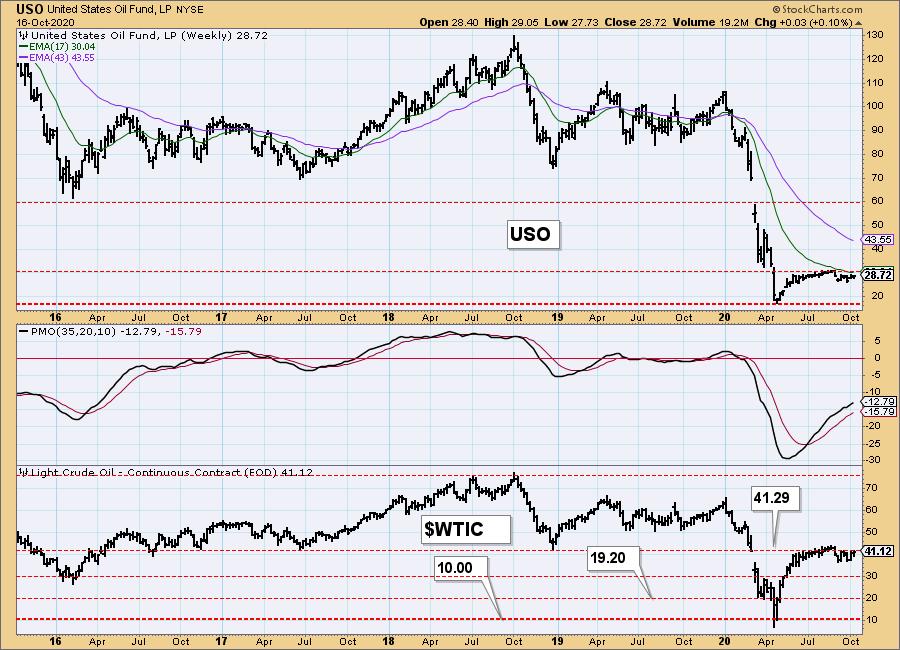
USO/$WTIC Weekly Chart: Overhead resistance on both USO and $WTIC is strong. Until demand begins to increase that resistance level will likely hold firm.
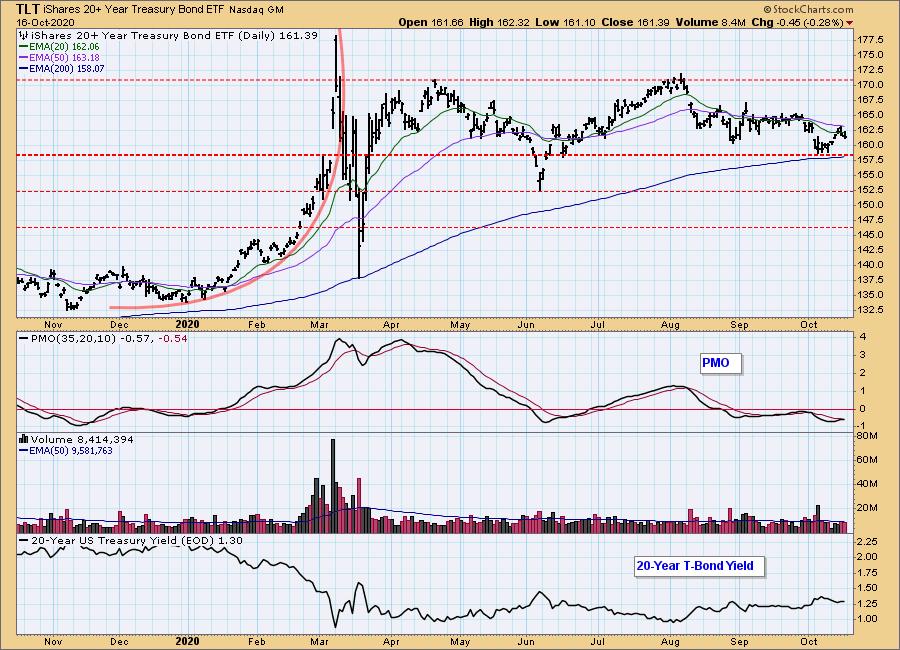
BONDS (TLT)
IT Trend Model: NEUTRAL as of 8/27/2020
LT Trend Model: BUY as of 1/2/2019
TLT Daily Chart: TLT has not been able to decisively break above its 50-EMA since losing its support back in August. The 200-EMA did hold and the PMO is nearing a crossover BUY signal.
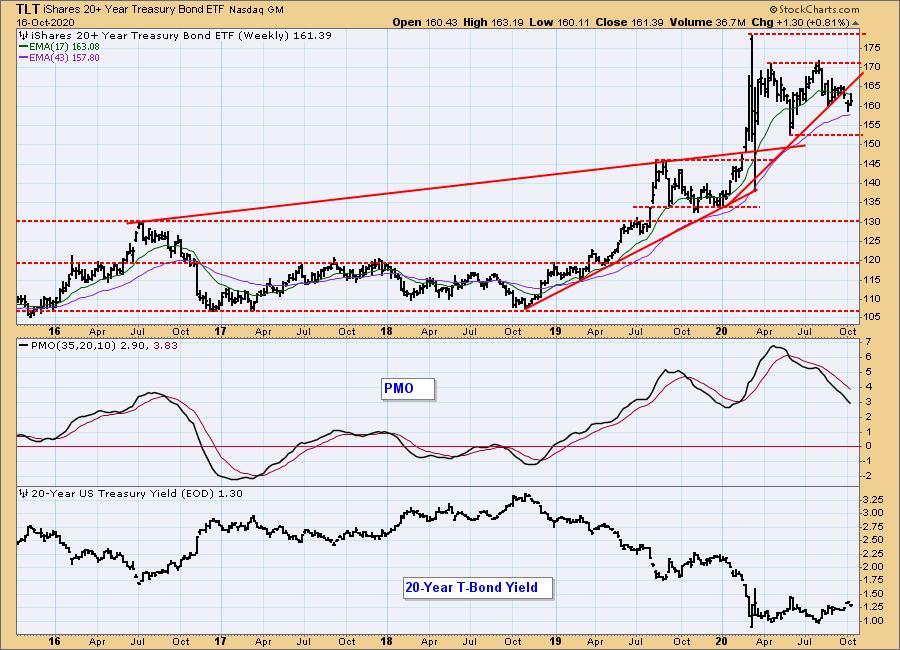
TLT Weekly Chart: The weekly PMO is far more negative. However, the 43-week EMA is so far holding as support. Note that if that level is lost, based on history, we will likely see further decline. The 43-week EMA on TLT has not been breached since 2018.
Technical Analysis is a windsock, not a crystal ball.
Happy Charting! - Carl & Erin
Disclaimer: This blog is for educational purposes only and should not be construed as financial advice. The ideas and strategies should never be used without first assessing your own personal and financial situation, or without consulting a financial professional. Any opinions expressed herein are solely those of the author, and do not in any way represent the views or opinions of any other person or entity.
NOTE: The signal status reported herein is based upon mechanical trading model signals, specifically, the DecisionPoint Trend Model. They define the implied bias of the price index based upon moving average relationships, but they do not necessarily call for a specific action. They are information flags that should prompt chart review. Further, they do not call for continuous buying or selling during the life of the signal. For example, a BUY signal will probably (but not necessarily) return the best results if action is taken soon after the signal is generated. Additional opportunities for buying may be found as price zigzags higher, but the trader must look for optimum entry points. Conversely, exit points to preserve gains (or minimize losses) may be evident before the model mechanically closes the signal.
Helpful DecisionPoint Links:
DecisionPoint Alert Chart List
DecisionPoint Golden Cross/Silver Cross Index Chart List
DecisionPoint Sector Chart List
Price Momentum Oscillator (PMO)
Swenlin Trading Oscillators (STO-B and STO-V)