
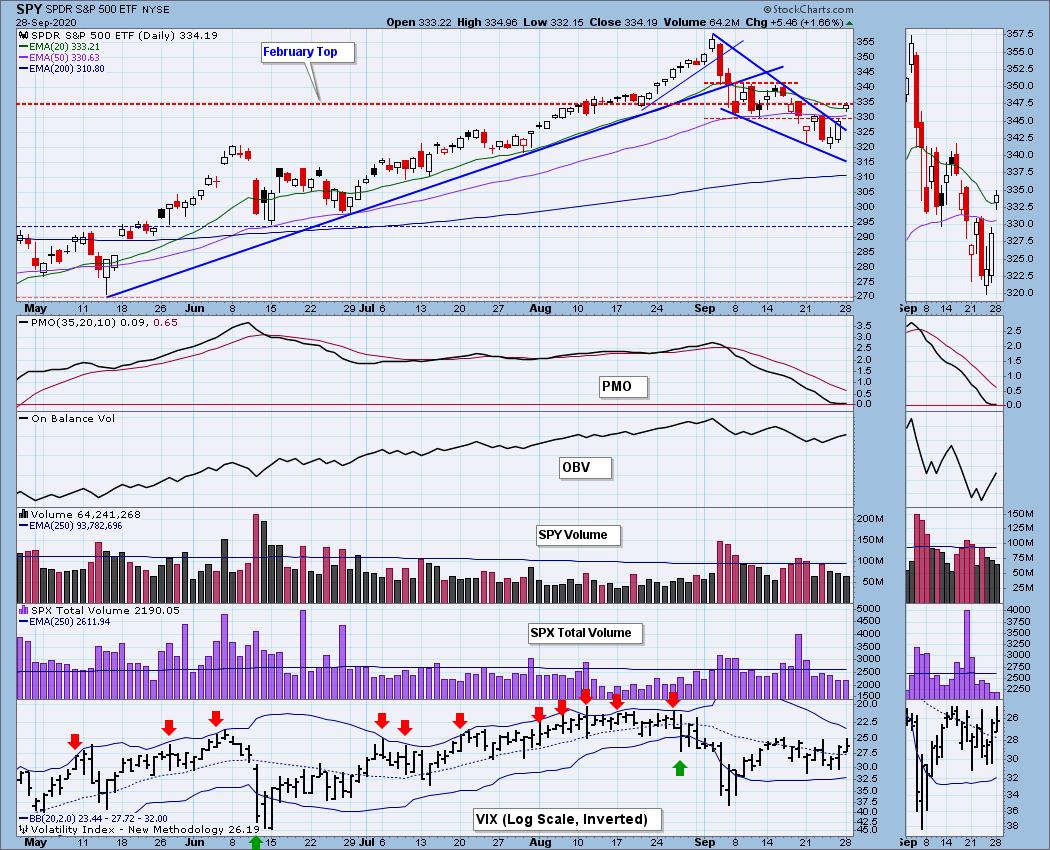
On Friday, I texted Carl to tell him that a falling wedge on the SPY (and other major indexes) had revealed itself. I caveated my text saying that it wasn't dissuading me from my bearish intermediate-term perspective, but it certainly shed a bullish light on possible follow-through this week. Today, price gapped up and settled in just above the 20-EMA. In the meantime, the PMO has turned up above the zero line which is very positive. But there are two big negatives here. First, I am reminded of the final candlestick at the all-time high. It is another "island" and these are reversal formations. Second, volume has been dwindling as price is rising which makes me worry about the conviction of market participants.

Click here to register in advance for the recurring free DecisionPoint Trading Room! Julius de Kempenaer of RRG Research will join Erin for the next trading room 10/5!
Did you miss the September 28th trading room? Here is a link to the recording (password: FT&&l3#K).
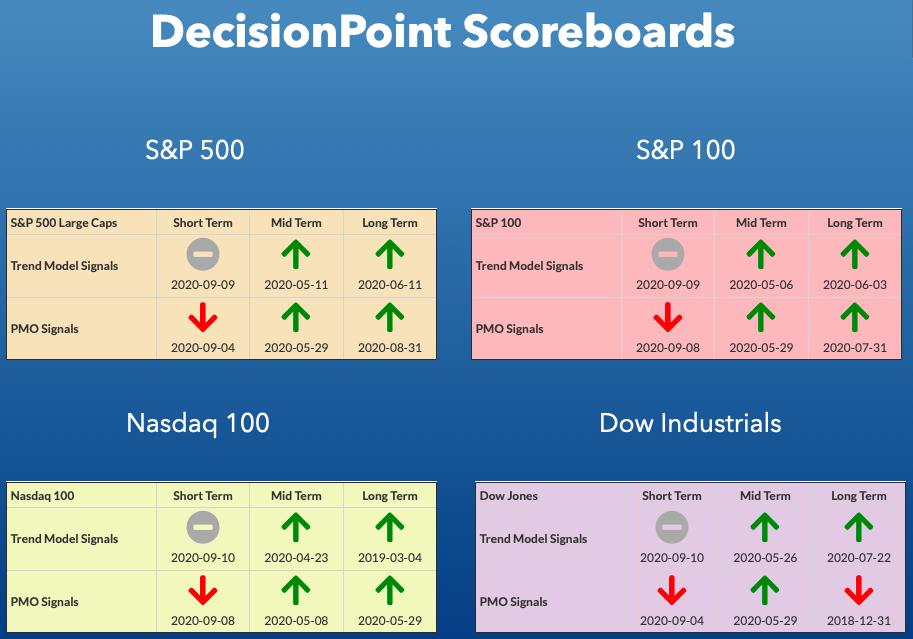
DP INDEX SCOREBOARDS:
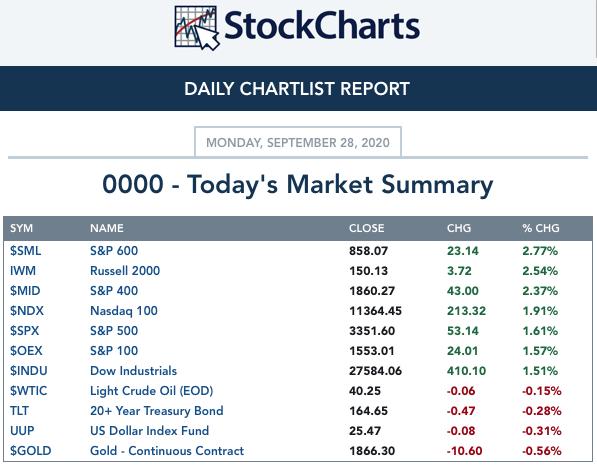
TODAY'S Broad Market Action:
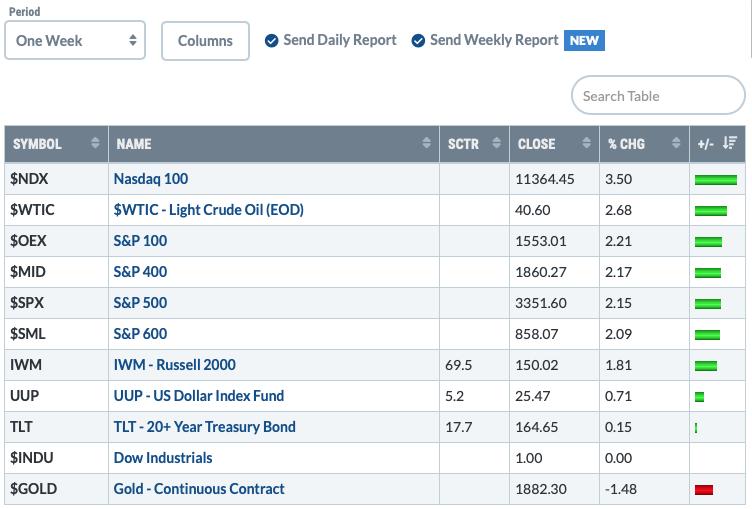
One WEEK Results:
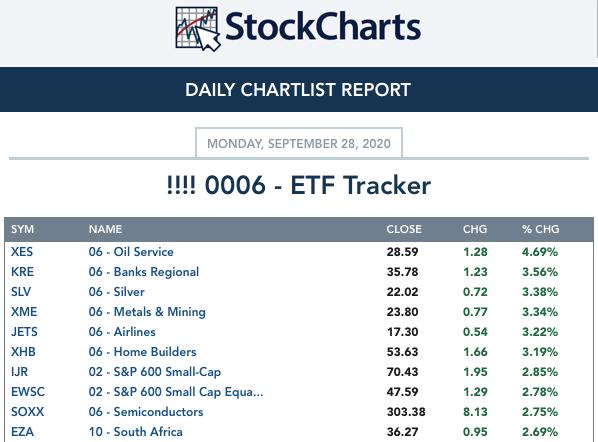
Top 10 from ETF Tracker:
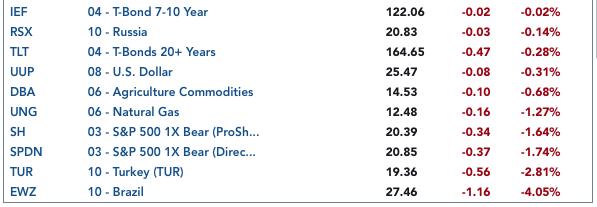
Bottom 10 from ETF Tracker:
On Friday, the DecisionPoint Alert Weekly Wrap presents an assessment of the trend and condition of the stock market (S&P 500), the U.S. Dollar, Gold, Crude Oil, and Bonds. Monday through Thursday the DecisionPoint Alert daily report is abbreviated and covers changes for the day.
Watch the latest episode of DecisionPoint on StockCharts TV's YouTube channel here!
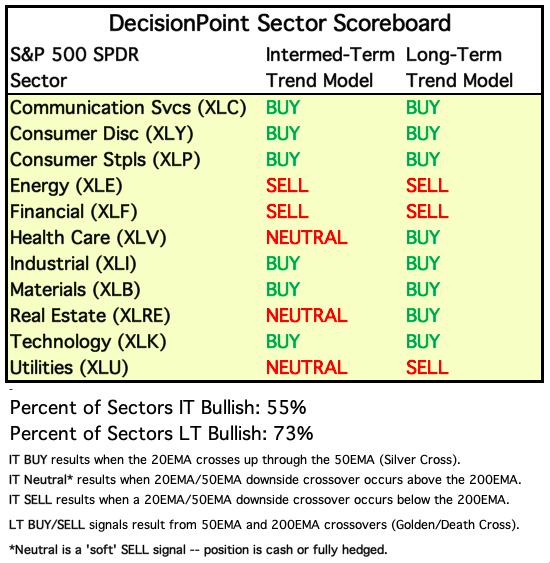
SECTORS
SIGNALS:
Each S&P 500 Index component stock is assigned to one, and only one, of 11 major sectors. This is a snapshot of the Intermediate-Term (Silver Cross) and Long-Term (Golden Cross) Trend Model signal status for those sectors.
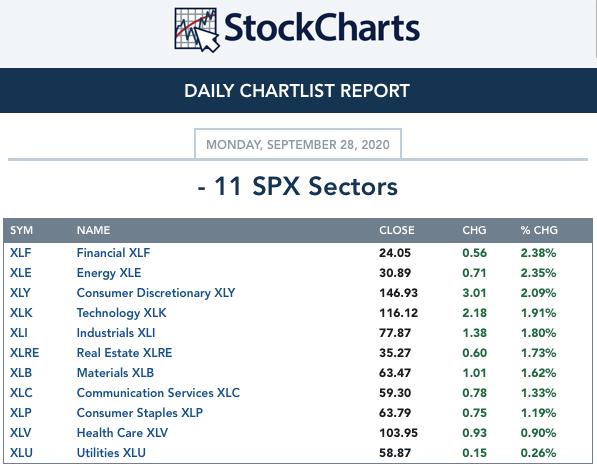
TODAY'S RESULTS:
One WEEK Results: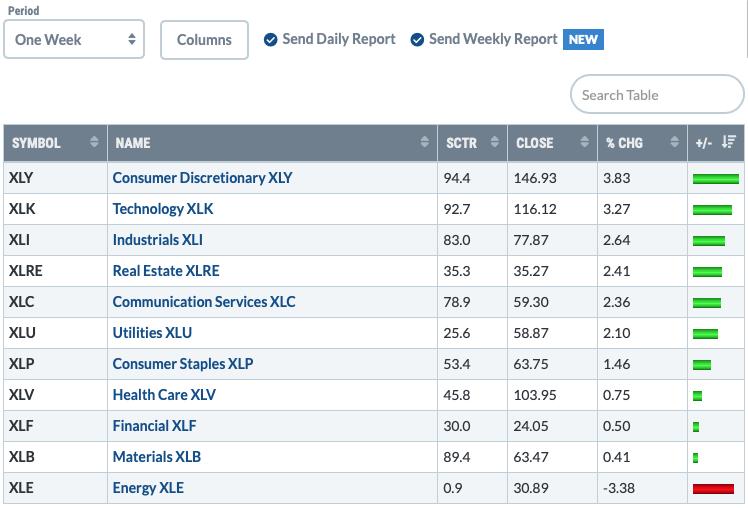
STOCKS
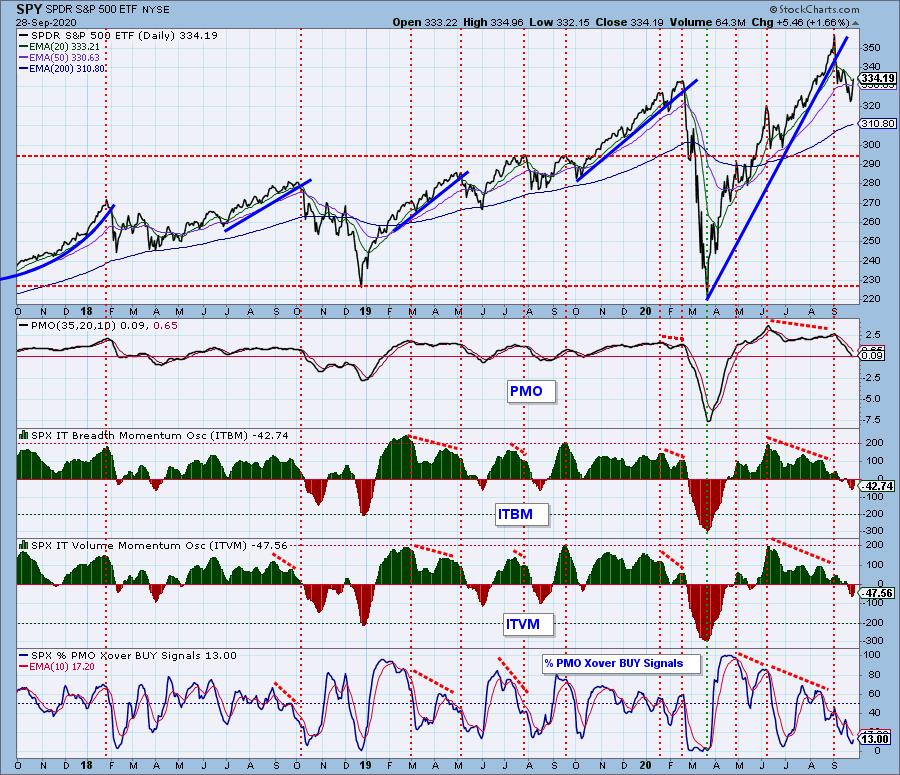
IT Trend Model: BUY as of 5/8/2020
LT Trend Model: BUY as of 6/8/2020
SPY Daily Chart: Besides a deceleration of the PMO above the zero line, the RSI has just moved back into positive territory. Today's price bar, does put price right up against resistance at the February top.

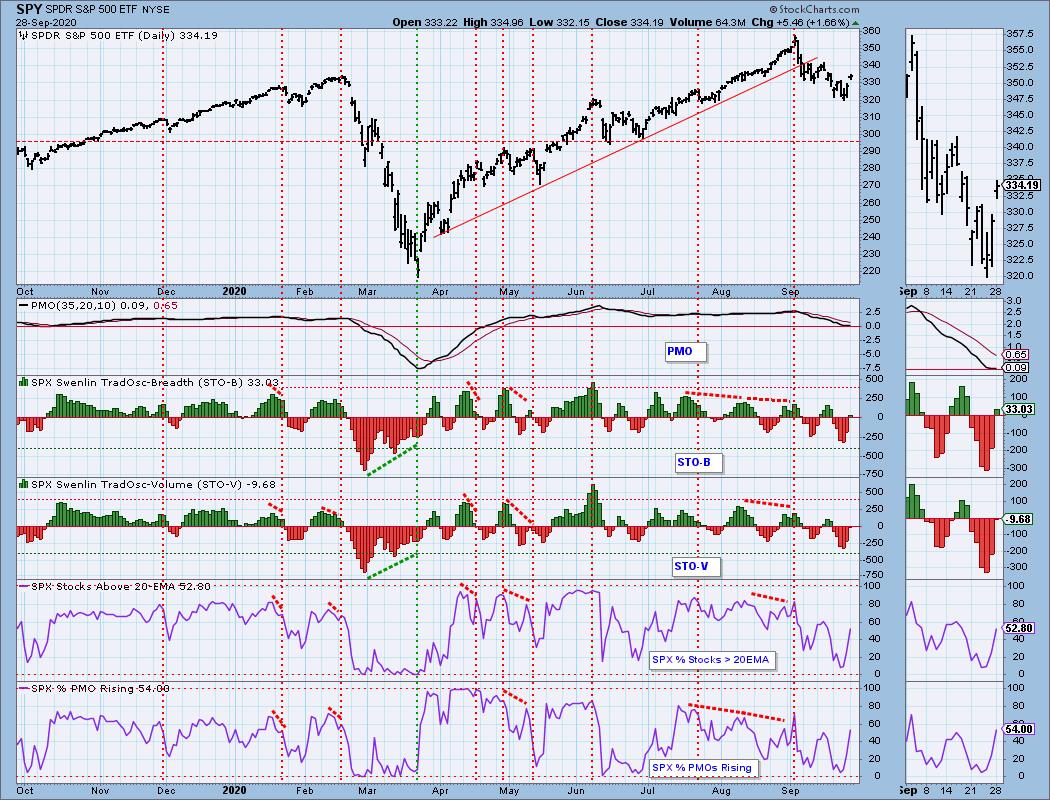
Climactic Market Indicators: Very climactic positive readings to follow Friday's. Since these readings are coming on a third day of rally, I have to read them as a buying exhaustion. This would certainly make sense if we are looking at a possible island reversal. The VIX has gotten back above its EMA on the inverted scale which is positive. However, coming on the heels of a possible buying exhaustion, it could be considered near-term overbought.

Short-Term Market Indicators: The short-term market trend is DOWN and the condition is NEUTRAL. Based upon the STO ranges, market bias is NEUTRAL.
The STOs actually look pretty good. They've snapped back out of oversold territory and are rising. That is bullish for the short term. We saw vast improvement on %Stocks indicators, but they can now hit overbought readings pretty quickly.
Intermediate-Term Market Indicators: The following chart uses different methodologies for objectively showing the depth and trend of participation for intermediate- and long-term time frames.
- The Silver Cross Index (SCI) shows the percentage of SPX stocks on IT Trend Model BUY signals (20-EMA > 50-EMA).
- The Golden Cross Index (GCI) shows the percentage of SPX stocks on LT Trend Model BUY signals (50-EMA > 200-EMA).
- The Bullish Percent Index (BPI shows the percentage of SPX stocks on Point & Figure BUY signals.
The BPI is rising and positive. The SCI and GCI don't look too healthy as they move lower.
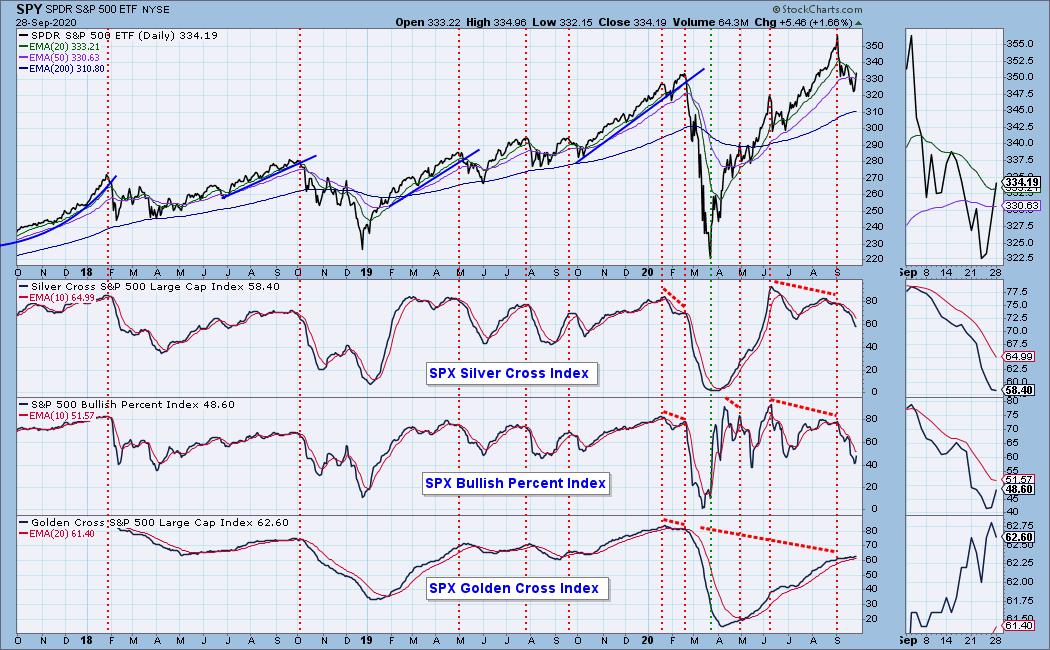
The intermediate-term market trend is DOWN and the condition is NEUTRAL. The market bias is NEUTRAL.
While these readings are moving higher, they are still in negative territory.
CONCLUSION: The climactic indicators seem to be displaying a buying exhaustion. We have a gap up that formed a price "island". Those typically are reversal patterns. So while we got a nice execution of the falling wedge, it came on low volume and an island. The selling initiation last week didn't pan out, so this buying exhaustion may not pan out. The VIX is above its EMA which is positive and STOs are rising. Both are generally good compasses so I won't be taken aback should the rally continue.
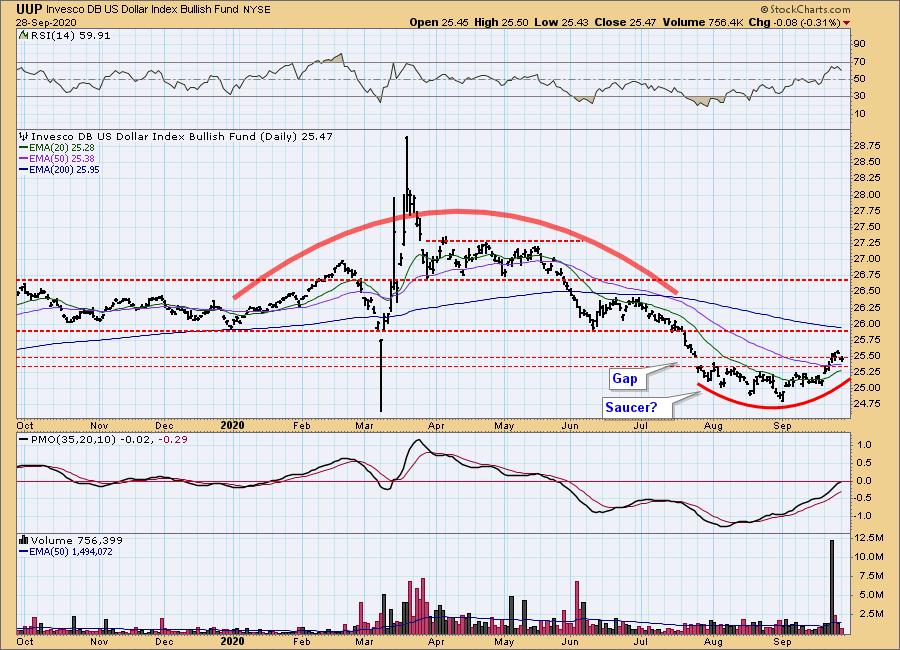
DOLLAR (UUP)
IT Trend Model: NEUTRAL as of 5/28/2020
LT Trend Model: SELL as of 7/10/2020
UUP Daily Chart: The gap was covered last week and now we see a pullback. This sure looks like a bullish cup and handle. The PMO is rising nicely and the RSI is positive and not overbought. We could see another day of lower prices, but the cup and handle along with the PMO and RSI tell me to expect higher prices soon.
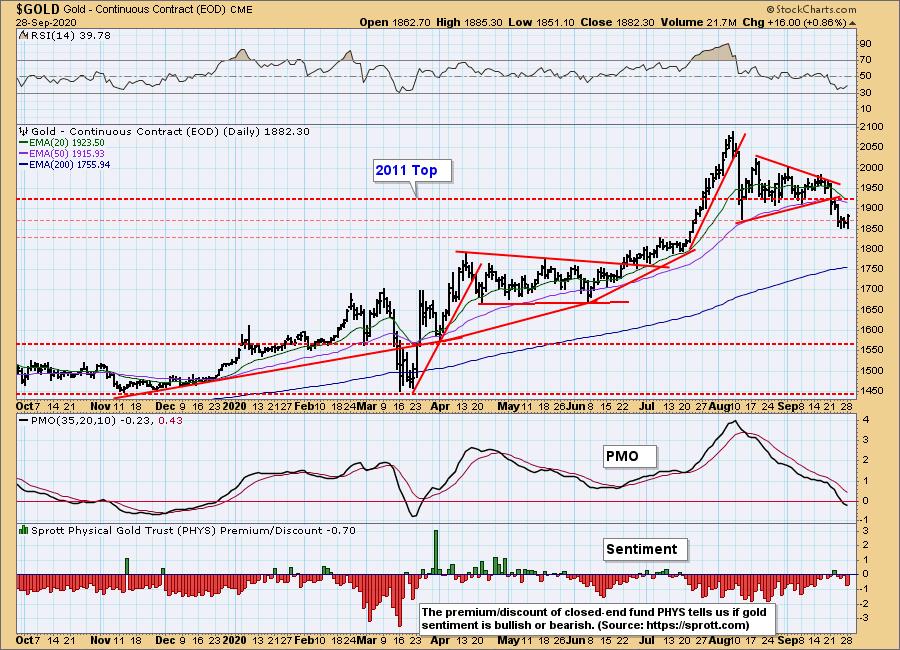
GOLD
IT Trend Model: BUY as of 3/24/2020
LT Trend Model: BUY as of 1/8/2019
GOLD Daily Chart: Gold rallied and consequently is still holding support at 1825. The RSI is negative, but it is starting to rise. The PMO is unfortunately below zero, but it is decelerating. We have increased discounts on PHYS which is generally bullish for Gold.
Full Disclosure: I own GLD.
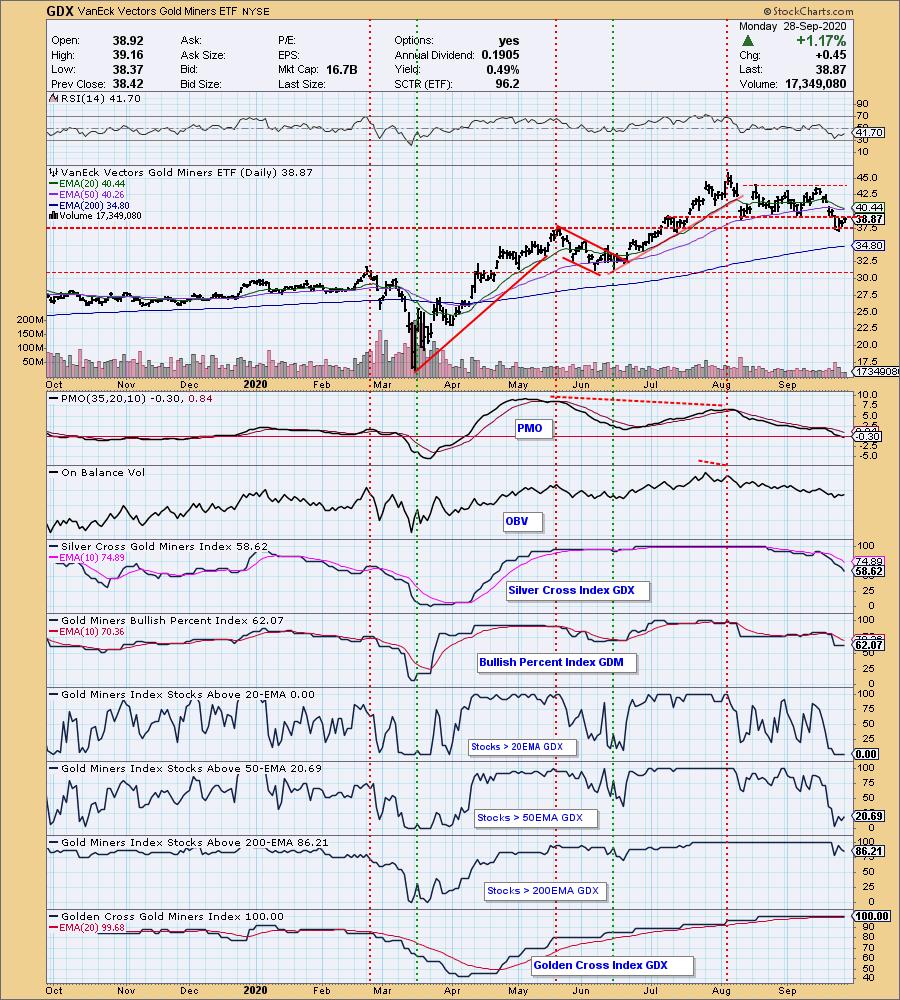
GOLD MINERS Golden and Silver Cross Indexes: Was happy to see Gold Miners rally today. Like Gold, they have found support. Unfortunately there are a few issues. First is the nearing IT Trend Model Neutral signal that will arrive should the 20-EMA cross below the 50-EMA. Unless price can get above the 50-EMA, that signal will trigger tomorrow or the next day. The RSI is rising, but it is negative. The PMO just went negative and isn't rising yet. None of the components of GDX has their price above the 20-EMA. We need to see that number begin to rise quickly in order to support a longer-term rally.
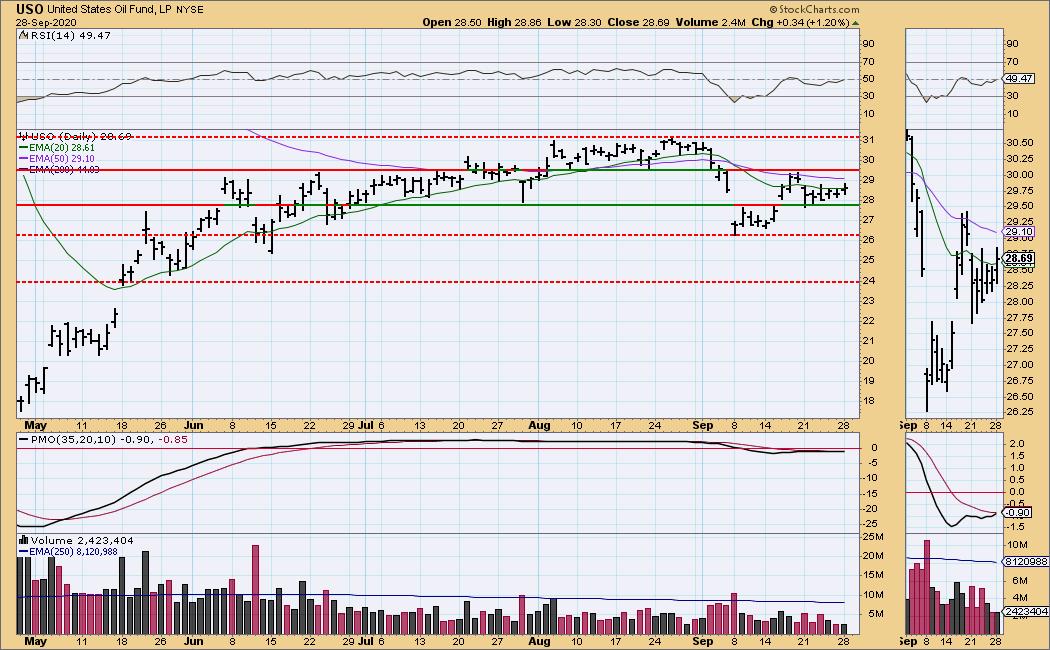
CRUDE OIL (USO)
IT Trend Model: SELL as of 9/8/2020
LT Trend Model: SELL as of 2/3/2020
USO Daily Chart: The 20-EMA was challenged today and price did manage to close above it. Next up will be the 50-EMA. The PMO is about to trigger a BUY signal and the RSI is about to move into positive territory which suggests it could successfully push past it. At this point, price is just oscillating in a tight trading range.
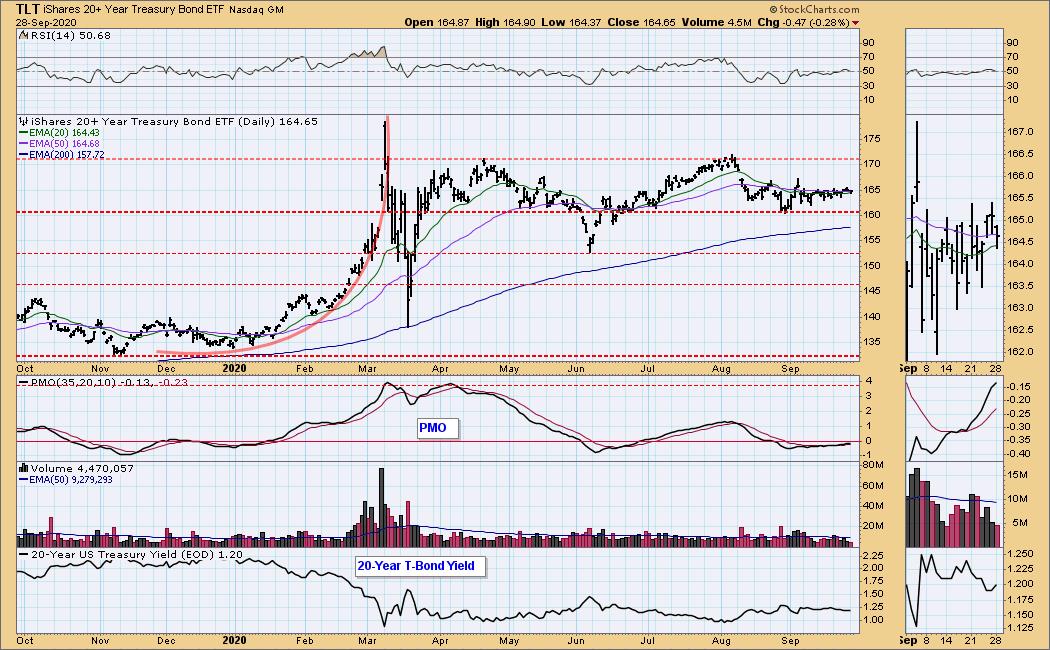
BONDS (TLT)
IT Trend Model: Neutral as of 8/27/2020
LT Trend Model: BUY as of 1/2/2019
TLT Daily Chart: Bonds continue to meander sideways. The RSI is positive and the PMO is rising so perhaps we will see some action this week.
Full disclosure: I own TLT.
Have you subscribed the DecisionPoint Diamonds yet? DP does the work for you by providing handpicked stocks/ETFs from exclusive DP scans! Get in on the new "DecisionPoint Diamond Mine" trading room that is part of that subscription! Contact support@decisionpoint.com for more information!
Technical Analysis is a windsock, not a crystal ball.
Happy Charting! - Erin
Email: erin@decisionpoint.com
NOTE: The signal status reported herein is based upon mechanical trading model signals, specifically, the DecisionPoint Trend Model. They define the implied bias of the price index based upon moving average relationships, but they do not necessarily call for a specific action. They are information flags that should prompt chart review. Further, they do not call for continuous buying or selling during the life of the signal. For example, a BUY signal will probably (but not necessarily) return the best results if action is taken soon after the signal is generated. Additional opportunities for buying may be found as price zigzags higher, but the trader must look for optimum entry points. Conversely, exit points to preserve gains (or minimize losses) may be evident before the model mechanically closes the signal.
Helpful DecisionPoint Links (Can Be Found on DecisionPoint.com Links Page):
DecisionPoint Shared ChartList and DecisionPoint Chart Gallery
Price Momentum Oscillator (PMO)