
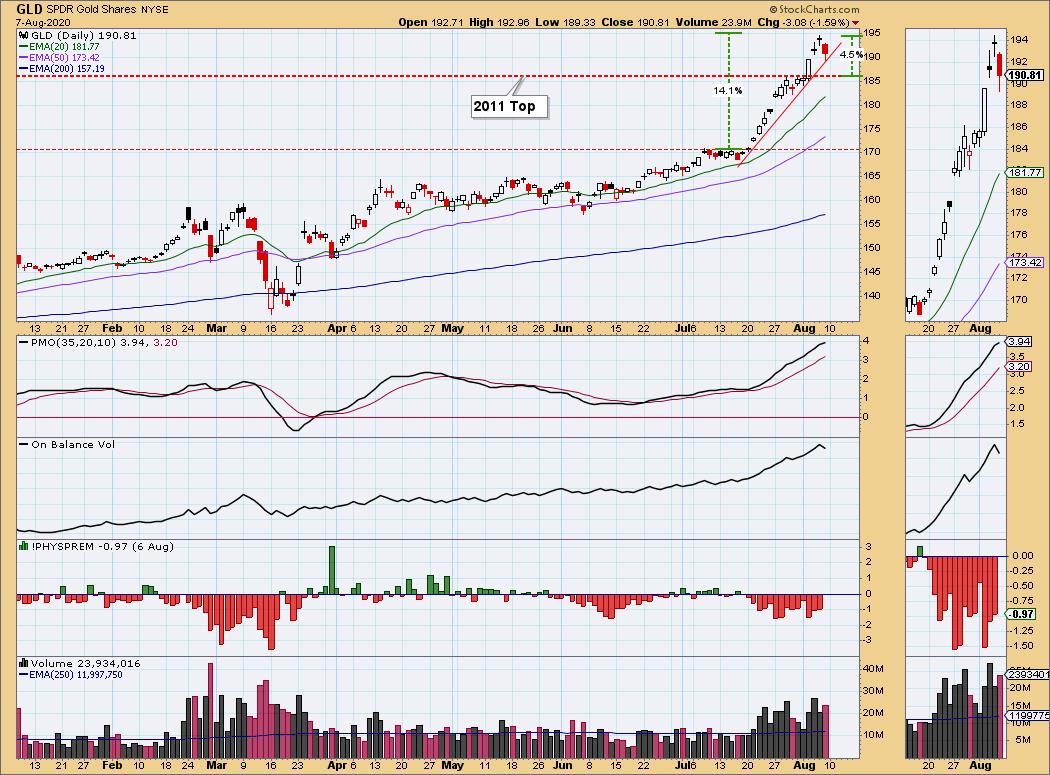
In my opinion, no, gold is not about to crash. I'll be looking at this in more depth in the regular GOLD section below, but I thought I'd lead this week's commentary with a quick look at one of the popular trading vehicles for gold, GLD. We can see that GLD really began to accelerate after it broke above 170, where is had stalled for almost two weeks, but the most critical resistance was at the line drawn across the 2011 top at 185.85. That resistance was quickly overcome with a decisive breakout. To clarify, "decisive" means the breakout was at least +3%, which it was, and by so doing it is subsequently unlikely to fall below the support line. On Friday, GLD pulled back to the short-term rising trend line and filled Wednesday's up gap in the process. This was a perfect technical pullback, which maintains the bullish outlook.
The DecisionPoint Alert Weekly Wrap presents an end-of-week assessment of the trend and condition of the Stock Market, the U.S. Dollar, Gold, Crude Oil, and Bonds. The DecisionPoint Alert daily report (Monday through Thursday) is abbreviated and gives updates on the Weekly Wrap assessments.
Watch the latest episode of DecisionPoint on StockCharts TV's YouTube channel here!
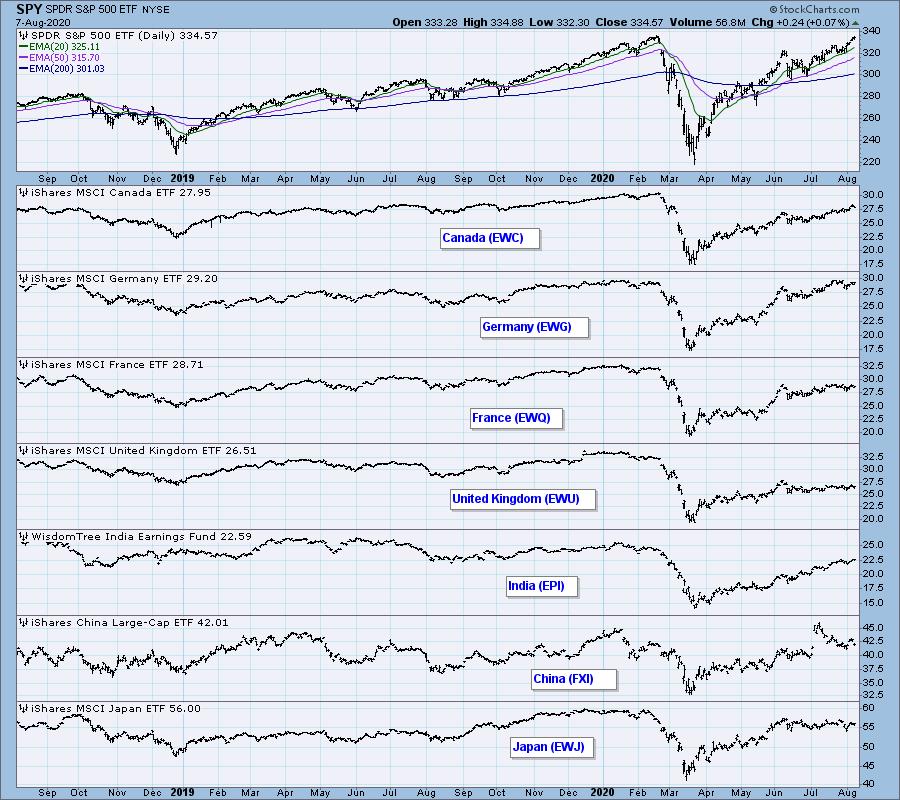
GLOBAL MARKETS
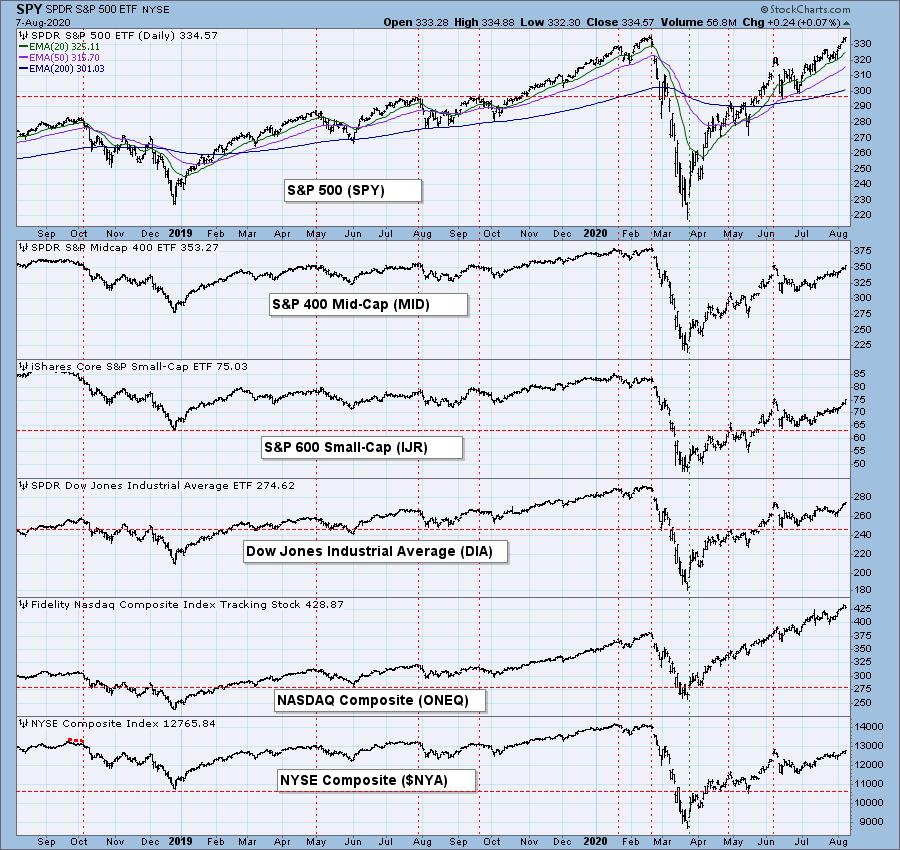
BROAD MARKET INDEXES
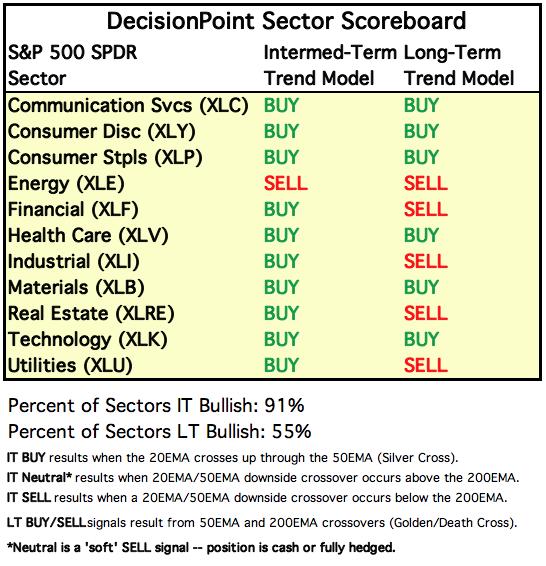
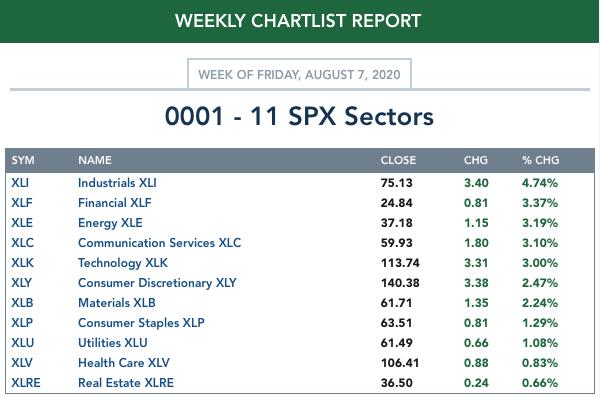
SECTORS
Each S&P 500 Index component stock is assigned to one, and only one, of 11 major sectors. This is a snapshot of the Intermediate-Term (Silver Cross) and Long-Term (Golden Cross) Trend Model signal status for those sectors.
ETF TRACKER: This is a list of about 100 ETFs intended to track a wide range of U.S. market indexes, sectors, global indexes, interest rates, currencies, and commodities. StockCharts.com subscribers can acquire it in the DecisionPoint Trend and Condition ChartPack.
Top 10 . . .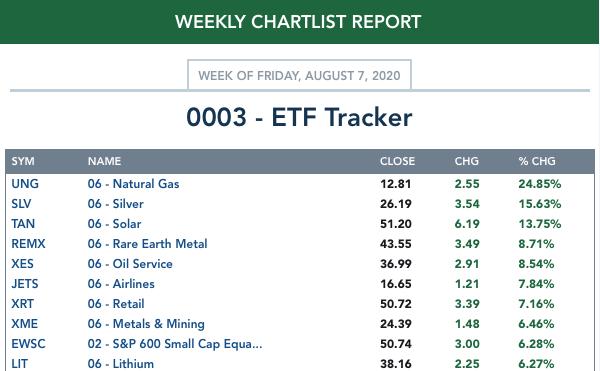
. . . and bottom 10: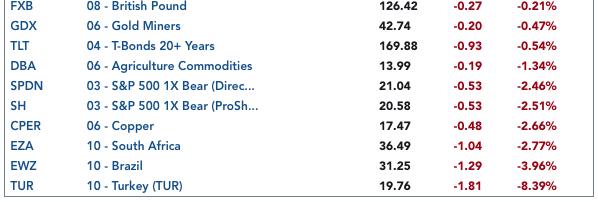
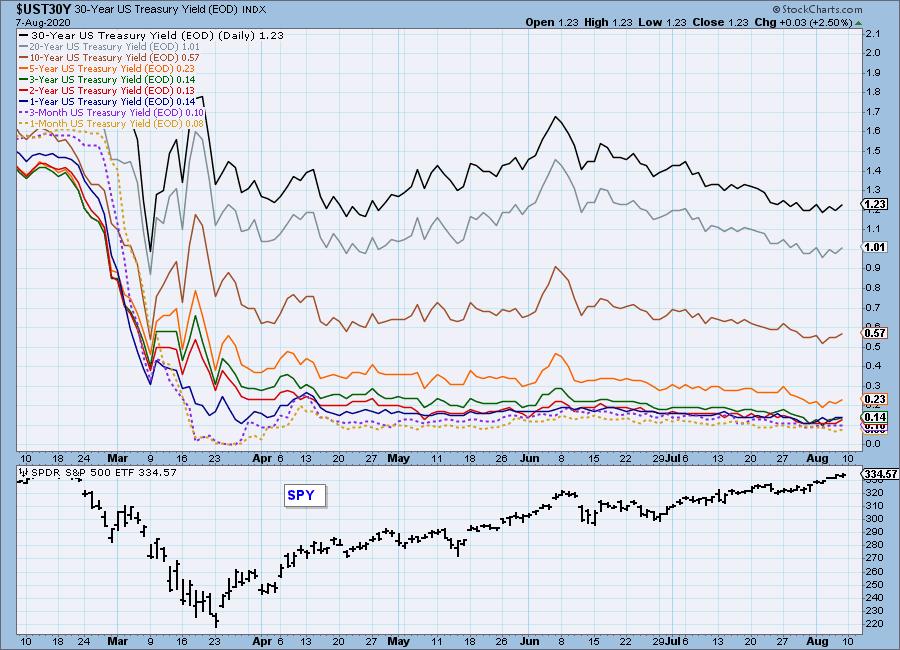
INTEREST RATES
This chart is included so we can monitor rate inversions. In normal circumstances the longer money is borrowed the higher the interest rate that must be paid. When rates are inverted, the reverse is true.
STOCKS
IT Trend Model: BUY as of 5/8/2020
LT Trend Model: BUY as of 6/8/2020
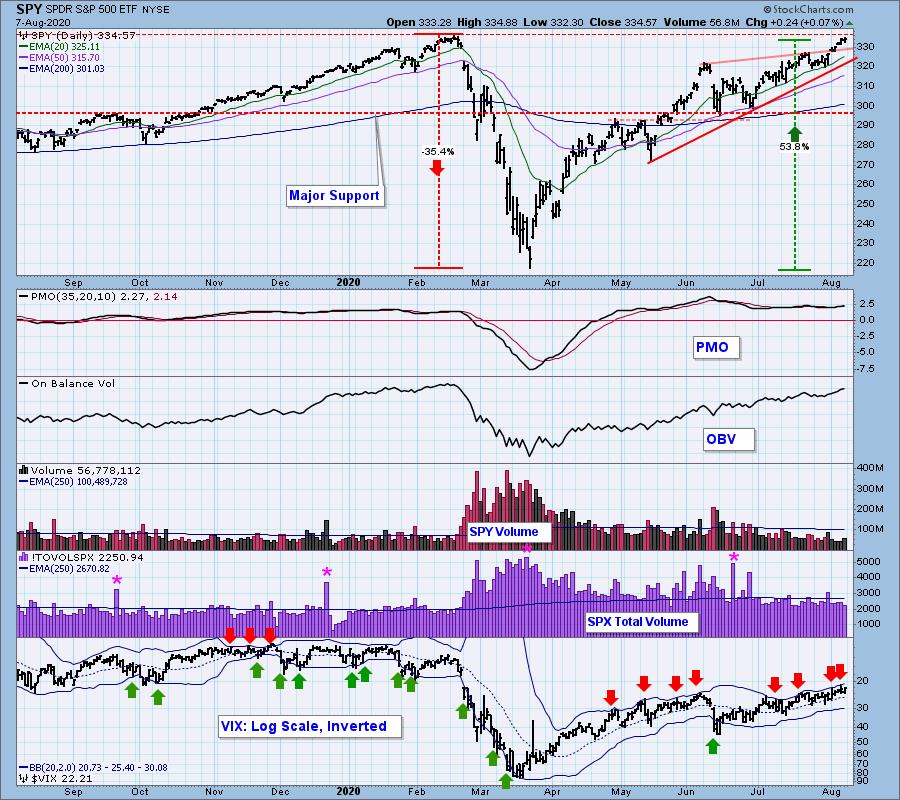
SPY Daily Chart: The daily PMO crossed up throught the signal line this week, but the exceedingly flat PMO configuration makes the crossover of little use in anticipating an outcome.
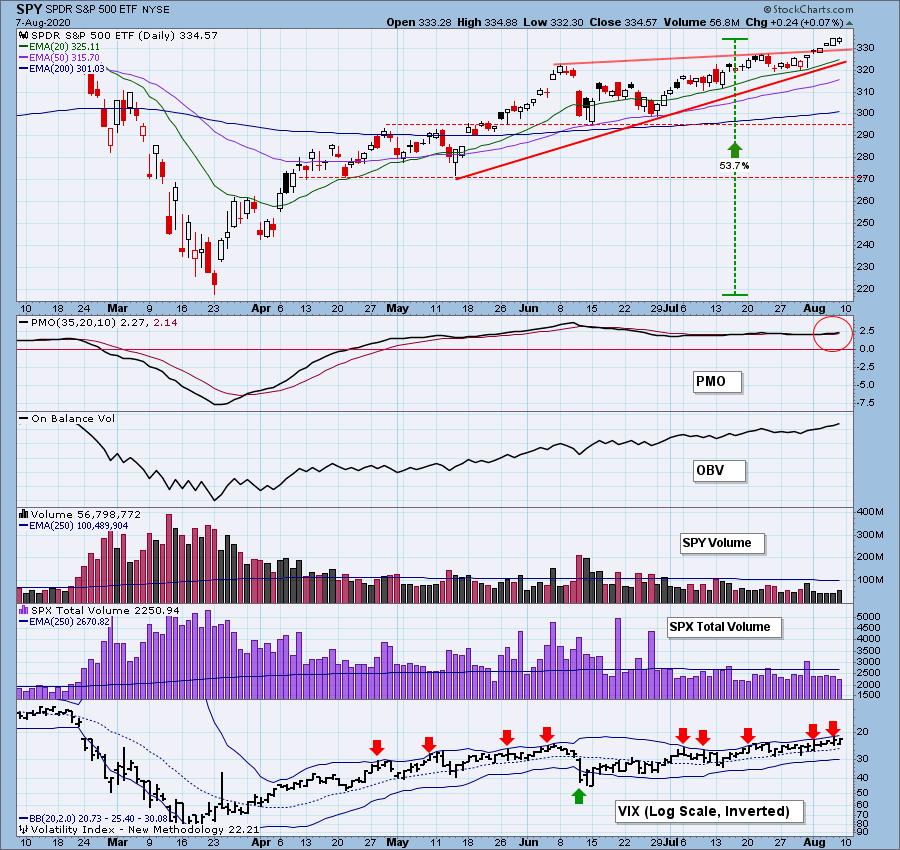
SPY is just a hair's breadth away from all-time highs, and the persistent up trend would seem to make new highs a done deal.
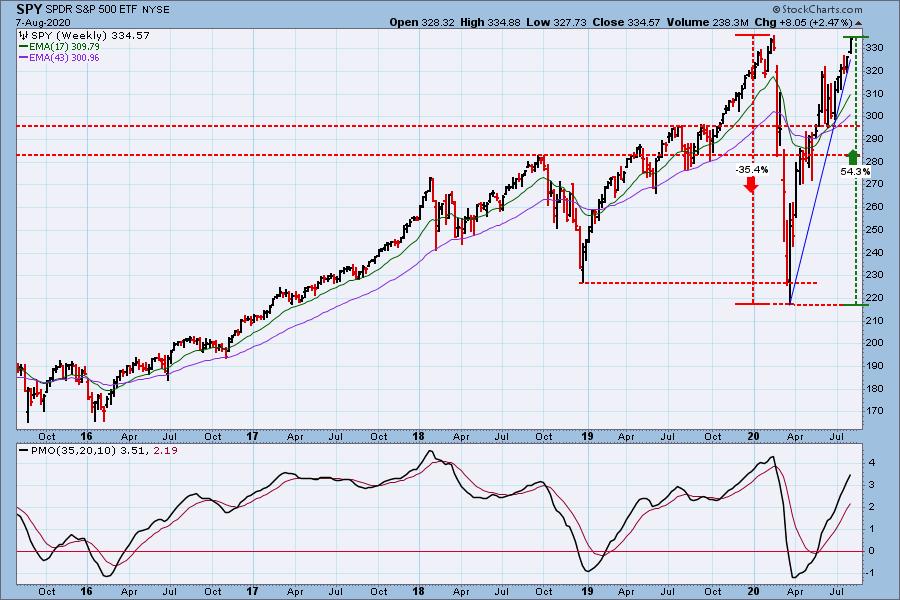
SPY Weekly Chart: [[comments]]
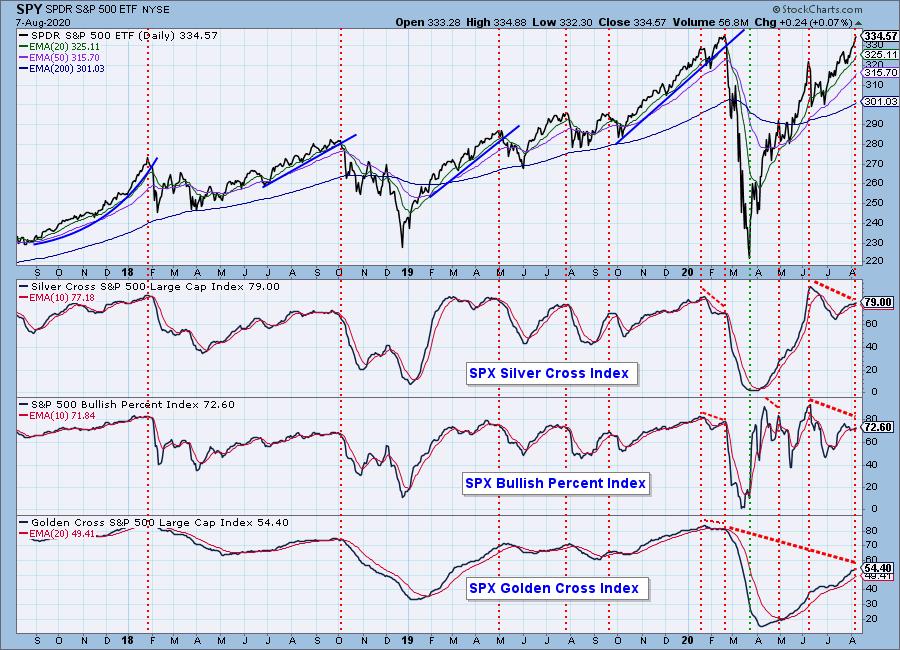
Participation: The following chart uses different methodologies for objectively showing the depth and trend of participation for intermediate- and long-term time frames.
- The Silver Cross Index (SCI) shows the percentage of SPX stocks on IT Trend Model BUY signals (20-EMA > 50-EMA).
- The Golden Cross Index (GCI) shows the percentage of SPX stocks on LT Trend Model BUY signals (50-EMA > 200-EMA).
- The Bullish Percent Index (BPI shows the percentage of SPX stocks on Point & Figure BUY signals.
The negative divergences on all three indexes tell us that participation is lacking. The divergence of the GCI versus its February top is profound.
Climactic Market Indicators: There were no climax days this week. Note that volume contracted on Friday's new rally high, and new highs are contracting into the top.
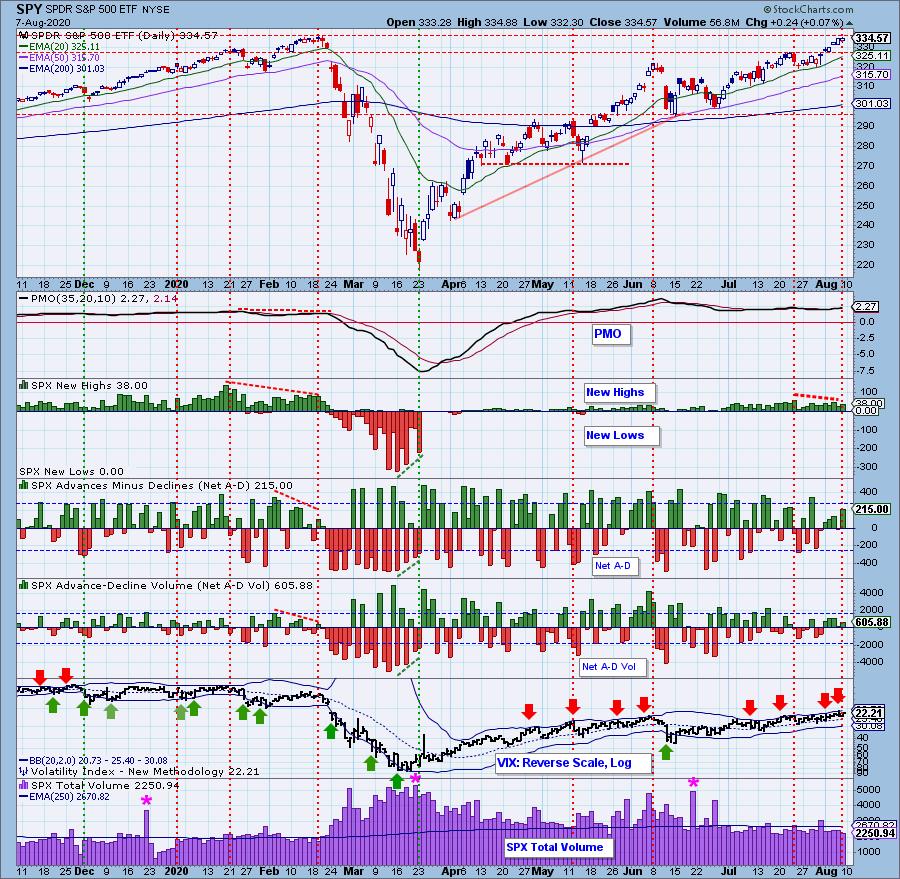
Short-Term Market Indicators: The short-term market trend is UP and the condition is NEUTRAL. The market bias in this time frame is modestly bullish.
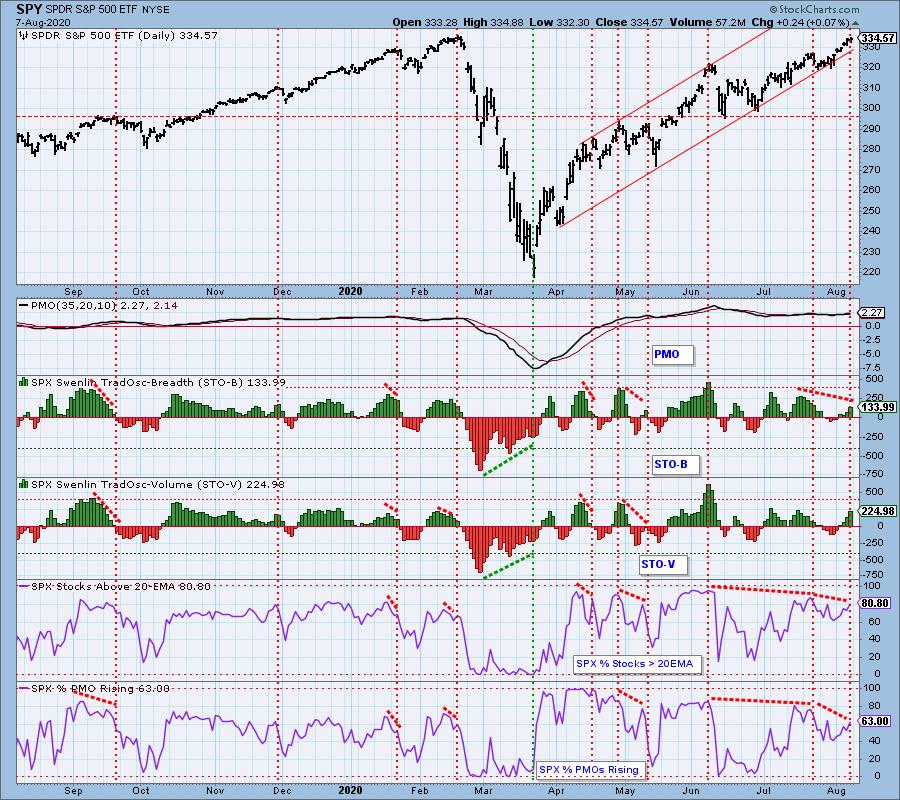
Intermediate-Term Market Indicators: The intermediate-term market trend is UP and the condition is NEUTRAL. The market bias in this time frame is somewhat bullish basis the ITBM, but neutral based upon the ITVM and Percent PMO BUY Signals.
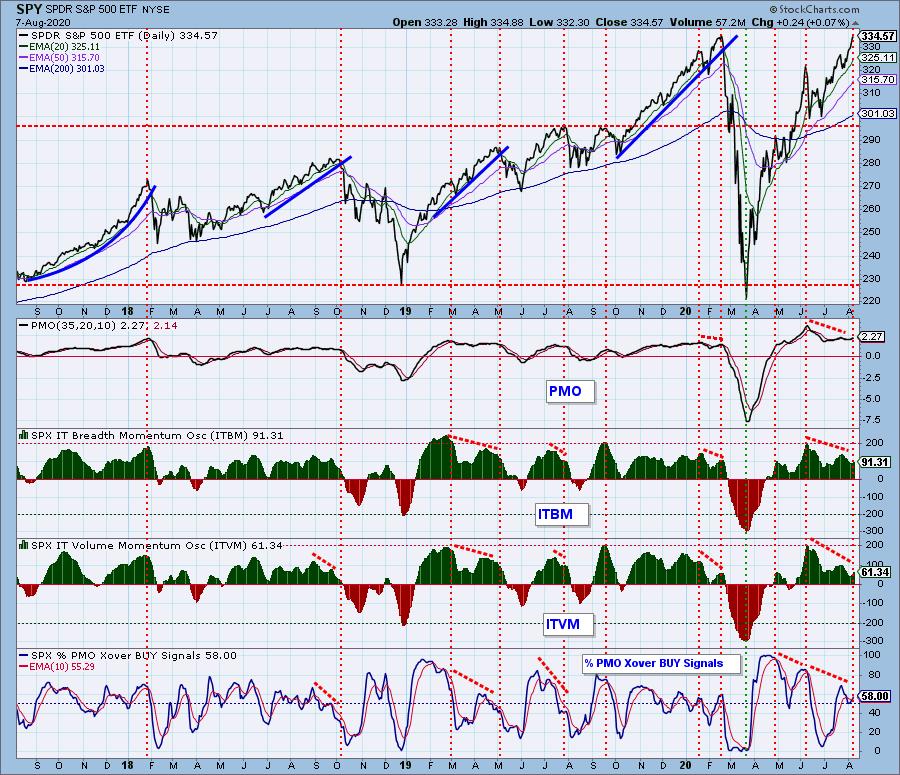
CONCLUSION: While there is no guarantee, I assume that we'll see new, all-time market highs next week -- they are only about one percent away -- however, we now have a potential double top problem. The presumed resistance from the February top is accompanied by numerous negative divergences, and internals are not expanding upward with along with rising prices. I should emphasize that the divergences we had at the February top were not as severe as those we have now. It is not impossible for the divergences to eventually disappear as prices soar toward the heavens, but that is not the most likely outcome, in my opinion.
Have you subscribed the DecisionPoint Diamonds yet? DP does the work for you by providing handpicked stocks/ETFs from exclusive DP scans! Add it with a discount! Contact support@decisionpoint.com for more information!
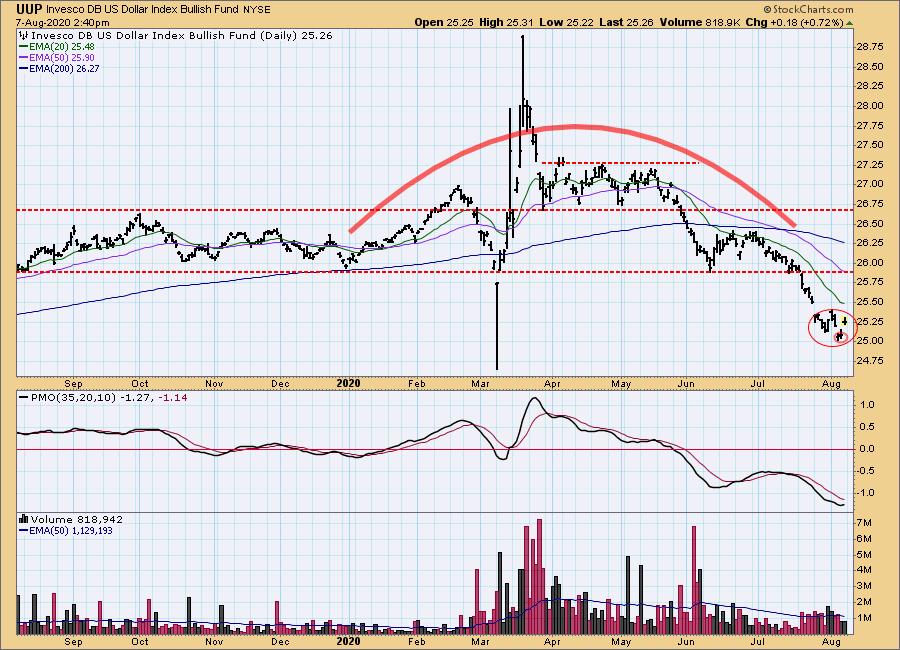
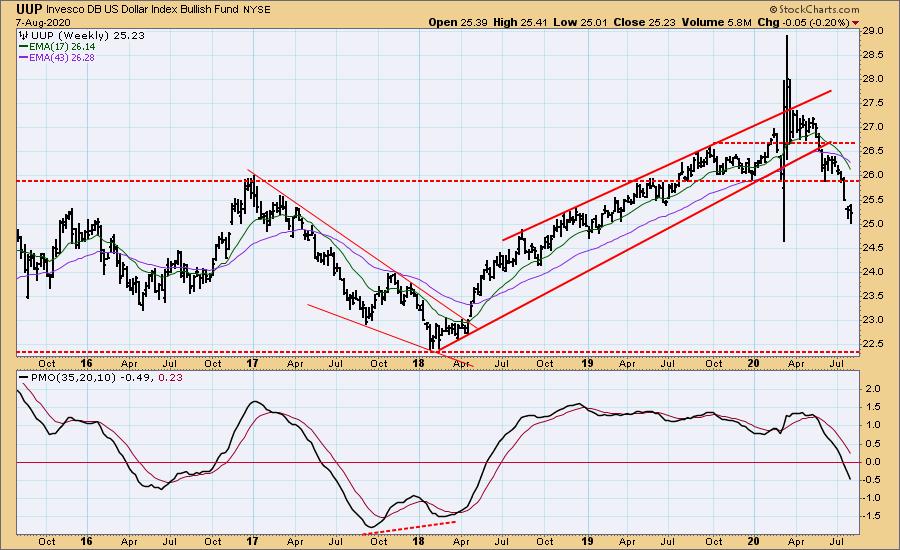
DOLLAR (UUP)
IT Trend Model: NEUTRAL as of 5/28/2020
LT Trend Model: SELL as of 7/10/2020
UUP Daily Chart: On Friday, UUP bounced back up across the gap of a tiny, two-bar island, but a larger island has formed over the last two weeks. The daily PMO has bottomed, so we may see a island reversal.
UUP Weekly Chart: We can see the island in this time frame, but the weekly PMO is falling, discouraging hope that the trend will turn upward.
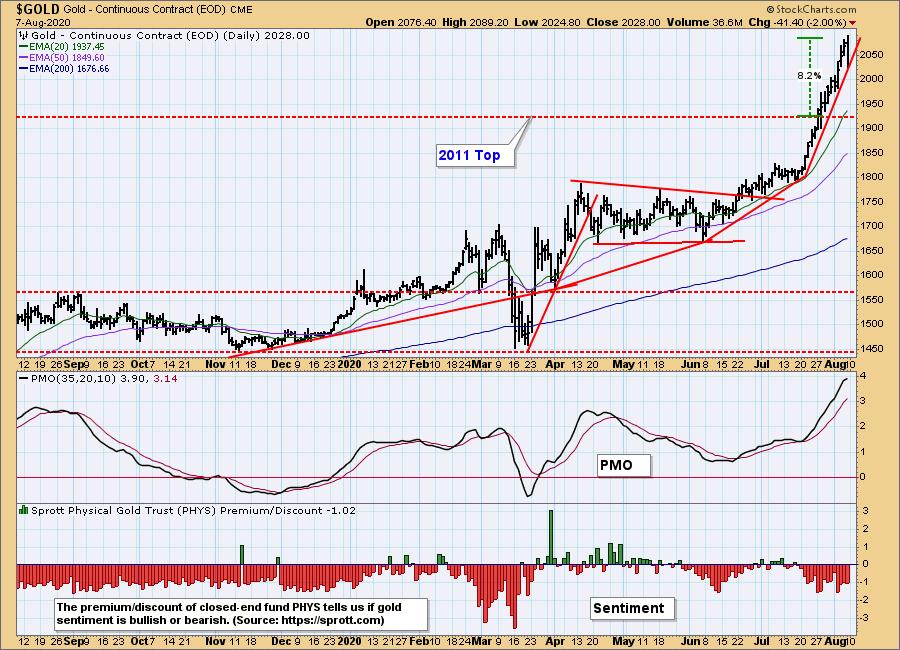
GOLD
IT Trend Model: BUY as of 3/24/2020
LT Trend Model: BUY as of 1/8/2019
GOLD Daily Chart: On the continuous contract daily gold chart below, the breakout above the long-term resistance at 1923.70 is substantial, and it looks to be about 50% of the total move from 1800. On such a steep move the technical expectation would be a pullback of 50%, which would take price all the way back to the point of breakout.
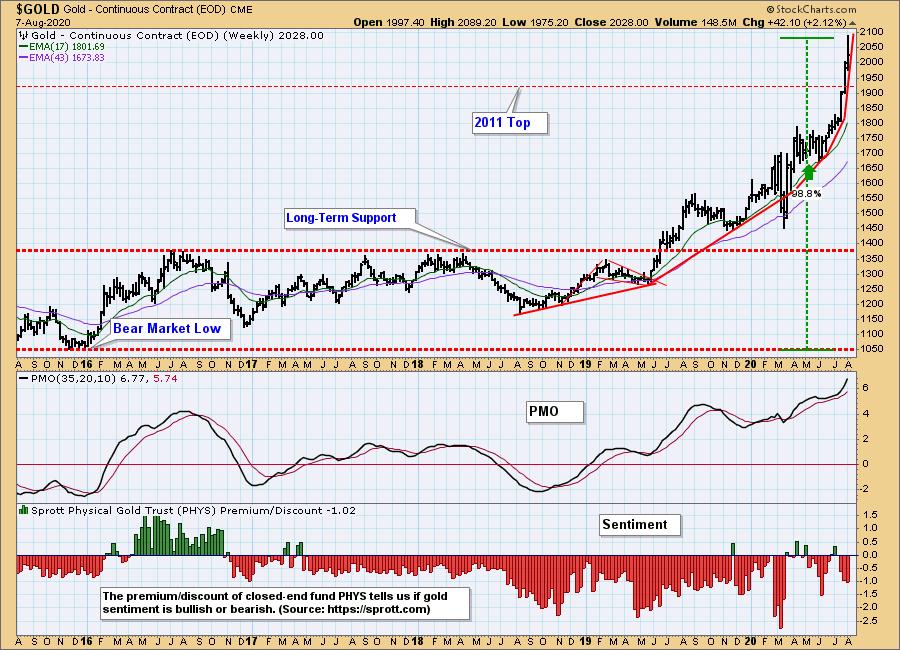
GOLD Weekly Chart: In this time frame, the rally from the 2018 low has clearly turned parabolic, the kind of move typically driven by excess bullishness and most often ends in a collapse; however, we can see that sentiment for gold is still slightly bearish, so there is a good chance that a collapse is not in the cards. An alternate outcome could be a high-level consolidation, whereby price moves sideways for a period of time and consolidates the gains.
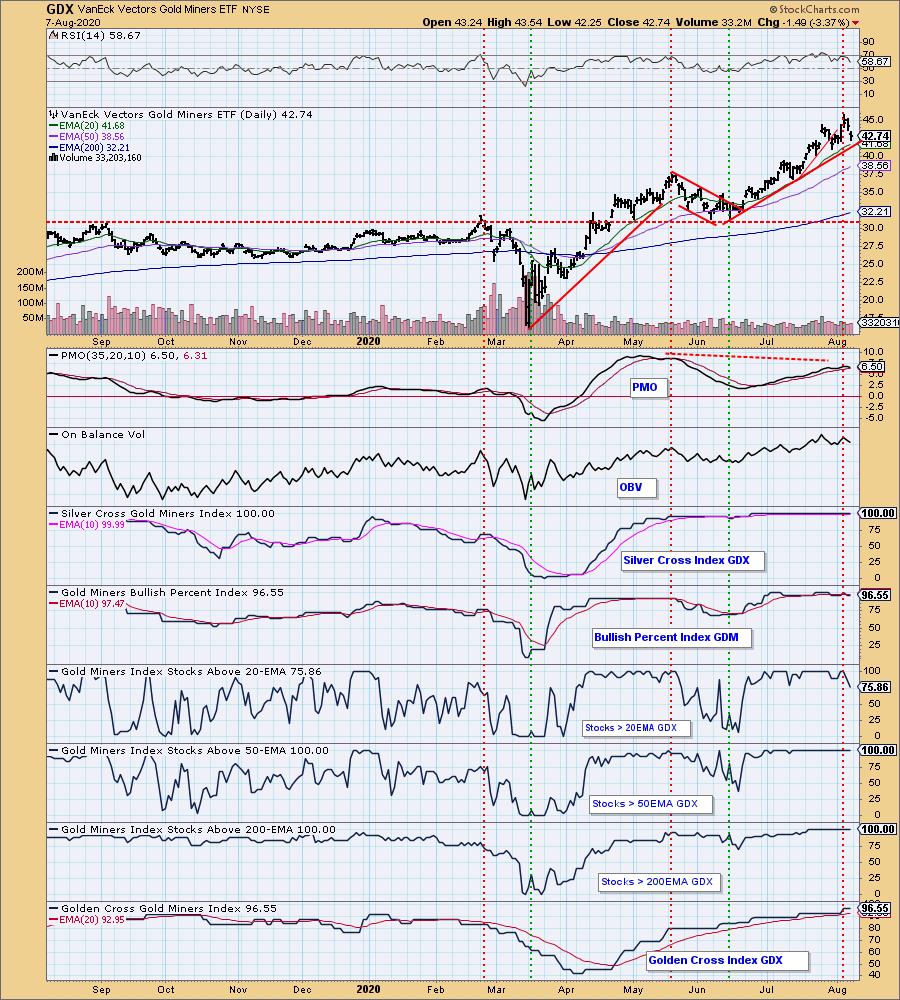
GOLD MINERS Golden and Silver Cross Indexes: GDX is pulling back to the short-term rising trend line, and most of the indicators are confirming the rally.
CRUDE OIL (USO)
IT Trend Model: NEUTRAL as of 1/27/2020
LT Trend Model: SELL as of 2/3/2020
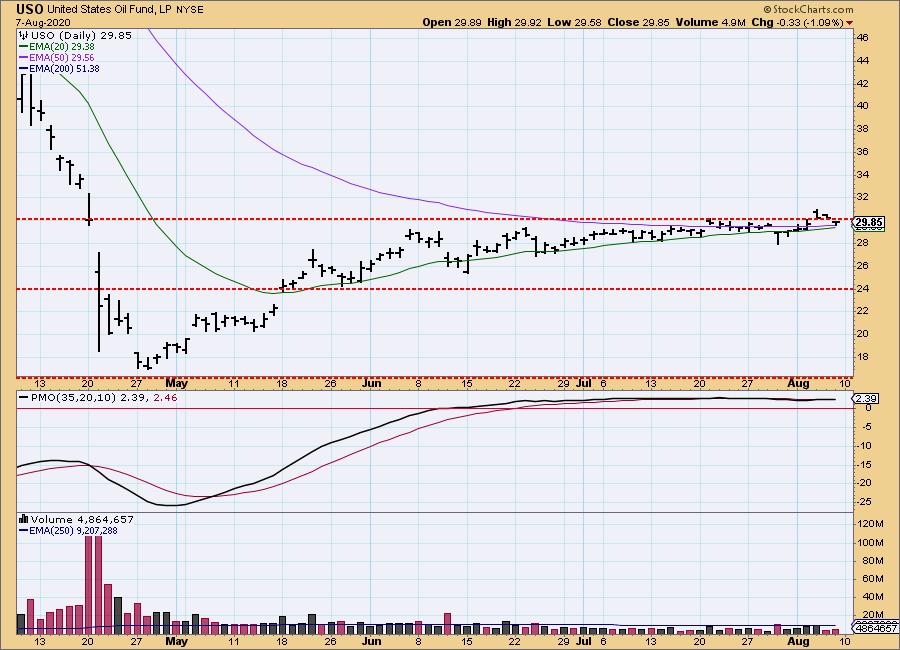
USO Daily Chart: Crude has been moving sideways for a few months. Note that the 20EMA and 50EMA are gradually closing the gap between them, but price has been so flat, a small increase in volatility could cause a lot of whipsaw crossovers without any clarification in trend direction.
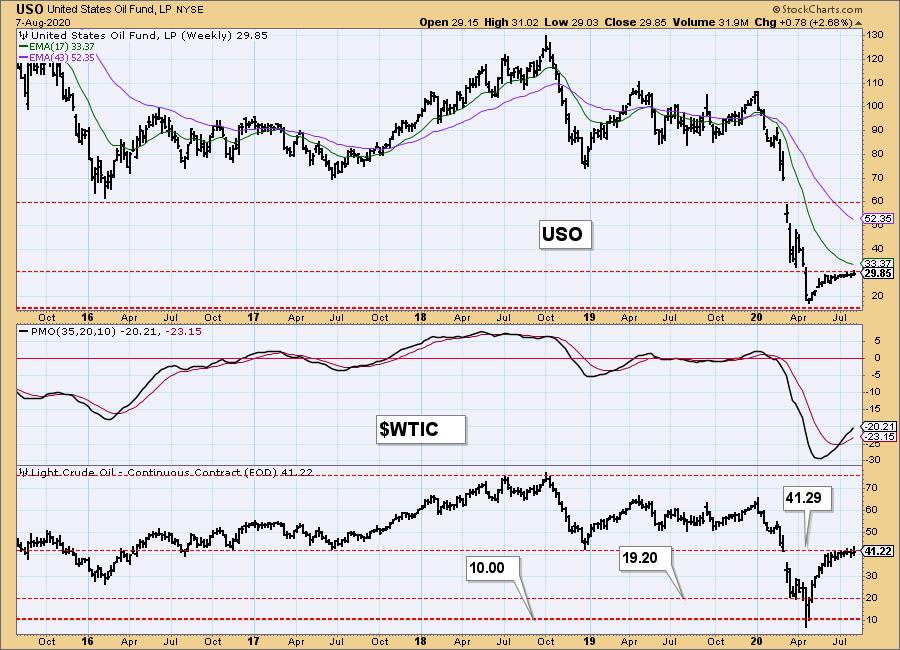
USO/$WTIC Weekly Chart: The price of WTIC has settled about midway between the high and low for the year, whereas USO has settled near the low end of that range, which illustrates the friction involved in maintaining a portfolio of futures contracts.
BONDS (TLT)
IT Trend Model: BUY as of 6/26/2020
LT Trend Model: BUY as of 1/2/2019
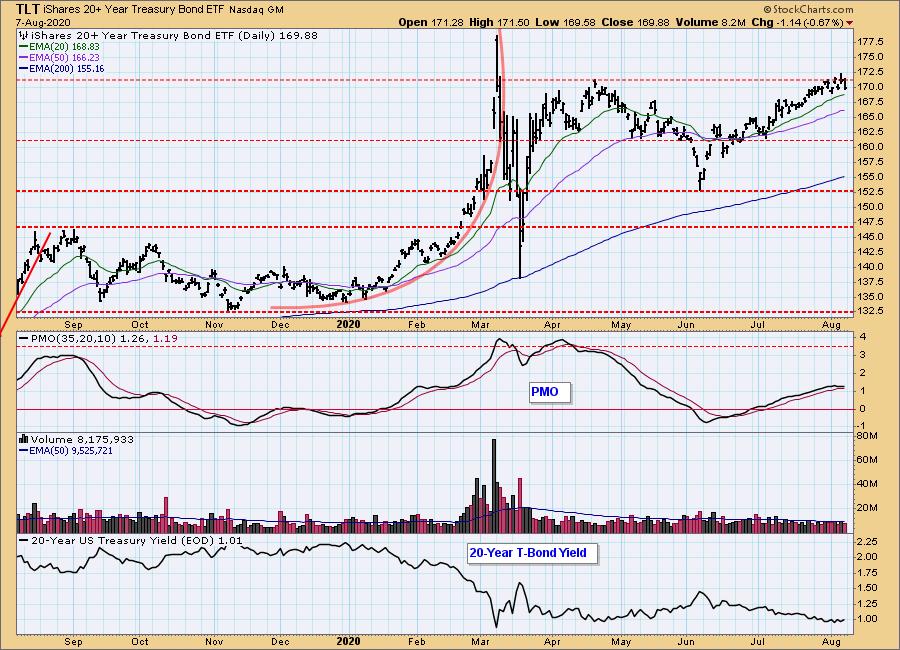
TLT Daily Chart: TLT tried for a breakout this week, but the daily PMO has topped, and, with the Fed on hold, I don't see any fundamental trigger to sustain a breakout.
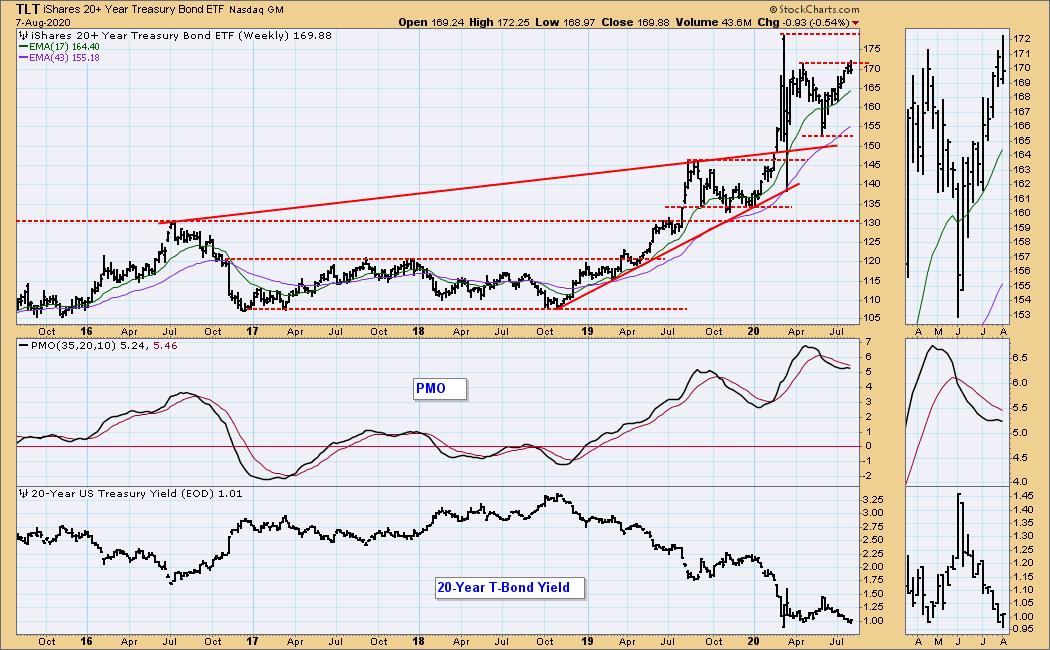
TLT Weekly Chart: I added a thumbnail to this chart, because it shows the weekly PMO topping below the signal line. Price may be headed back to the bottom of the trading range, about 153.
Technical Analysis is a windsock, not a crystal ball.
Happy Charting! - Carl
Disclaimer: This blog is for educational purposes only and should not be construed as financial advice. The ideas and strategies should never be used without first assessing your own personal and financial situation, or without consulting a financial professional. Any opinions expressed herein are solely those of the author, and do not in any way represent the views or opinions of any other person or entity.
NOTE: The signal status reported herein is based upon mechanical trading model signals, specifically, the DecisionPoint Trend Model. They define the implied bias of the price index based upon moving average relationships, but they do not necessarily call for a specific action. They are information flags that should prompt chart review. Further, they do not call for continuous buying or selling during the life of the signal. For example, a BUY signal will probably (but not necessarily) return the best results if action is taken soon after the signal is generated. Additional opportunities for buying may be found as price zigzags higher, but the trader must look for optimum entry points. Conversely, exit points to preserve gains (or minimize losses) may be evident before the model mechanically closes the signal.
Helpful DecisionPoint Links:
DecisionPoint Alert Chart List
DecisionPoint Golden Cross/Silver Cross Index Chart List
DecisionPoint Sector Chart List
Price Momentum Oscillator (PMO)
Swenlin Trading Oscillators (STO-B and STO-V)