
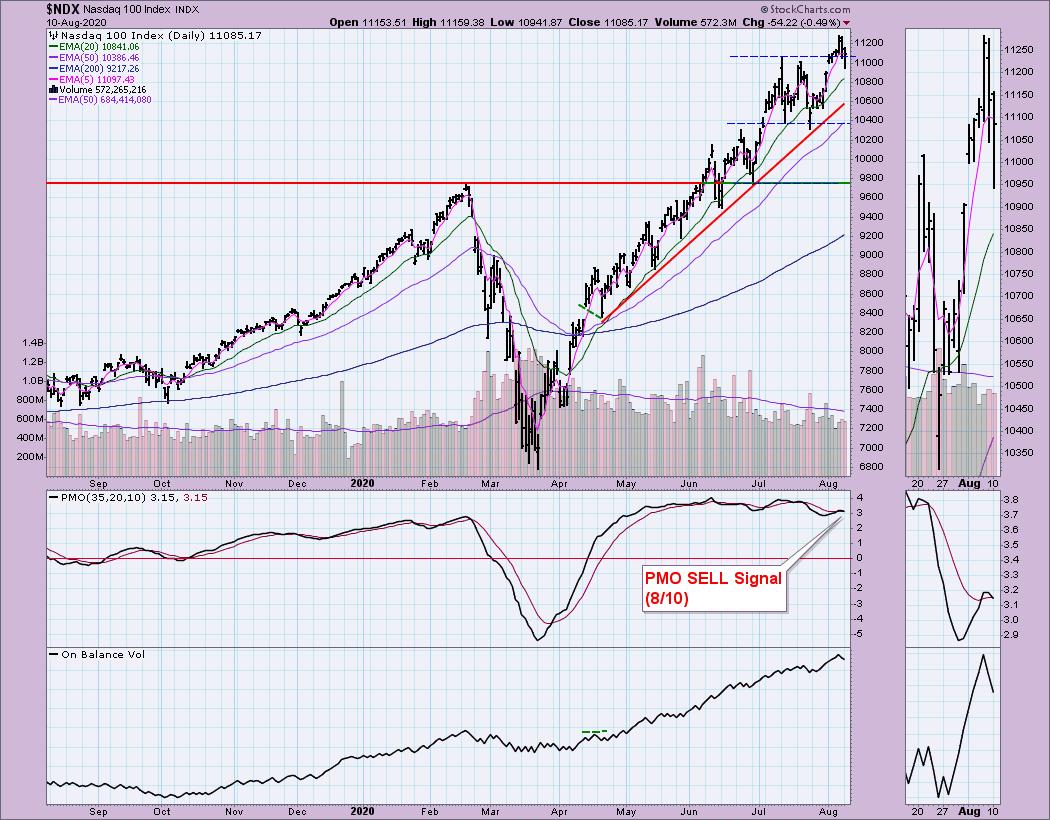
During today's DecisionPoint Show, Carl and I discussed the variances between the indexes right now and Carl zeroed in on Technology which is showing significant weakness. Now today, the NDX lost its Price Momentum Oscillator (PMO) BUY signal. My biggest concern here is that Technology has now become the backbone of the market. Before COVID-19, the Technology sector was considered aggressive, yet we have found through this crisis that Technology has now become a "staple". This sector always held the markets captive, but I think today it is even more true.
I would look on the bright side with the NDX in that it didn't close the gap. Typically when you see a gap closed you will get follow-through in that direction. Additionally, the OBV is still confirming the move up. However, support was lost at the July high and the 20-EMA is now in play for support. The PMO has a negative divergence with price along with that new SELL signal.
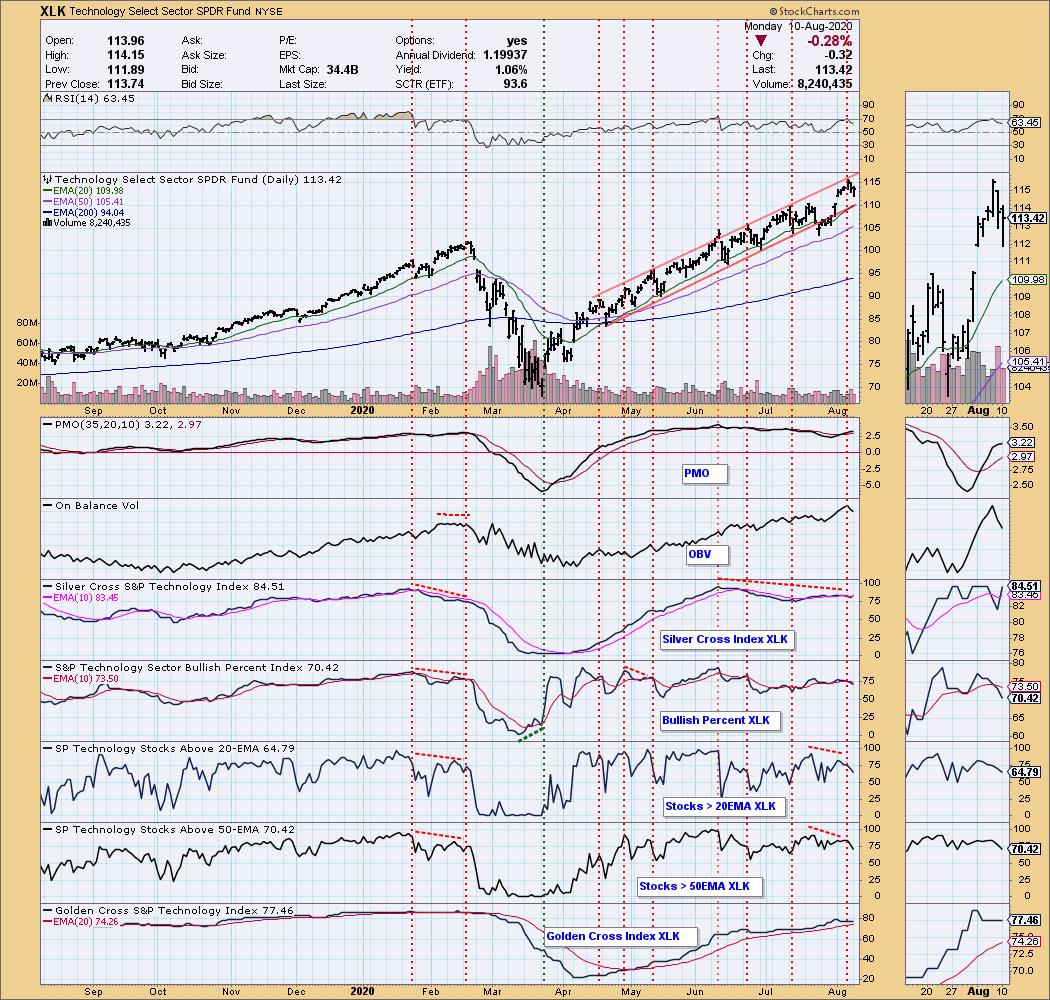
I believe that Technology is in trouble. There are better places to consider for investment. There is a clear island formation and it is shaped like an upside down "V". The 50-EMA will be critical support should this rising trend be compromised again. Notice that the PMO has decelerated. I also see deterioration on all but the "Silver Cross Index".
** PRICES ARE GOING UP! **
You do NOT need to concern yourself if you're happy with what you have. Your current rate will stay the same as long as your subscription remains in good standing. You can also switch to an annual subscription at anytime where you pay for 10 months and get 12 months.
For our DP Alert-only subscribers: You should consider our Bundle package. DP Diamonds Reports will be doubling to $50/mo so adding DP Diamonds later will be more expensive by far. Bundles currently are $50/mo or $500/yr.
If you add DP Diamonds after August 16th, it will cost you an additional $50/mo or $500/yr for a Bundle total of $80/mo or $800/yr after August 16th!
To summarize, if you don't have the Bundle, subscribe now before it becomes very expensive!
For my Diamonds subscribers, there will be a new 1-hour trading room, "The DecisionPoint Diamond Mine" on Fridays! It will be an opportunity for us to talk live, review current and past Diamonds for possible entries/exits/stops/targets and take your questions and symbol requests in this intimate trading room. But wait, there's more for Diamonds subscribers! I will be adding a Friday Diamonds Recap where I will look at the performance of that week's Diamonds and their prospects moving forward. Over the weekend we clean the slate and start over again.
There will also be a once a week free trading room, the "DecisionPoint Trading Room" for 1 hour on Tuesdays (we will keep our "diamonds" to ourselves though). I hope you enjoy the new changes that will be underway soon! **

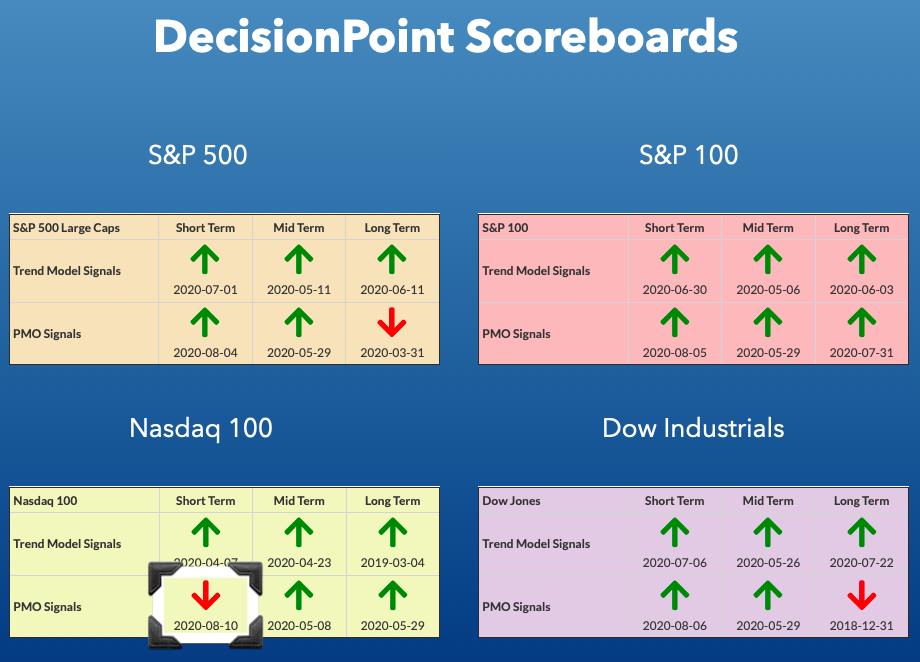
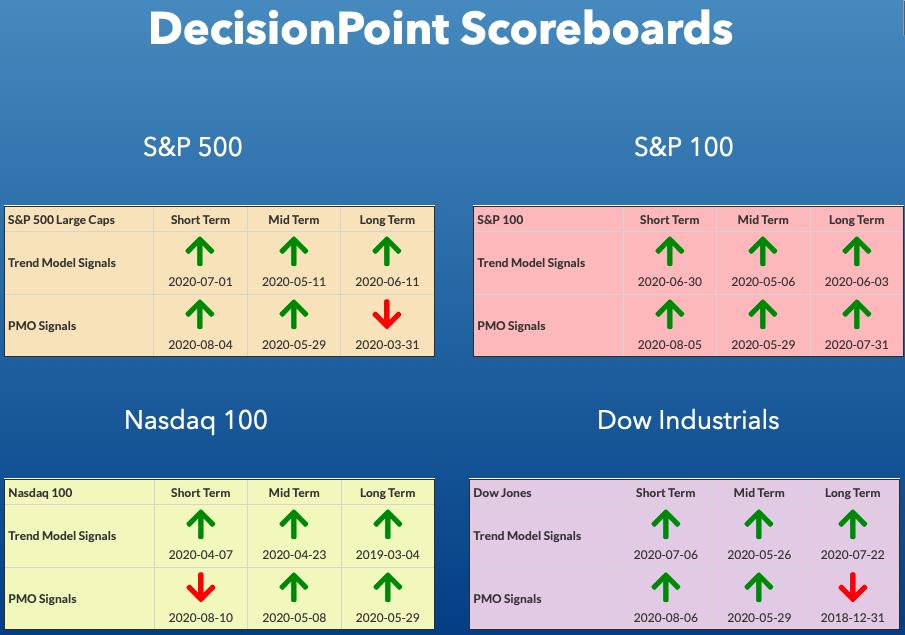
DP INDEX SCOREBOARDS:
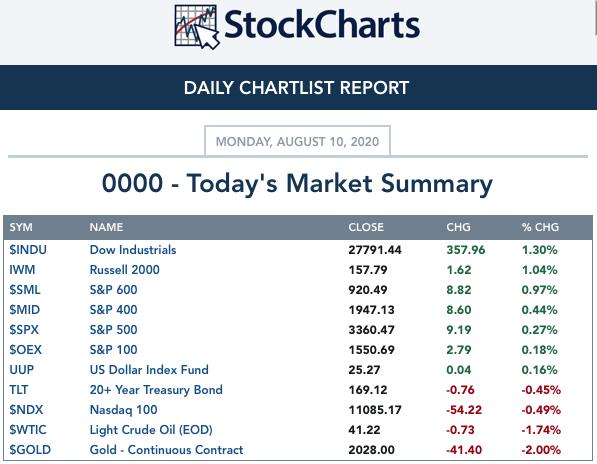
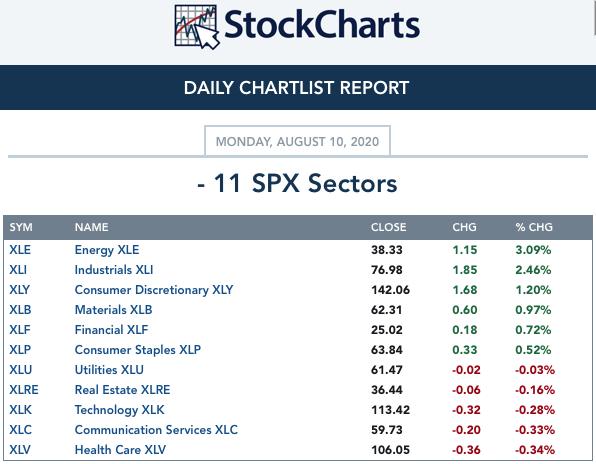
TODAY'S Broad Market Action:
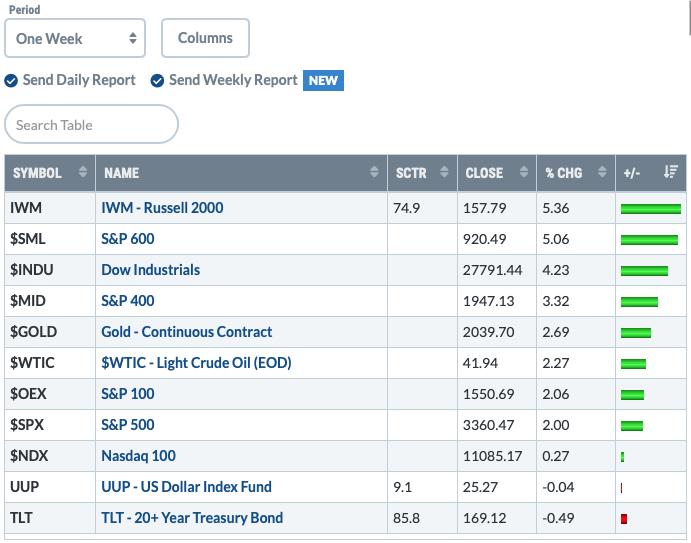
One WEEK Results:
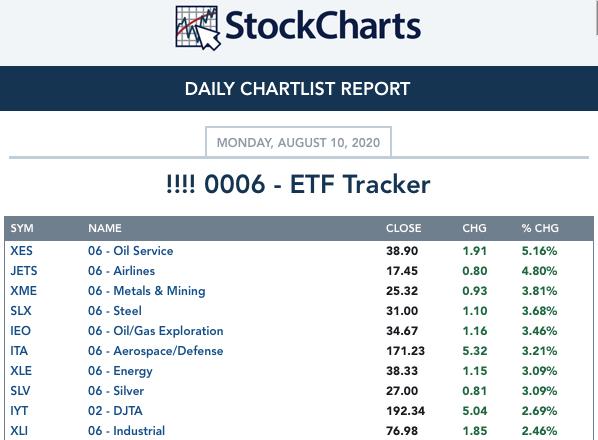
Top 10 from ETF Tracker:
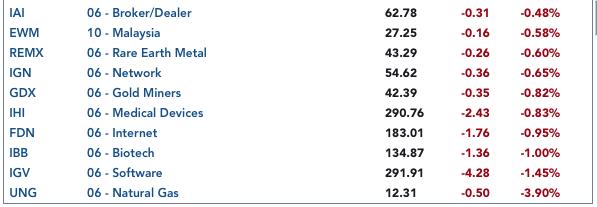
Bottom 10 from ETF Tracker:
On Friday, the DecisionPoint Alert Weekly Wrap presents an assessment of the trend and condition of the stock market (S&P 500), the U.S. Dollar, Gold, Crude Oil, and Bonds. Monday through Thursday the DecisionPoint Alert daily report is abbreviated and covers changes for the day.
Watch the latest episode of DecisionPoint on StockCharts TV's YouTube channel here!
SECTORS
SIGNALS:
Each S&P 500 Index component stock is assigned to one, and only one, of 11 major sectors. This is a snapshot of the Intermediate-Term (Silver Cross) and Long-Term (Golden Cross) Trend Model signal status for those sectors.
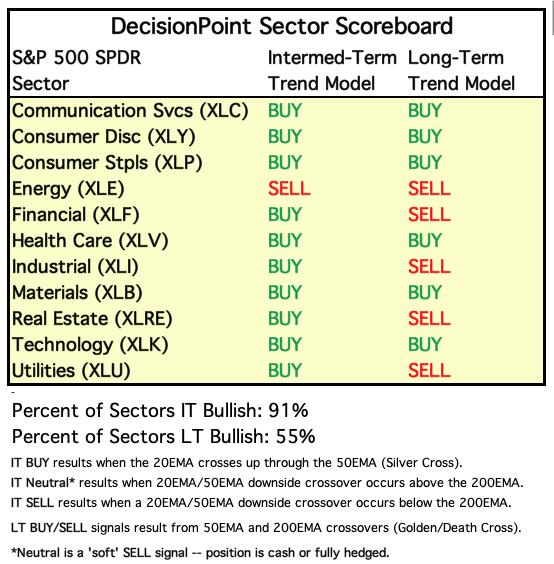
TODAY'S RESULTS:
One WEEK Results: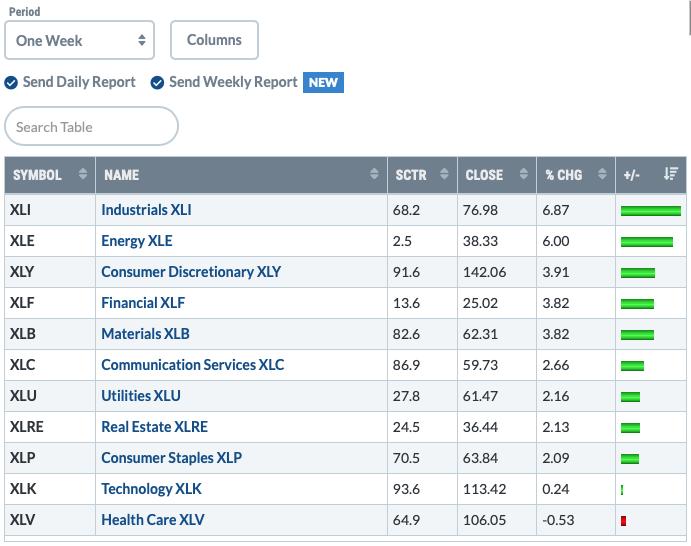
STOCKS
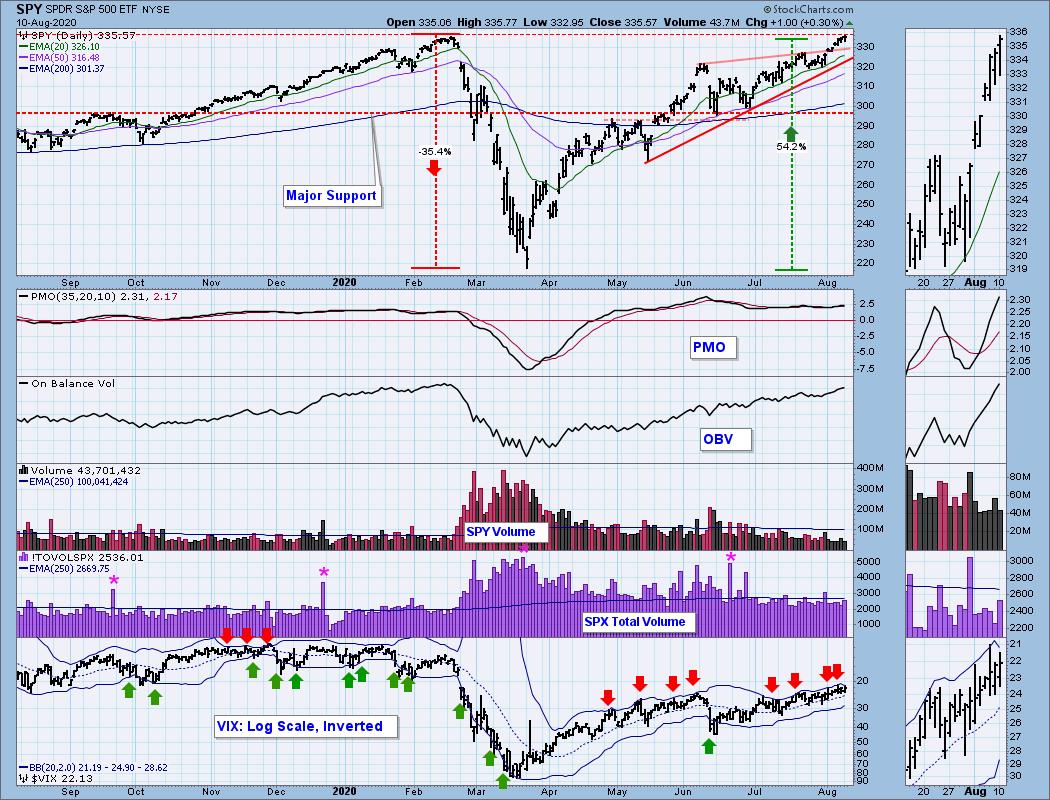
IT Trend Model: BUY as of 5/8/2020
LT Trend Model: BUY as of 6/8/2020
SPY Daily Chart: The SPY hit a new all-time intraday high and nearly closed there. Volume was up from Friday but still somewhat below the annual average. If the market were to fail, this is probably time as it struggles to overcome all-time highs while the Technology sector flounders. On the bright side, the VIX remains above its moving average on the inverted scale which implies internal strength in the very short term. Perhaps the all-time high will be logged tomorrow.
Climactic Market Indicators: We saw somewhat climactic numbers today to the upside. I would consider this a warning shot for a buying exhaustion.
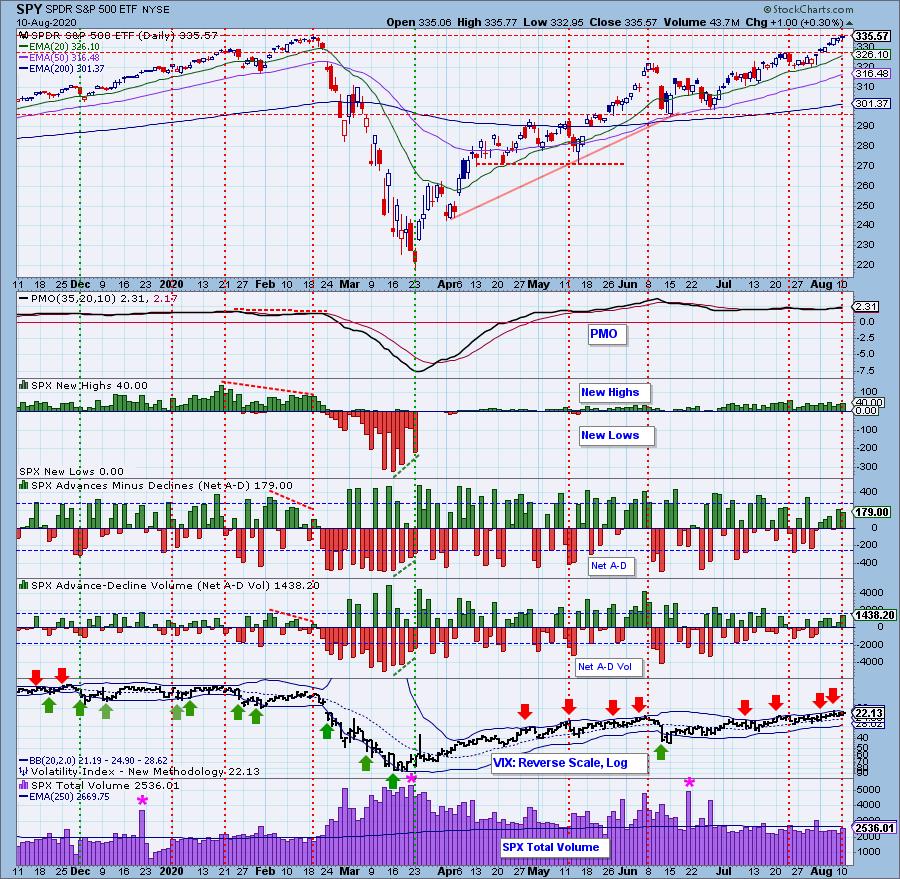
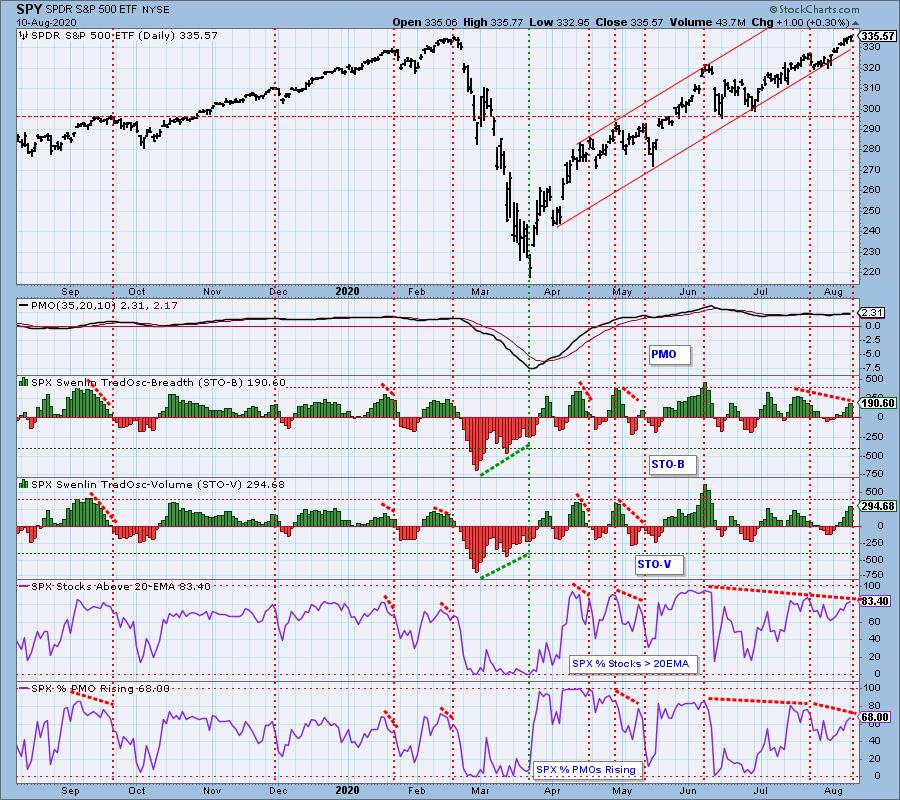
Short-Term Market Indicators: The short-term market trend is UP and the condition is OVERBOUGHT. Based upon the STO ranges, market bias is BULLISH. I like the look of these indicators as they are rising nicely. We still have a negative divergence between price at the STO-B, but the STO-V has avoided that. Should the STO-B continue higher, that negative divergence could clear.
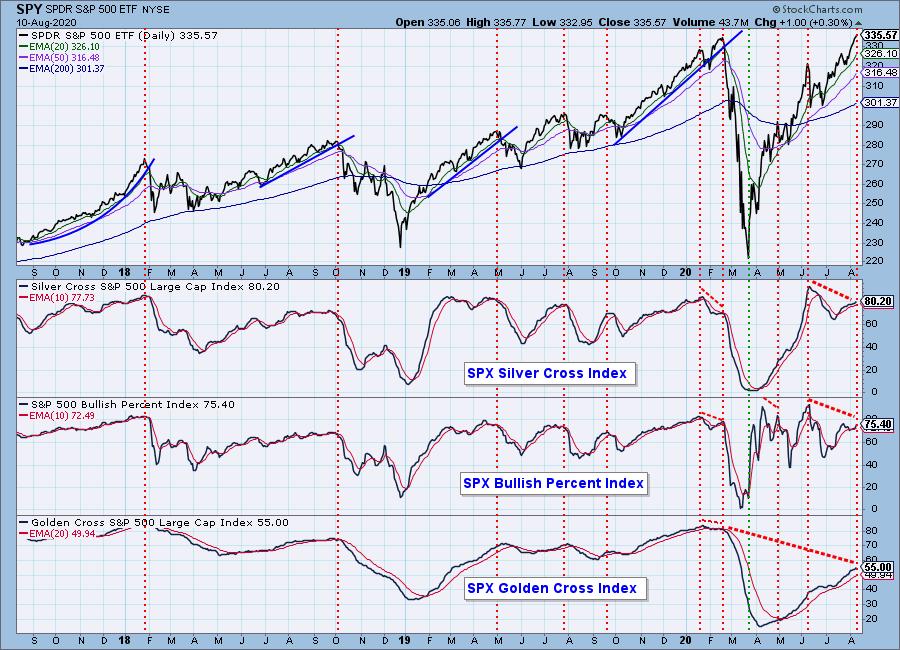
Intermediate-Term Market Indicators: The following chart uses different methodologies for objectively showing the depth and trend of participation for intermediate- and long-term time frames.
- The Silver Cross Index (SCI) shows the percentage of SPX stocks on IT Trend Model BUY signals (20-EMA > 50-EMA).
- The Golden Cross Index (GCI) shows the percentage of SPX stocks on LT Trend Model BUY signals (50-EMA > 200-EMA).
- The Bullish Percent Index (BPI shows the percentage of SPX stocks on Point & Figure BUY signals.
All of these indicators are rising, but still have negative divergences in play.
The intermediate-term market trend is UP and the condition is OVERBOUGHT. With most of the ITBM/ITVM readings since the end of April being above the zero lines, the market bias is BULLISH. These indicators look bullish, but they are getting a bit overbought.
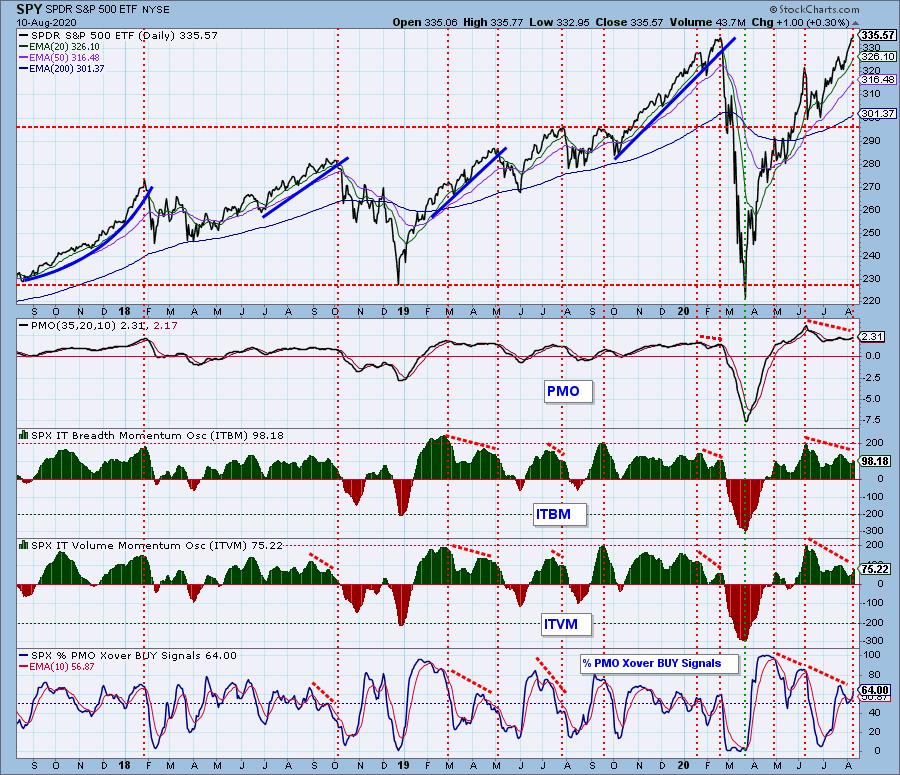
CONCLUSION: STOs are still rising and strong and IT indicators are still rising. Negative divergences are still out there and now I'm seeing more pullback lining up for Technology. If Technology breaks down I suspect it will take down many with it. There are still pockets of strength (Industrials for one) and XLK still can save itself, but that island looks mighty concerning.
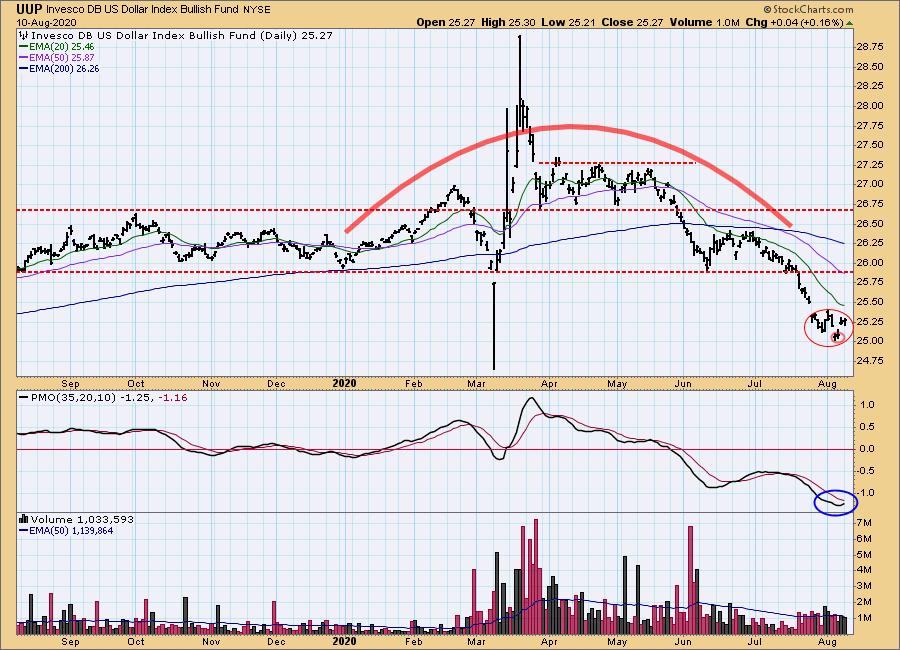
DOLLAR (UUP)
IT Trend Model: NEUTRAL as of 5/28/2020
LT Trend Model: SELL as of 7/10/2020
UUP Daily Chart: Carl suggested in Friday's Weekly Wrap that we could be looking at a two bar reverse island on UUP and he was correct. I also note the larger island. The PMO has turned up in oversold territory so this could be a possible rally point. Gold is in need of a pullback, so this could be the perfect storm.
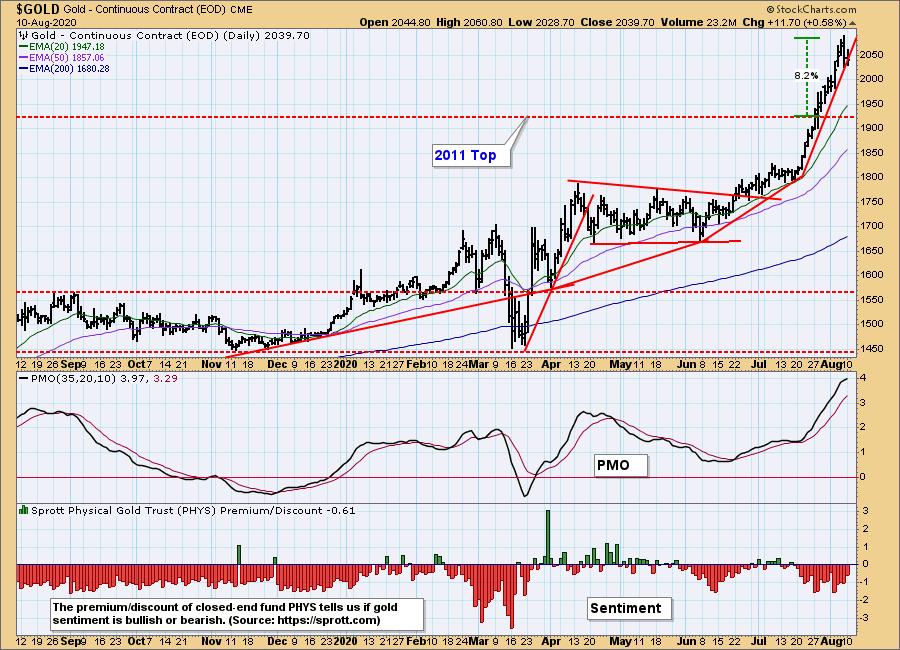
GOLD
IT Trend Model: BUY as of 3/24/2020
LT Trend Model: BUY as of 1/8/2019
GOLD Daily Chart: Gold faltered a bit last Friday and it is now clinging to the steep rising trendline. Carl and I both agree it is likely time for a pullback or pause on Gold. The PMO is beginning to top in very overbought territory. Should the Dollar rally higher, that will definitely put a damper on this rally. We still see discounts on PHYS which is bullish for Gold. It's time for a pullback and Carl and I are considering the 2011 top as the likely stopping point.
Full Disclosure: I own GLD long-term.
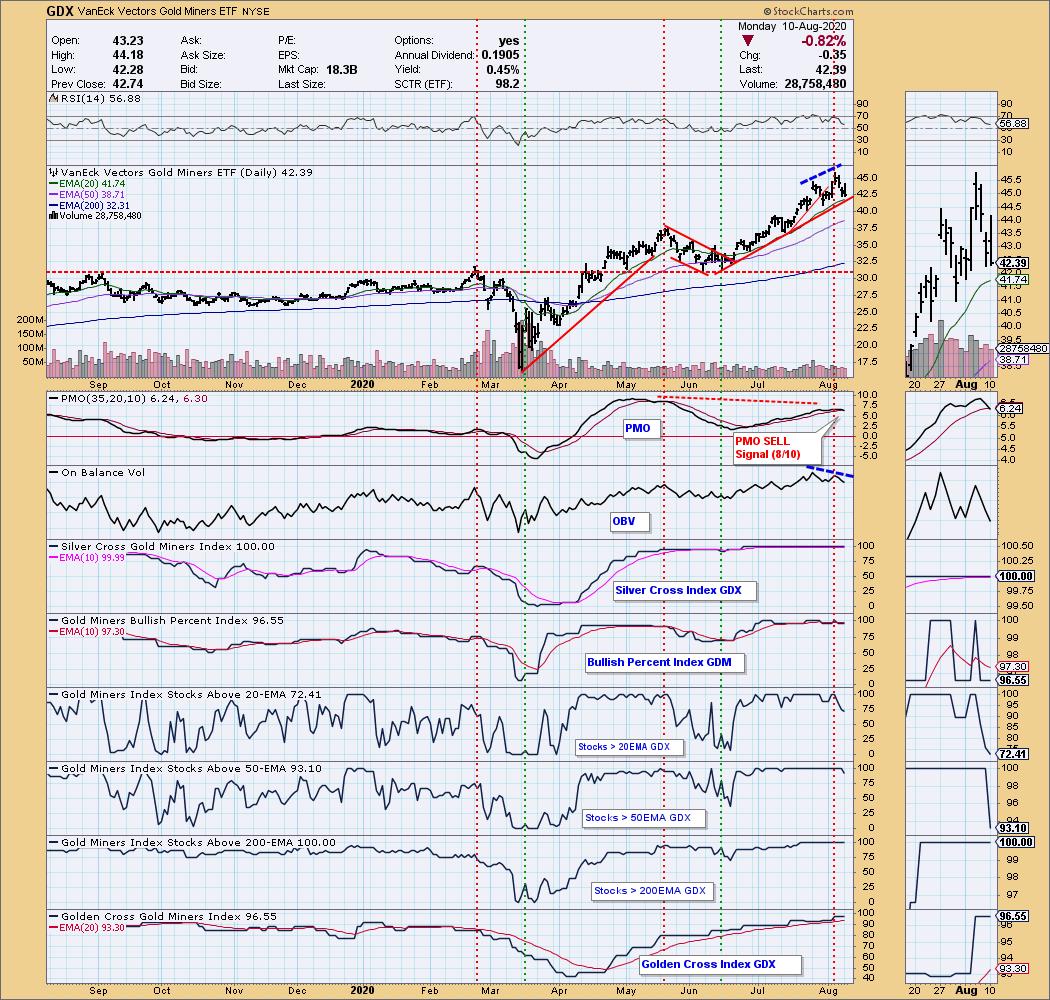
GOLD MINERS Golden and Silver Cross Indexes: We now have a PMO SELL signal on GDX. The rising trend hasn't been compromised yet and the 20-EMA is holding up. However, under the surface we can tell that there is deterioration based on the now declining indicators. If Gold pulls back, I would expect the Miners to follow. We have a significant negative divergence with the OBV.
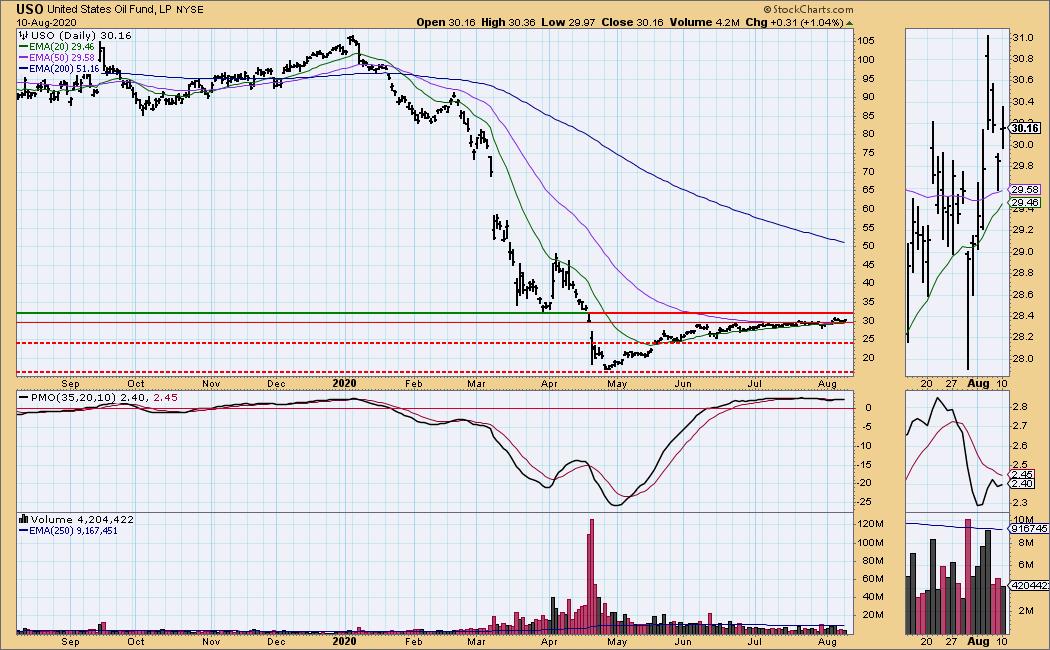
CRUDE OIL (USO)
IT Trend Model: NEUTRAL as of 1/27/2020
LT Trend Model: SELL as of 2/3/2020
USO Daily Chart: It took another pullback to the 50-EMA, but now we have prices back on the rise. The PMO is getting twitchy but it is rising. Seems price is struggling against resistance at the March low.
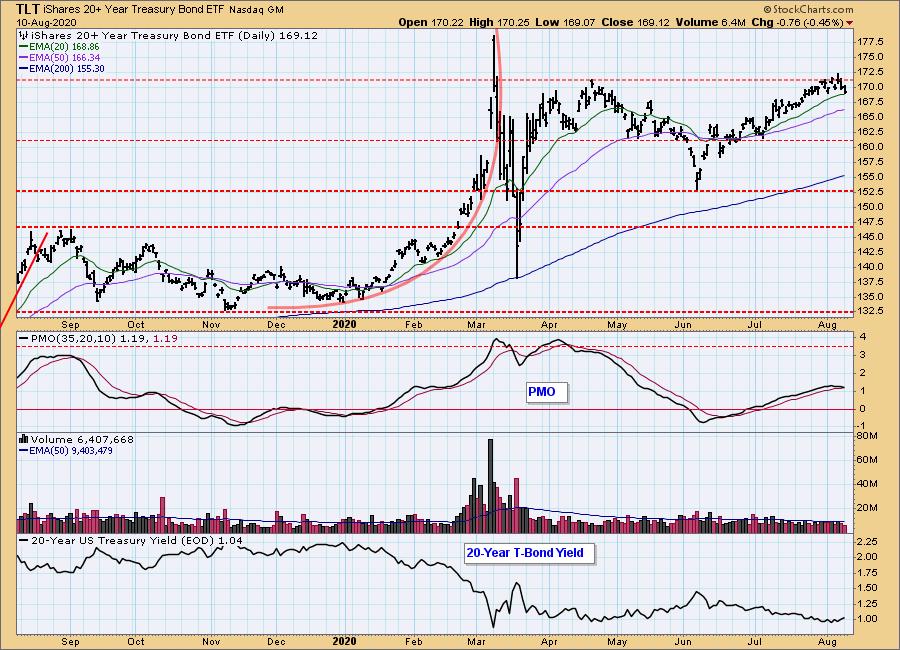
BONDS (TLT)
IT Trend Model: BUY as of 6/26/2020
LT Trend Model: BUY as of 1/2/2019
TLT Daily Chart: Definitely not likely the drop today, but happy that it held the 20-EMA. I suspect given the PMO topping that it may require a test of the 50-EMA.
Full disclosure: I own TLT.
Have you subscribed the DecisionPoint Diamonds yet? DP does the work for you by providing handpicked stocks/ETFs from exclusive DP scans! Get in on the new "DecisionPoint Diamond Mine" trading room as part of that subscription! Contact support@decisionpoint.com for more information!
Technical Analysis is a windsock, not a crystal ball.
Happy Charting! - Erin
Email: erin@decisionpoint.com
ANNOUNCEMENT:
I have the information for my VIRTUALpresentation at The Money Show!
I present on August 19th at 1:20p EST!
Click here for information on how to register to see me!

NOTE: The signal status reported herein is based upon mechanical trading model signals, specifically, the DecisionPoint Trend Model. They define the implied bias of the price index based upon moving average relationships, but they do not necessarily call for a specific action. They are information flags that should prompt chart review. Further, they do not call for continuous buying or selling during the life of the signal. For example, a BUY signal will probably (but not necessarily) return the best results if action is taken soon after the signal is generated. Additional opportunities for buying may be found as price zigzags higher, but the trader must look for optimum entry points. Conversely, exit points to preserve gains (or minimize losses) may be evident before the model mechanically closes the signal.
Helpful DecisionPoint Links (Can Be Found on DecisionPoint.com Links Page):
DecisionPoint Shared ChartList and DecisionPoint Chart Gallery
Price Momentum Oscillator (PMO)