
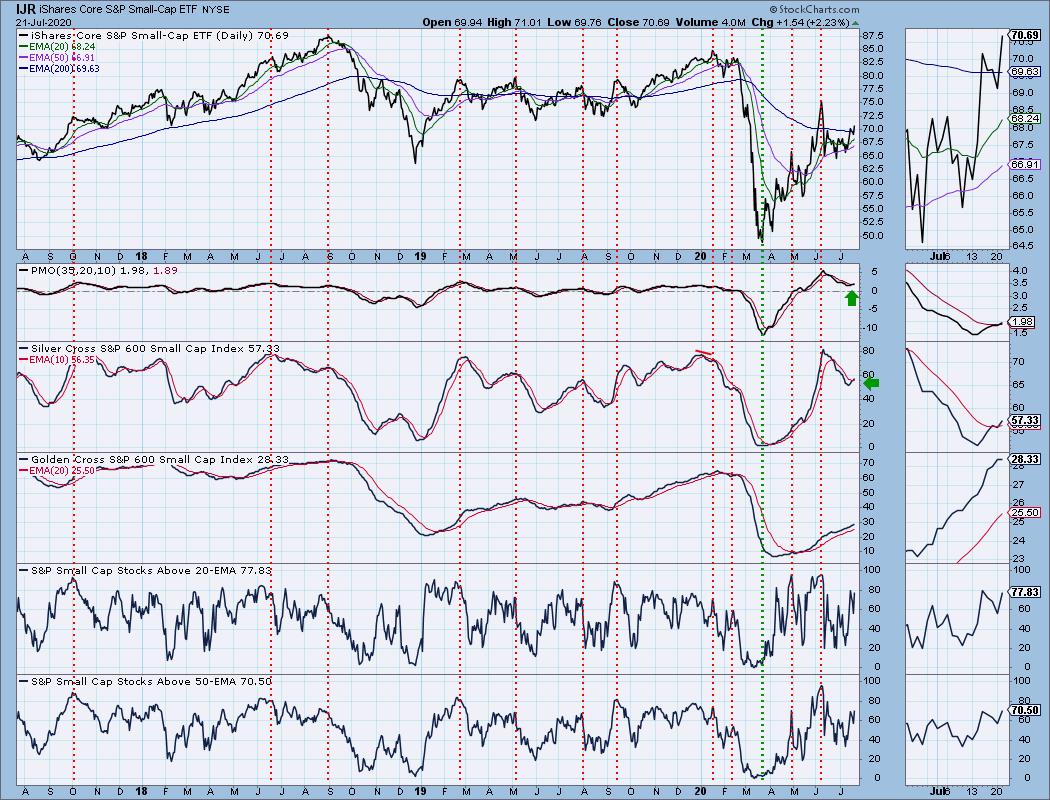
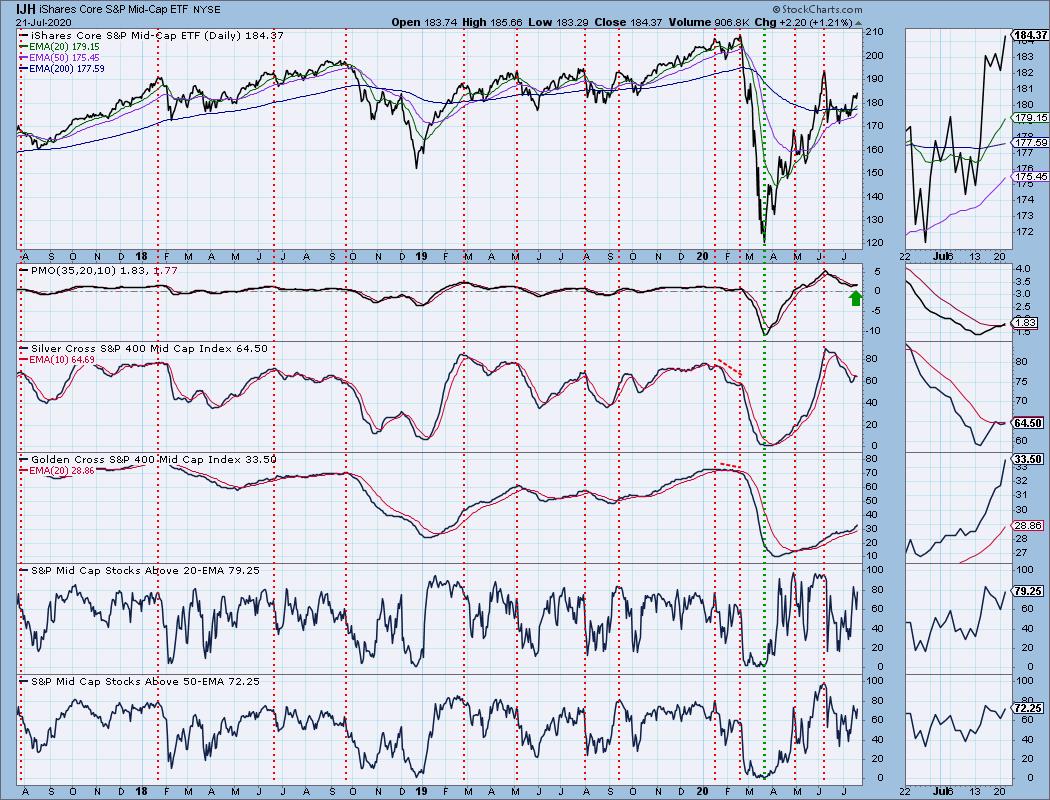
I've been noticing that the SP600 has been sitting at the top of my "one week results" table for some time. It wasn't a surprise to get notice today that both the SP600 (IJR) and SP400 (IJH) had positive PMO crossover BUY signals arrive. Below are the charts for IJR and IJH from our "Golden/Silver Cross Indexes" ChartList on DecisionPoint.com. Notice that IJR just had a positive crossover on the Silver Cross Index and IJH is nearing a similar crossover. We want to see smaller-cap stocks participating when the market rallies.
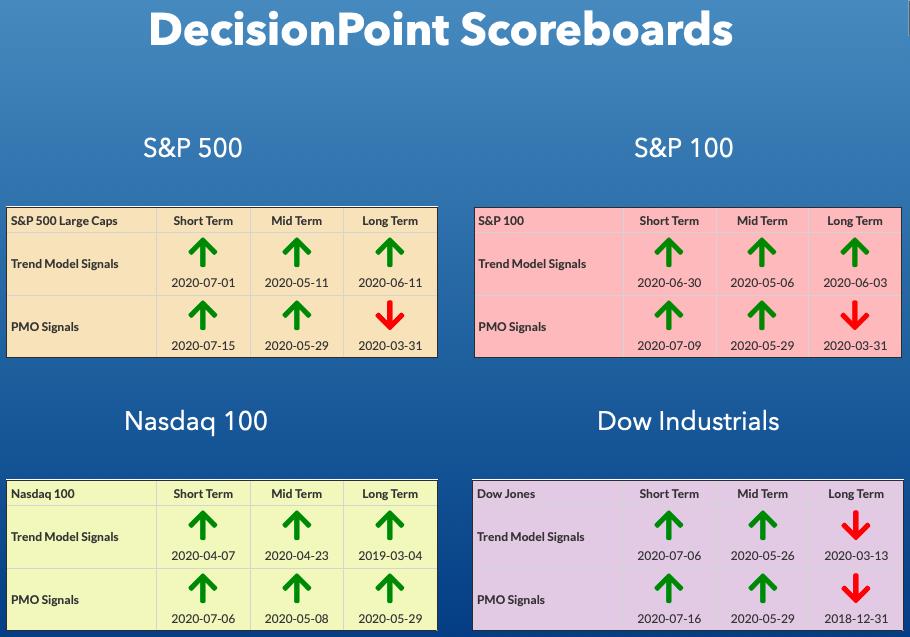
DP INDEX SCOREBOARDS:
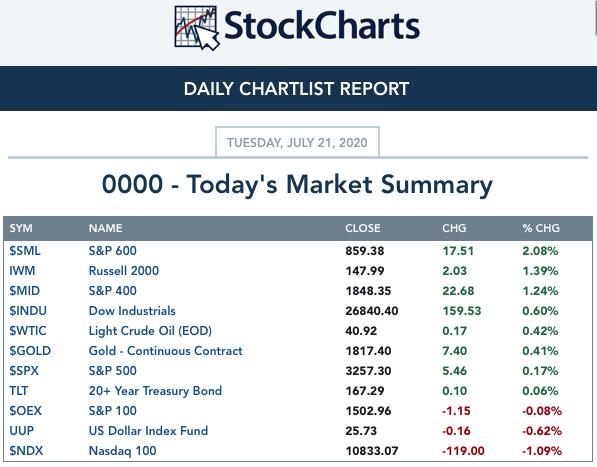
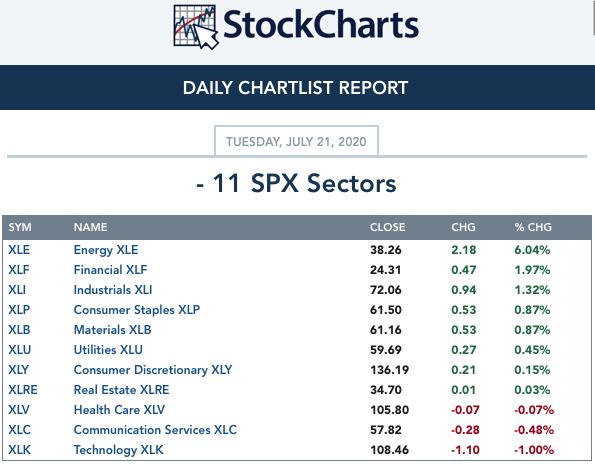
TODAY'S Broad Market Action:
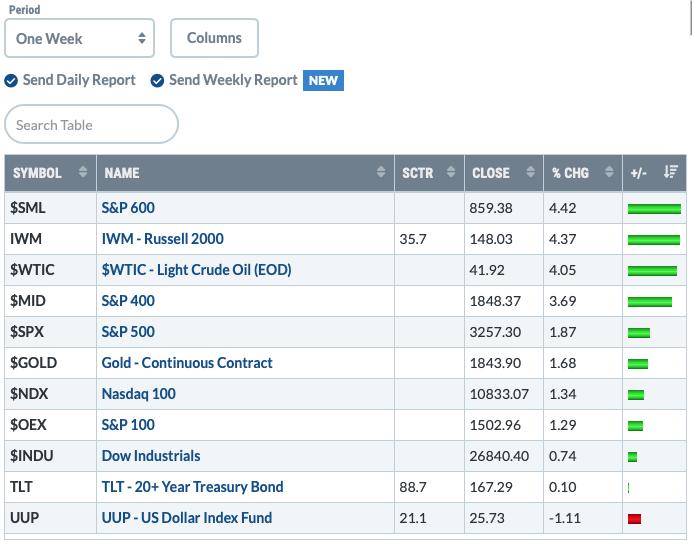
One WEEK Results:
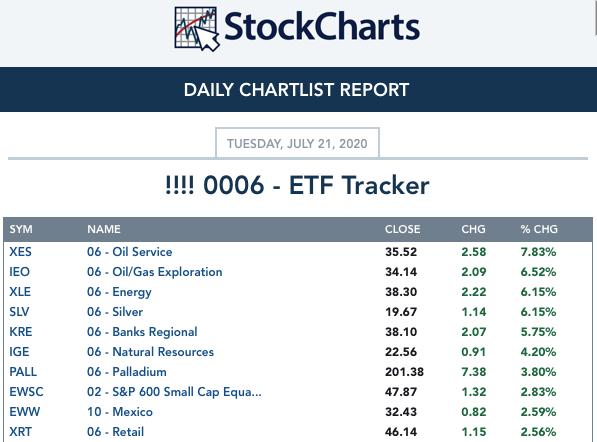
Top 10 from ETF Tracker:
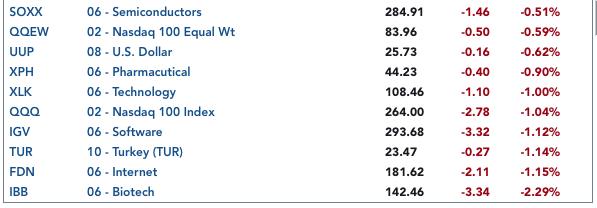
Bottom 10 from ETF Tracker:
On Friday, the DecisionPoint Alert Weekly Wrap presents an assessment of the trend and condition of the stock market (S&P 500), the U.S. Dollar, Gold, Crude Oil, and Bonds. Monday through Thursday the DecisionPoint Alert daily report is abbreviated and covers changes for the day.
Watch the latest episode of DecisionPoint on StockCharts TV's YouTube channel here!
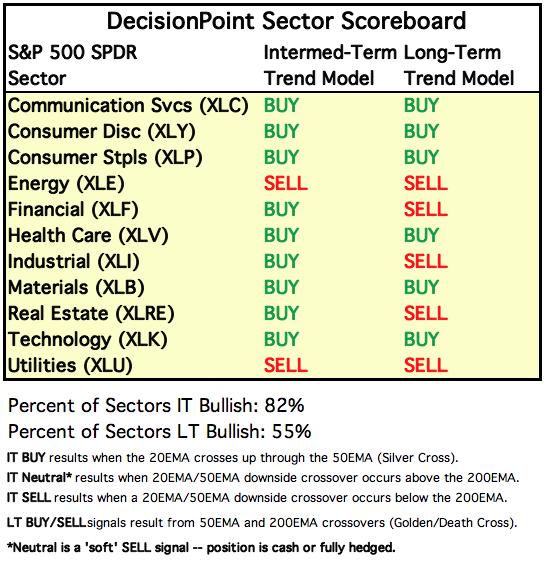
SECTORS
SIGNALS:
Each S&P 500 Index component stock is assigned to one, and only one, of 11 major sectors. This is a snapshot of the Intermediate-Term (Silver Cross) and Long-Term (Golden Cross) Trend Model signal status for those sectors.
TODAY'S RESULTS:
One WEEK Results: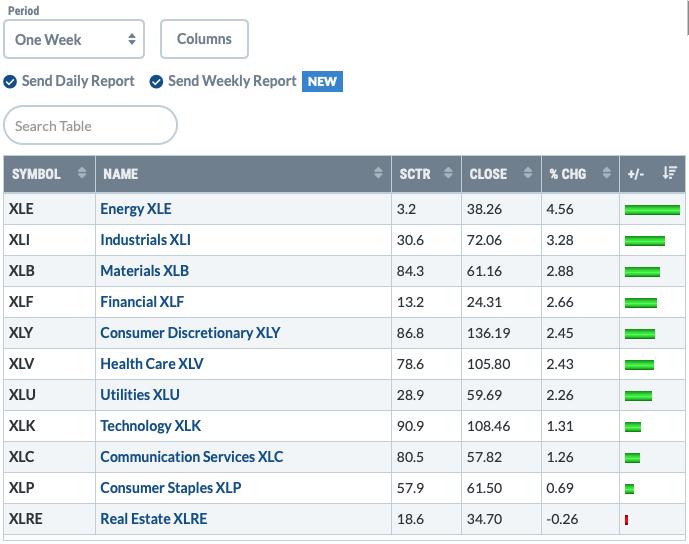
STOCKS
IT Trend Model: BUY as of 5/8/2020
LT Trend Model: BUY as of 6/8/2020
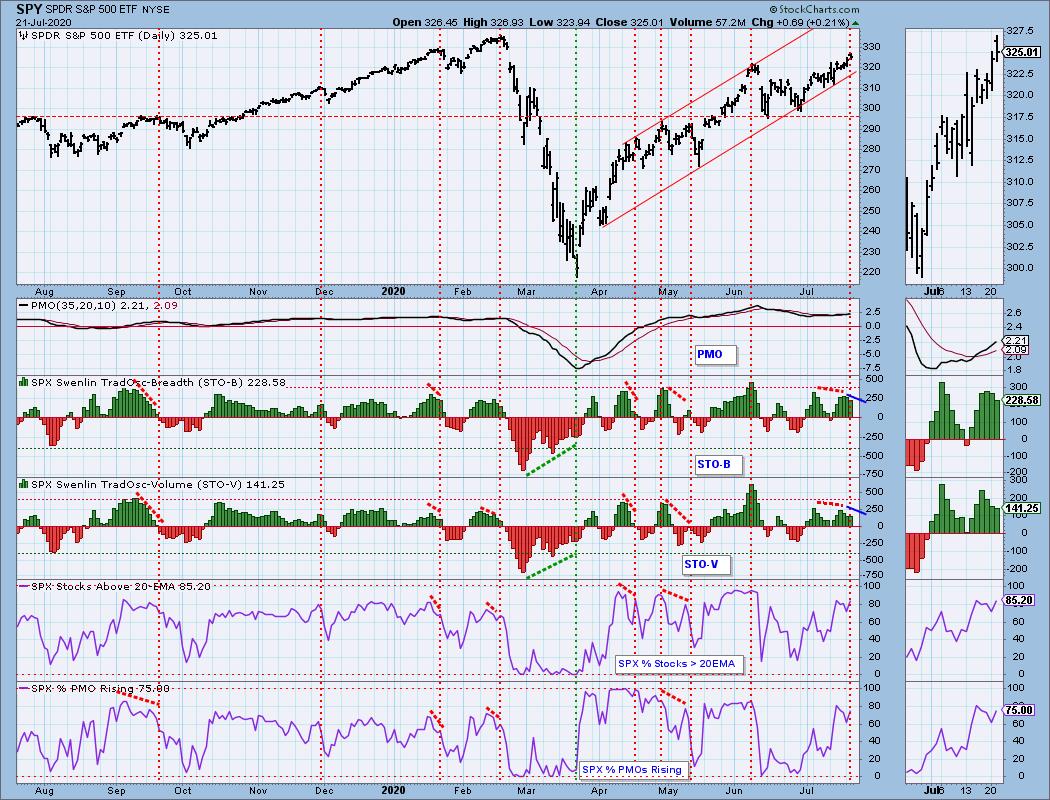
SPY Daily Chart: Price is now fully in the gap. I tweeted a picture of the British sign "Mind the Gap" as the market now must watch its step as it prepares to breakout above gap resistance. The PMO is rising nicely and we did see a pick up in total volume.
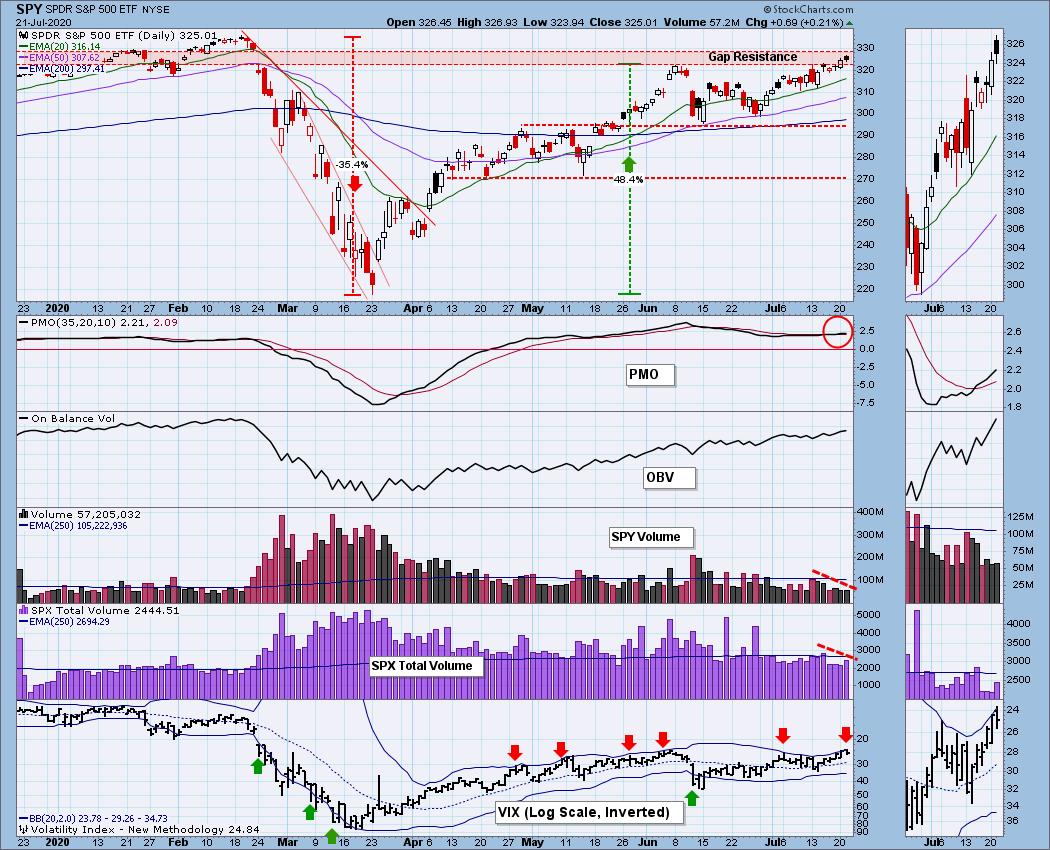
Climactic Market Indicators: Readings were somewhat climactic to the upside and I note that the VIX Bollinger Bands are expanding again with the VIX still bumping against the top band on the inverted scale. I don't think readings are climactic enough to consider a buying exhaustion just yet, but we're close.
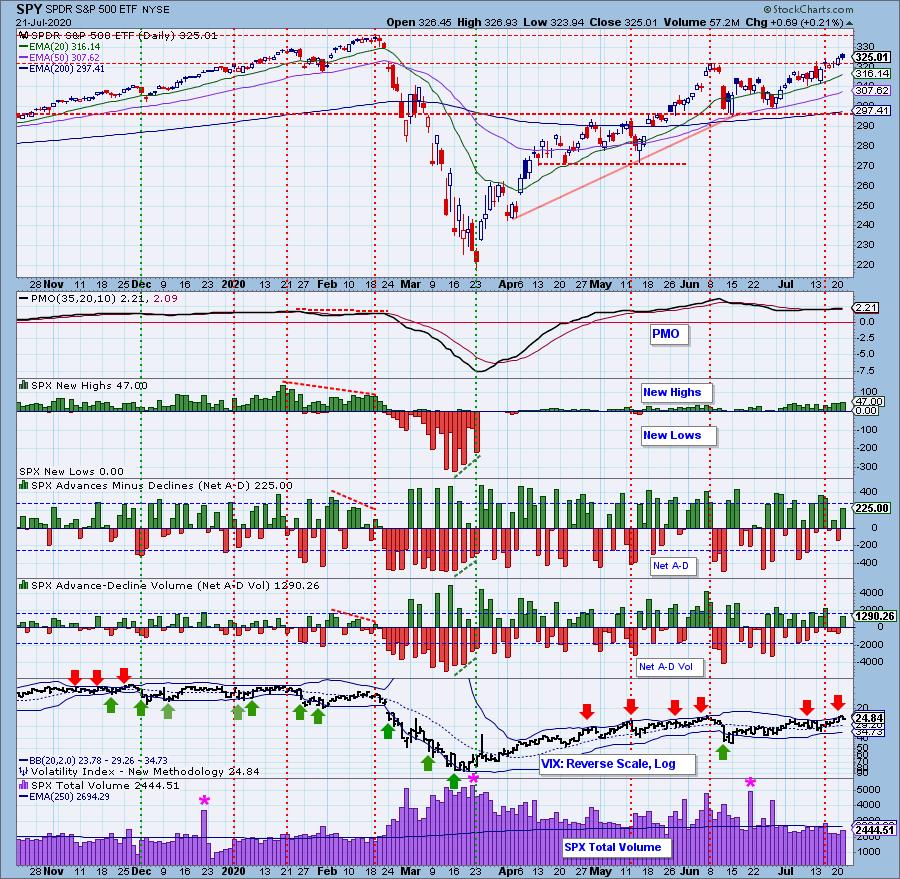
Short-Term Market Indicators: The short-term market trend is UP and the condition is OVERBOUGHT. Based upon the STO ranges, market bias is BULLISH. STOs are again lower on the day which is bearish in the short-term, especially when readings are overbought.
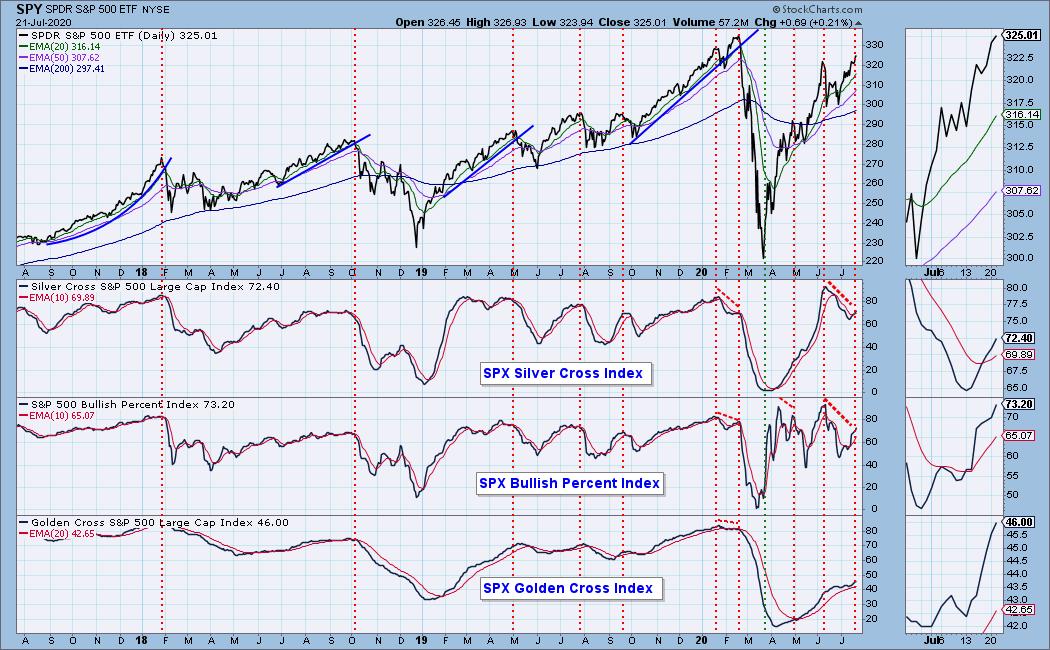
Intermediate-Term Market Indicators: The Silver Cross Index (% of SPX stocks 20EMA > 50EMA) and Golden Cross Index (% of SPX stocks 50EMA > 200EMA) continue higher which is bullish. No complaints on these indicators.
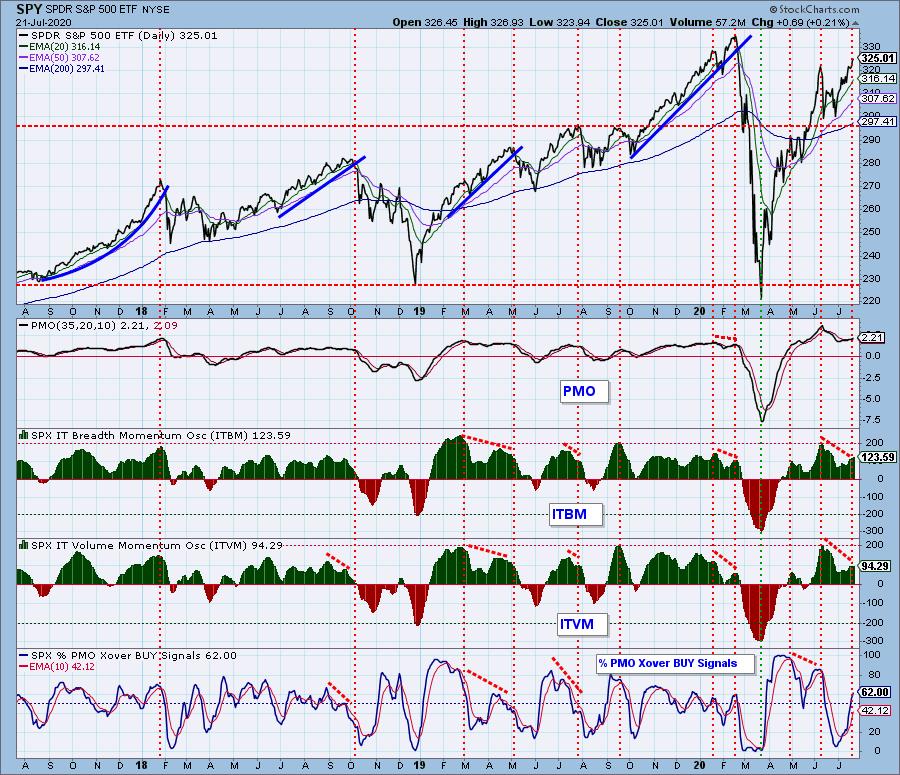
The intermediate-term market trend is UP and the condition is SOMEWHAT OVERBOUGHT. With most of the ITBM/ITVM readings since the end of April being above the zero lines, the market bias is BULLISH. Still seeing rising numbers on the ITBM/ITVM, but they are getting overbought.
CONCLUSION: Honestly, my conclusion for yesterday still stands; we're just another day closer to the pullback that I'm looking for when price starts to reach past the gap resistance area.
"Our indicators have told us for some time that we have a "bullish bias". Last week's price action off negative divergences proves it. Negative divergences generally lead to breakdowns. Instead of breaking down, price moved sideways. I am expecting an upside breakout, but with short-term indicators looking less bullish, I expect we could see a pullback before gap resistance is finally overcome."
DOLLAR (UUP)
IT Trend Model: NEUTRAL as of 5/28/2020
LT Trend Model: SELL as of 7/10/2020
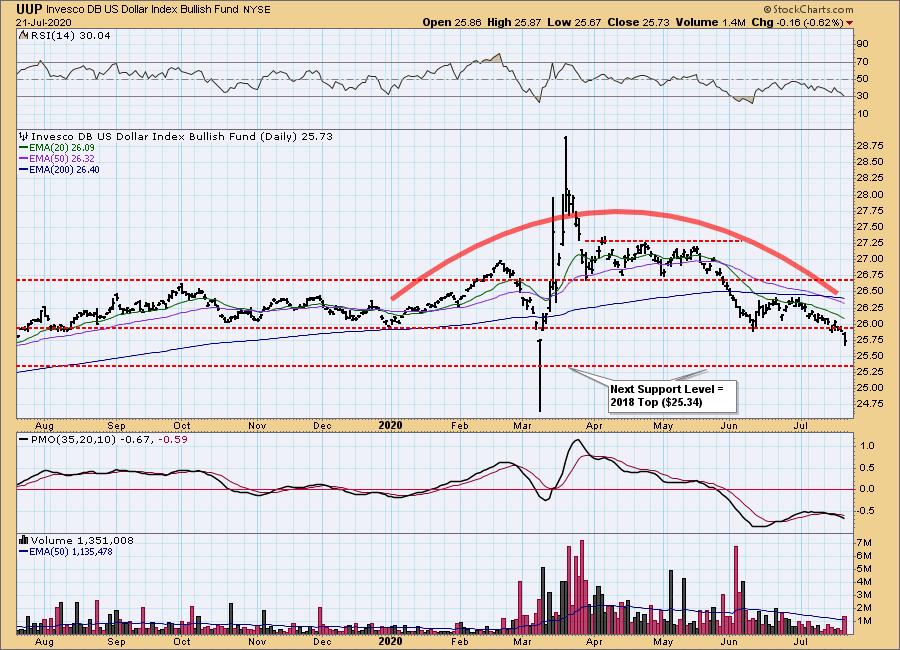
UUP Daily Chart: Finally, the Dollar broke down! The PMO and RSI have already been telling us to look for a breakdown since early July. After failing to hold above the 20-EMA, price began a slow slide lower. I went back to find the next area of support, and that would be at the 2018 price top which was $25.34. I'll be looking for a challenge of that support level very soon.
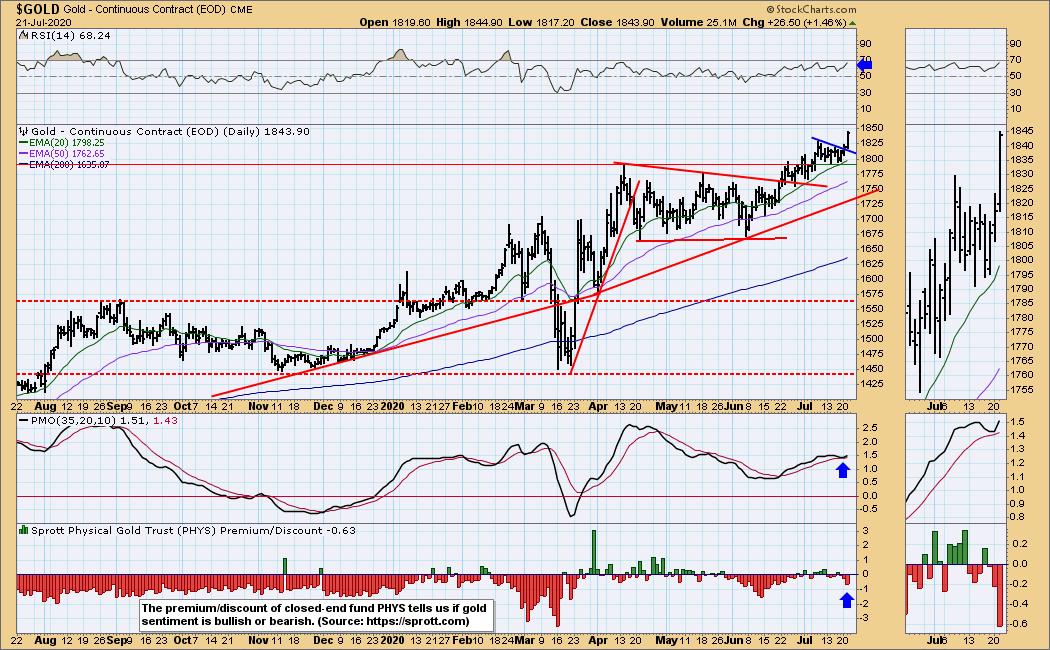
GOLD
IT Trend Model: BUY as of 3/24/2020
LT Trend Model: BUY as of 1/8/2019
GOLD Daily Chart: The Dollar's demise became Gold's resurgence. Gold continues to look strong and not particularly overbought. The PMO just gave us a bottom above the signal line which I find especially bullish. The RSI is not overbought and we still are seeing discounts on PHYS which tells us sentiment is still somewhat bearish and that is good for Gold since sentiment is contrarian--very bearish leads to higher prices, very bullish leads to lower prices.
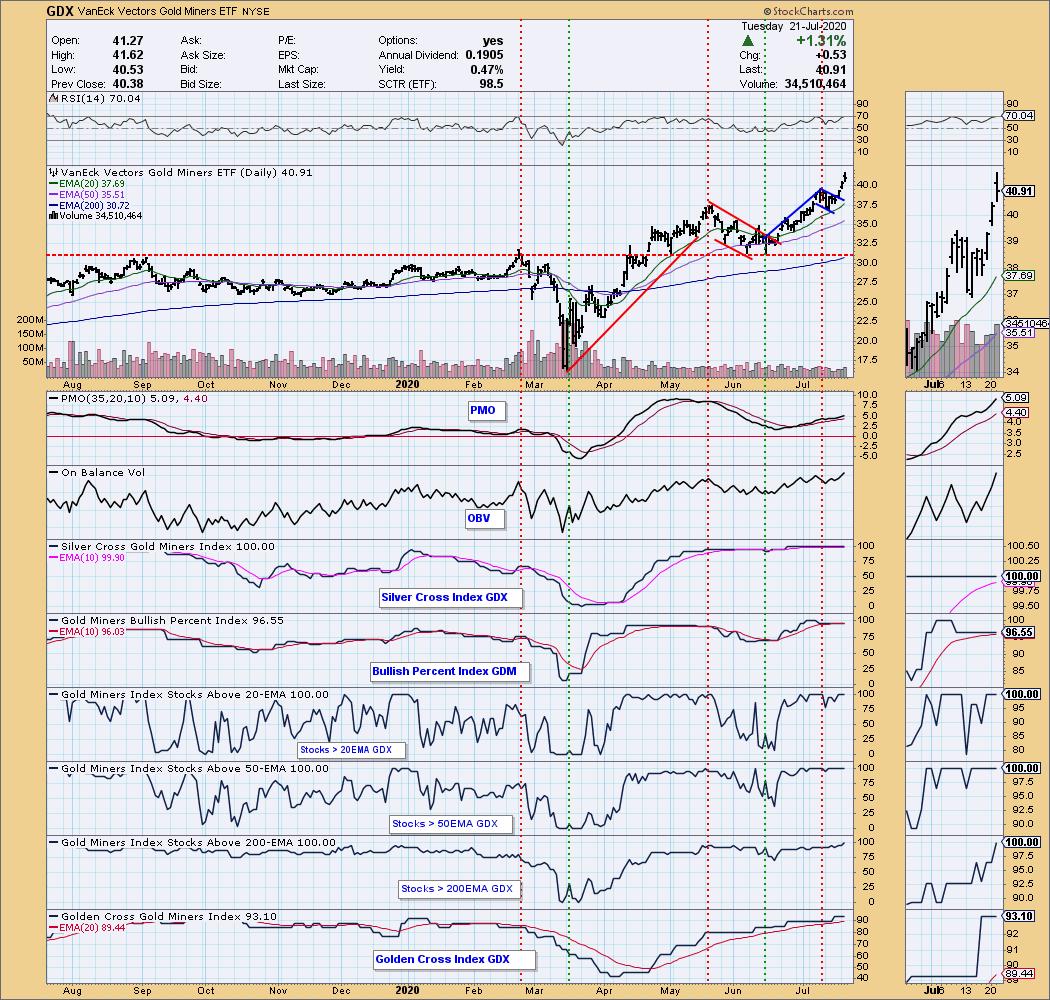
GOLD MINERS Golden and Silver Cross Indexes:
Yesterday's comments still apply with the addition that 100% of members now have price above their 200-EMAs too!
"Loving Gold Miners still. On "Your Daily Five" this morning I talked about this chart and how bullish it is. Friday we had a breakout from a possible short-term bullish flag formation. Today it continued with a big gap up. The PMO is not overbought and while the RSI is somewhat overbought, it is clear that the members of GDX are very healthy and could certainly support more upside. 100% of members have 20-EMAs > 50-EMAs and have price above both the 20/50-EMAs. Strength begets strength."
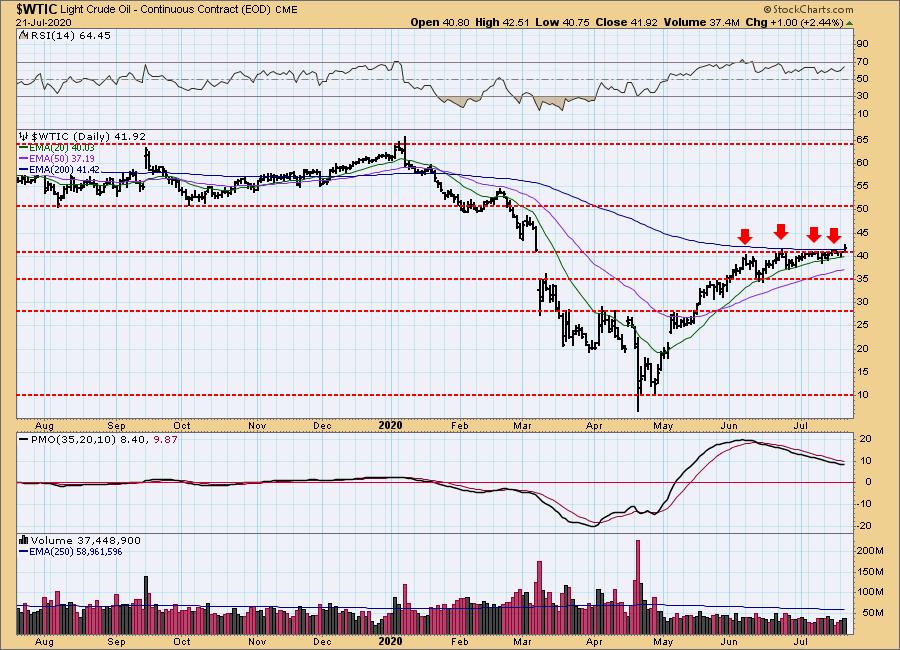
CRUDE OIL ($WTIC)
The oil market is under severe pressure due to a lack of demand, and we do not believe that USO is an appropriate investment vehicle at this time. Until further notice we will use $WTIC to track the oil market. Since this is a continuous contract dataset, it doesn't "play well" with our Trend Models, and we will not report Trend Model signals for oil.
$WTIC Daily Chart: Finally saw a breakout on WTIC! Energy is currently leading all Sectors for the past week so I'm not surprised to see Oil finally breakout. Not only did it finally close the March gap, it closed above its 200-EMA for the first time since January. The market seems to be anticipating more demand.
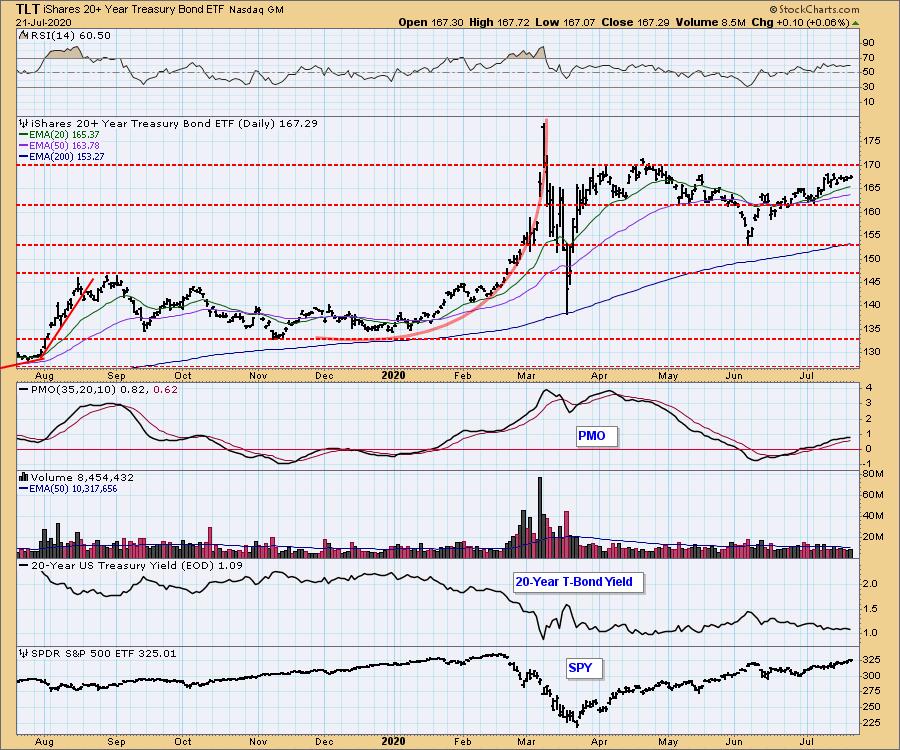
BONDS (TLT)
IT Trend Model: BUY as of 6/26/2020
LT Trend Model: BUY as of 1/2/2019
TLT Daily Chart: Yesterday's comments still apply:
"Bonds have mostly been consolidating sideways and have formed a tiny symmetrical triangle. I'm expecting an upside breakout given the positive RSI and PMO BUY signal. Full disclosure: I own TLT."
Have you subscribed the DecisionPoint Diamonds yet? DP does the work for you by providing handpicked stocks/ETFs from exclusive DP scans! Add it with a discount AND get the LIVE Trading Room for free! Contact support@decisionpoint.com for more information!
Technical Analysis is a windsock, not a crystal ball.
Happy Charting! - Erin
Email: erin@decisionpoint.com
ANNOUNCEMENT:
The MoneyShow Las Vegas has been canceled "in person", but I will still be presenting during their video production. As soon as I have information, I will forward it! In the meantime, if you haven't already, click to get your free access pass!

NOTE: The signal status reported herein is based upon mechanical trading model signals, specifically, the DecisionPoint Trend Model. They define the implied bias of the price index based upon moving average relationships, but they do not necessarily call for a specific action. They are information flags that should prompt chart review. Further, they do not call for continuous buying or selling during the life of the signal. For example, a BUY signal will probably (but not necessarily) return the best results if action is taken soon after the signal is generated. Additional opportunities for buying may be found as price zigzags higher, but the trader must look for optimum entry points. Conversely, exit points to preserve gains (or minimize losses) may be evident before the model mechanically closes the signal.
Helpful DecisionPoint Links (Can Be Found on DecisionPoint.com Links Page):
DecisionPoint Shared ChartList and DecisionPoint Chart Gallery
Price Momentum Oscillator (PMO)
Swenlin Trading Oscillators (STO-B and STO-V)
.