
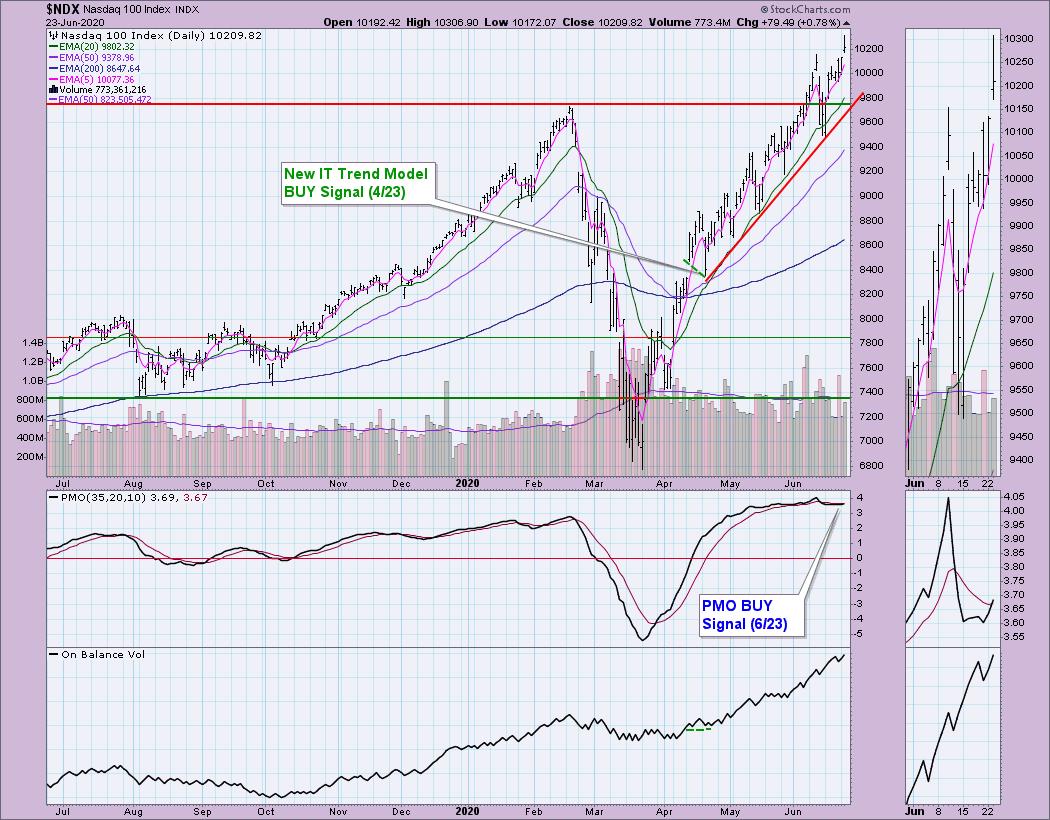
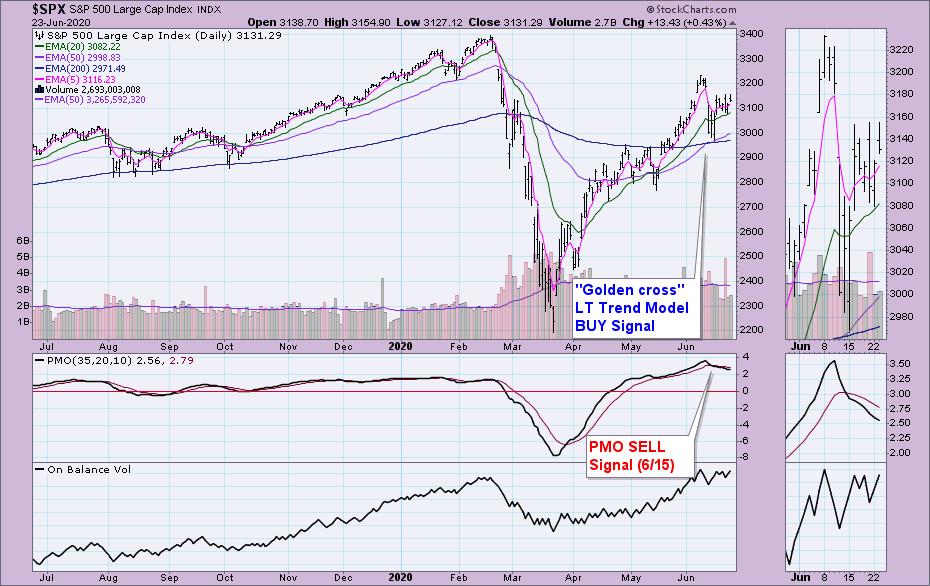
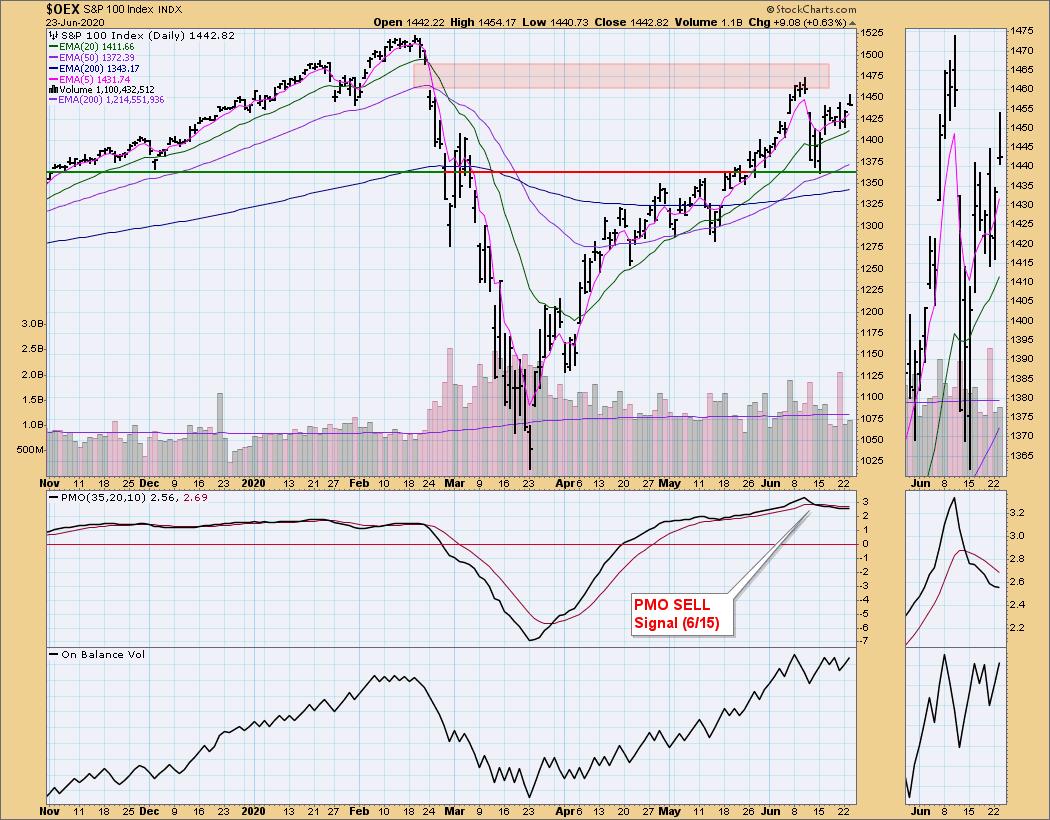
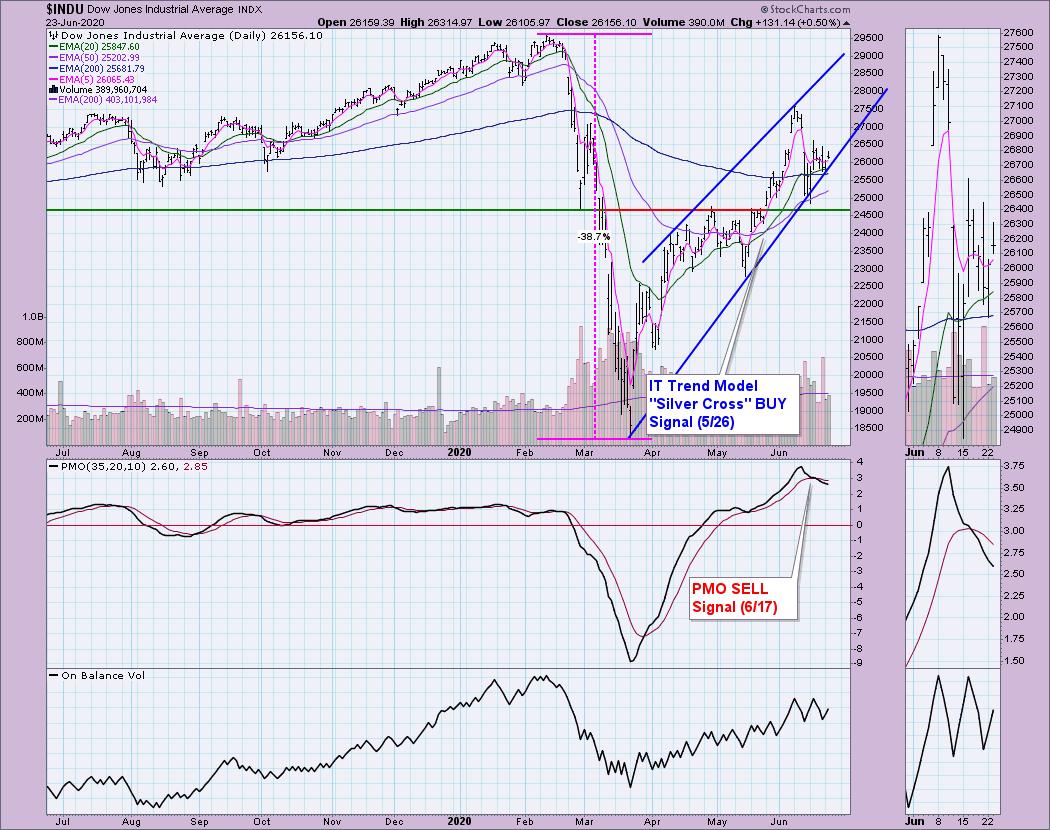
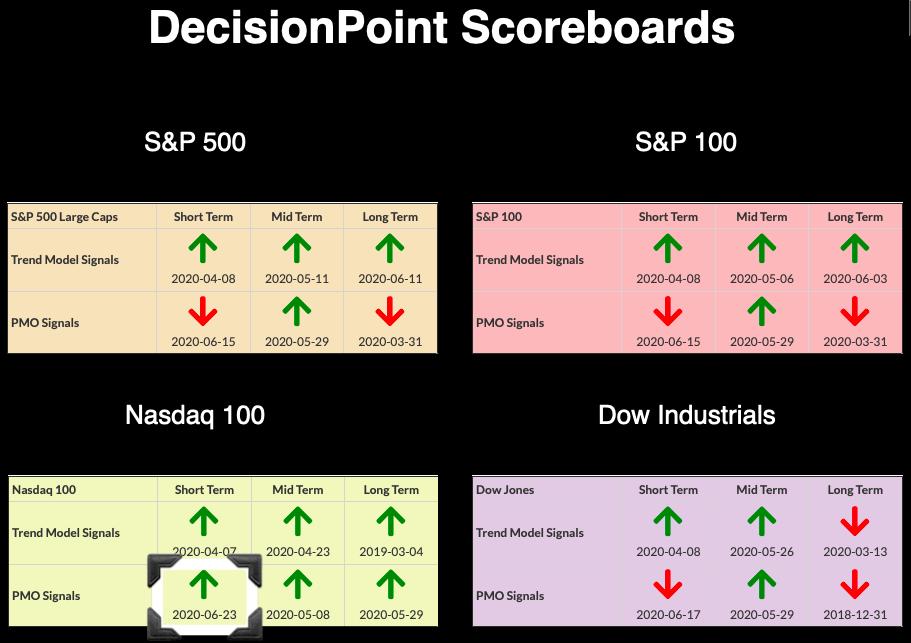
The tech heavy Nasdaq 100 saw a new Price Momentum Oscillator (PMO) BUY signal today as prices gapped up and closed up +0.78%. Meanwhile if you look at the other three DP Scoreboard indexes below the NDX chart, you'll see that all of their PMOs are falling. The NDX chart below is very bullish as the NDX has been able to maintain a consistent and sharp rising trendline. At this point the market is clearly bifurcated between Technology/Biotechs and the broad markets. The question now is whether the NDX can bring up the rest of the indexes to new all-time highs or will the broad markets take the NDX down? At this point they are totally decoupled from each other; the 'safer' market plays seem to be in Technology and Healthcare now so I suspect this dichotomy will continue a bit longer.
** Announcement **
I will be traveling July 1 - July 15. I will be writing on the road, but broadcasting will likely be suspended during that time. It's going to be an adventurous road trip for me and my husband. We will be taking a train from Los Angeles to New Orleans, visiting family, checking out retirement areas and then renting a car to make our way back to California with various sightseeing stops along the way. I'll be sure to post a picture or two and I'm sure I'll have funny stories to share along the way. It'll be interesting to see the various stages of the reopening of America. A heads up to Bundle subscribers, the LIVE Trading Room is on hiatus as Mary Ellen will also be out of pocket in the upcoming month. We hope to reopen in late-July. Please direct questions to erin@decisionpoint.com.
DP INDEX SCOREBOARDS:
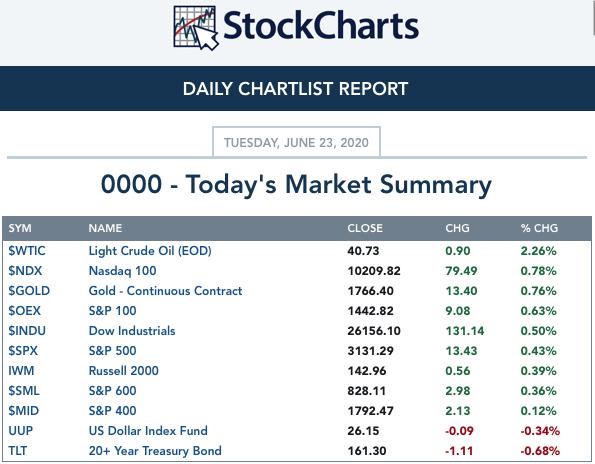
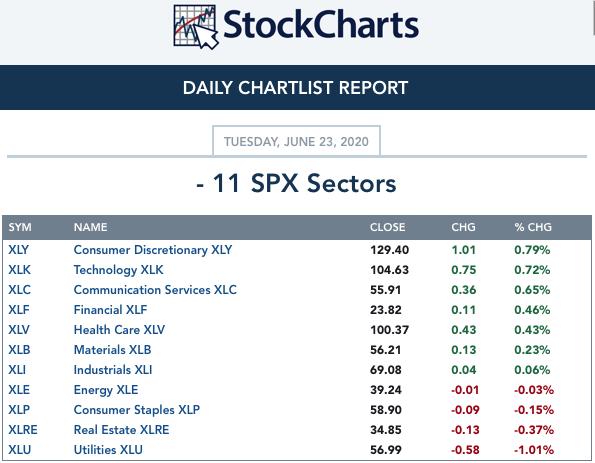
TODAY'S Broad Market Action:
Past WEEK Results: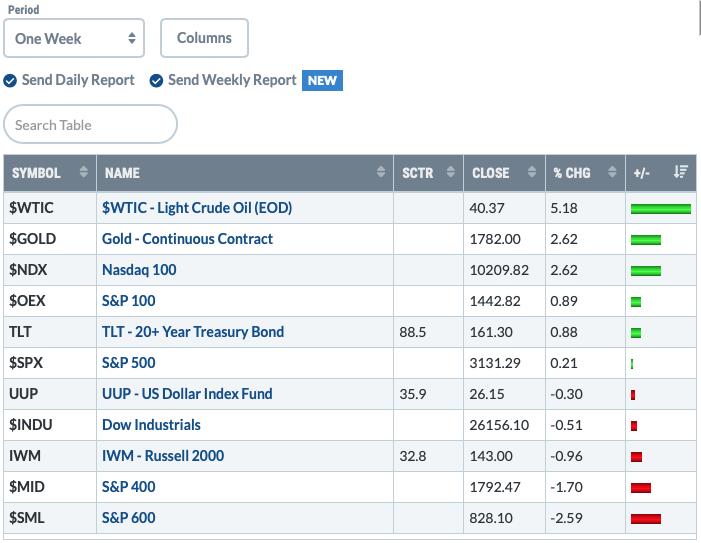
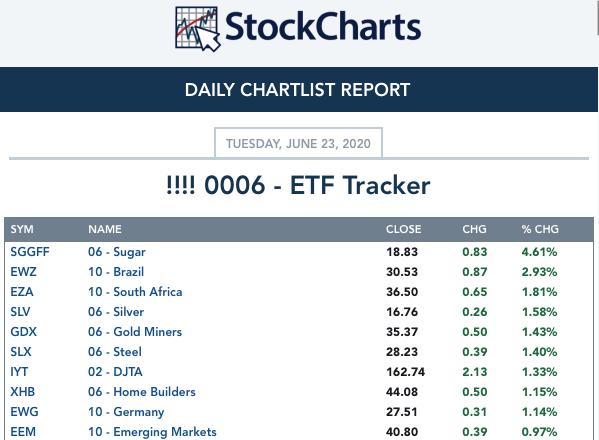
Top 10 from ETF Tracker:
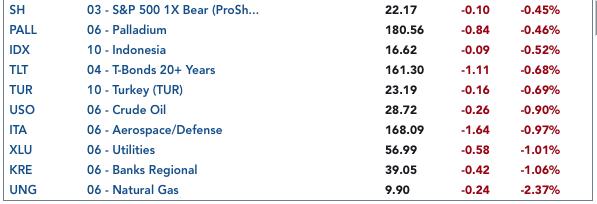
Bottom 10 from ETF Tracker:
On Friday, the DecisionPoint Alert Weekly Wrap presents an assessment of the trend and condition of the stock market (S&P 500), the U.S. Dollar, Gold, Crude Oil, and Bonds. Monday through Thursday the DecisionPoint Alert daily report is abbreviated and covers changes for the day.
Watch the latest episode of DecisionPoint on StockCharts TV's YouTube channel here!
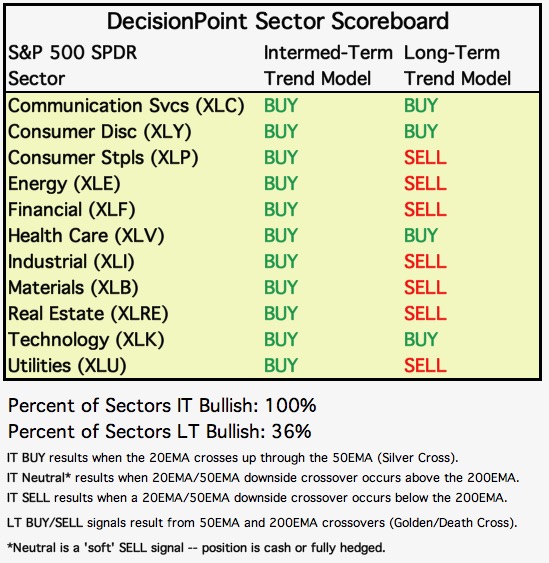
SECTORS
SIGNALS:
Each S&P 500 Index component stock is assigned to one, and only one, of 11 major sectors. This is a snapshot of the Intermediate-Term (Silver Cross) and Long-Term (Golden Cross) Trend Model signal status for those sectors.
TODAY'S RESULTS:
One WEEK Results: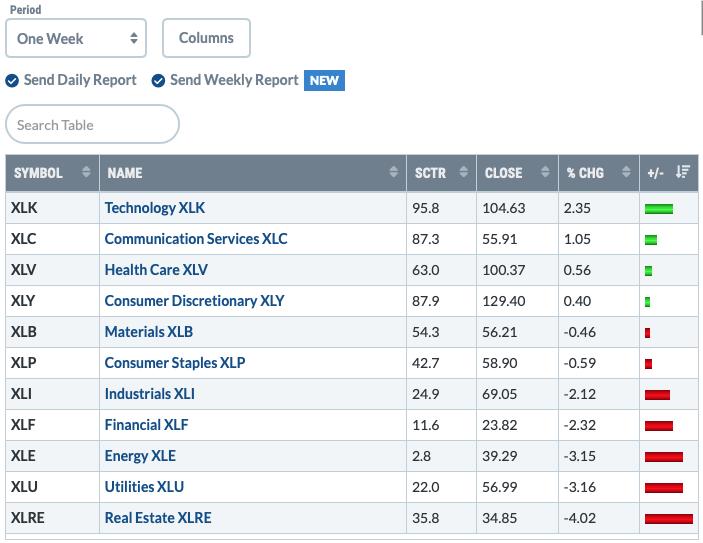
STOCKS
IT Trend Model: BUY as of 5/8/2020
LT Trend Model: BUY as of 6/8/2020
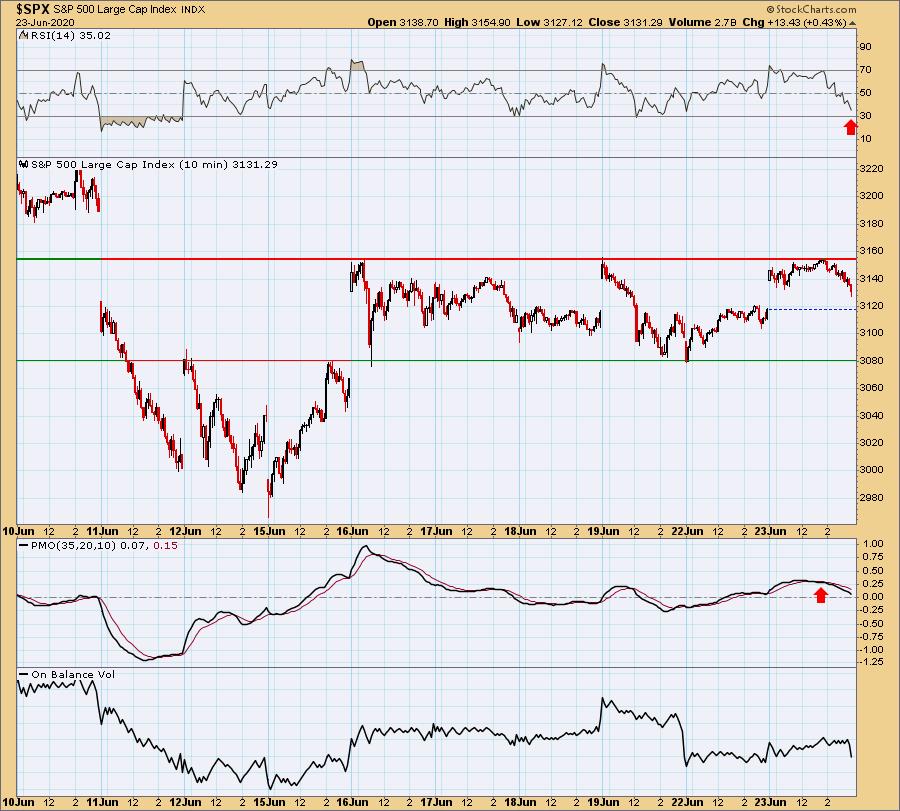
SPY Daily Chart: I want to start with the 10-min bar chart of the SPX to show you how the neutral bias of the market is playing out. We are now six days into a consolidation trading range. The drop off at the end of today has the RSI in negative territory below net neutral (50) and has the PMO declining. I would avoid entering very short-term positions until those indicators turn back up.
The one-year daily chart shows us that the gap from the initial drop from the island (red box) is holding as overhead resistance in the very short term. The reverse divergence is still in place as price tops decline while OBV tops rise. This is bearish as we want high volume accumulation (rising OBV tops) to push price to a breakout from its previous top.
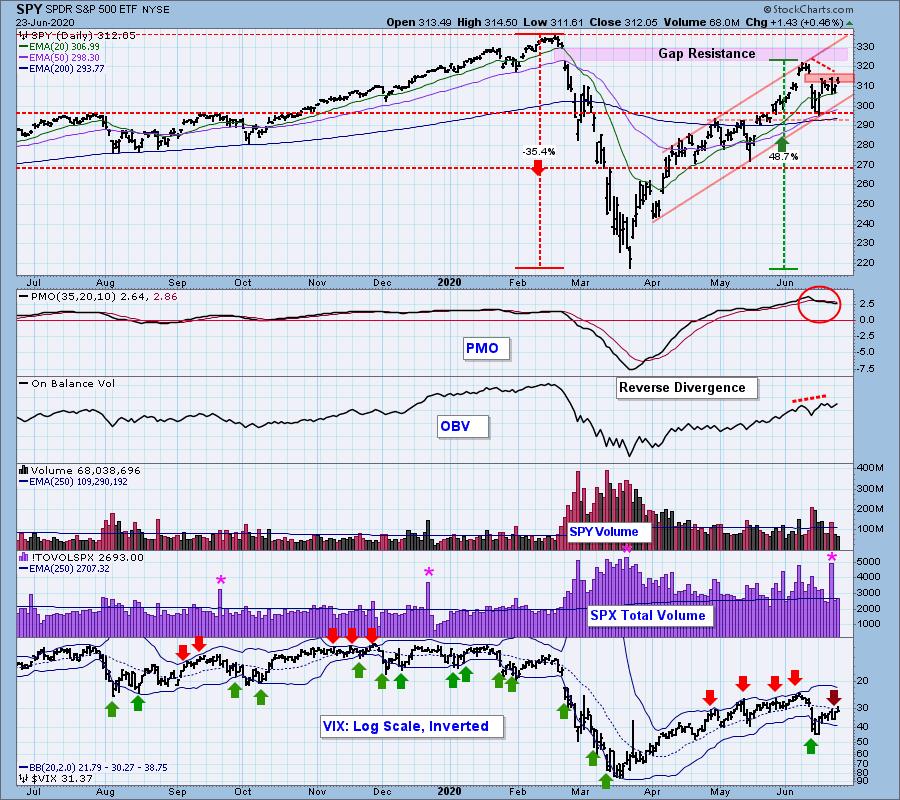
Climactic Market Indicators: No climactic readings at all today. However we are seeing the VIX continuing to close below its average on the inverted scale. This suggests market weakness.
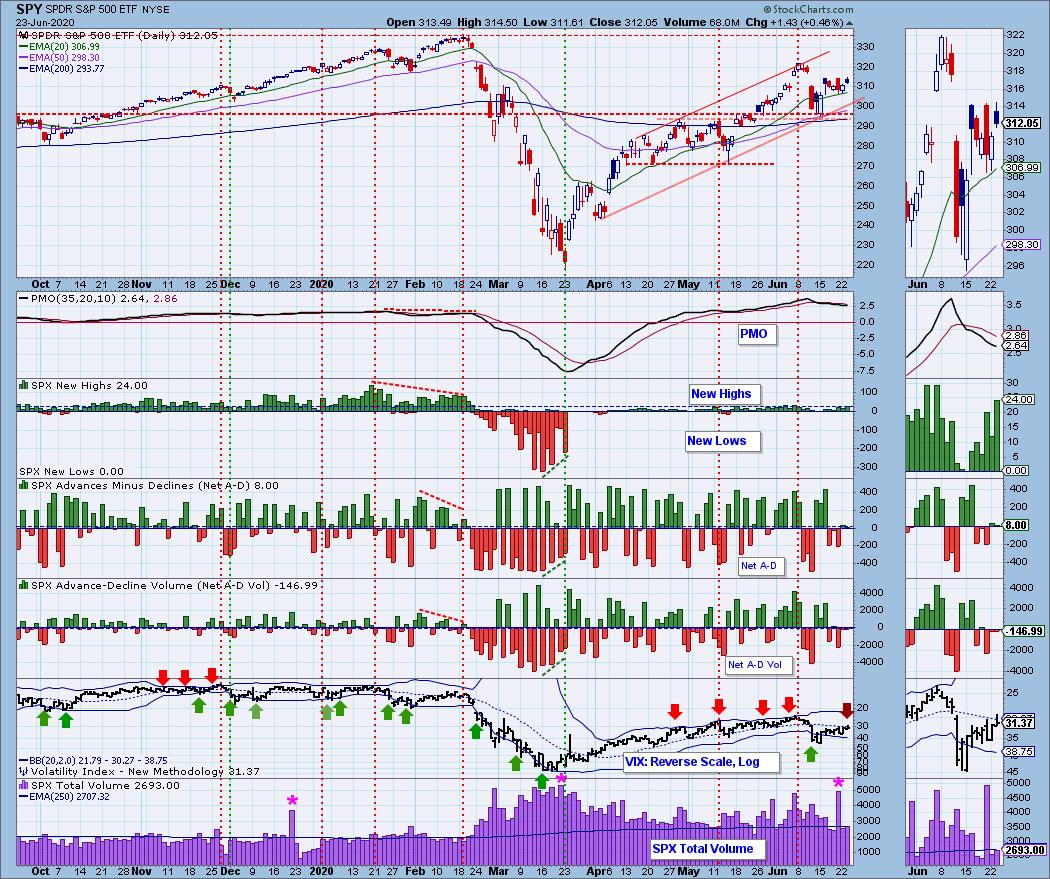
Short-Term Market Indicators: The short-term market trend is NEUTRAL and the condition is NEUTRAL. Based upon the STO ranges since the March price low, market bias is BULLISH, though not as bullish as between mid-October through mid-February. The declining tops on the STOs are in somewhat of a negative divergence with price tops which have been straight across. The %Stocks above 20-EMA is flat but we are still seeing %Stocks with PMOs rising is pointed downward which isn't the best scenario for a breakout rally.
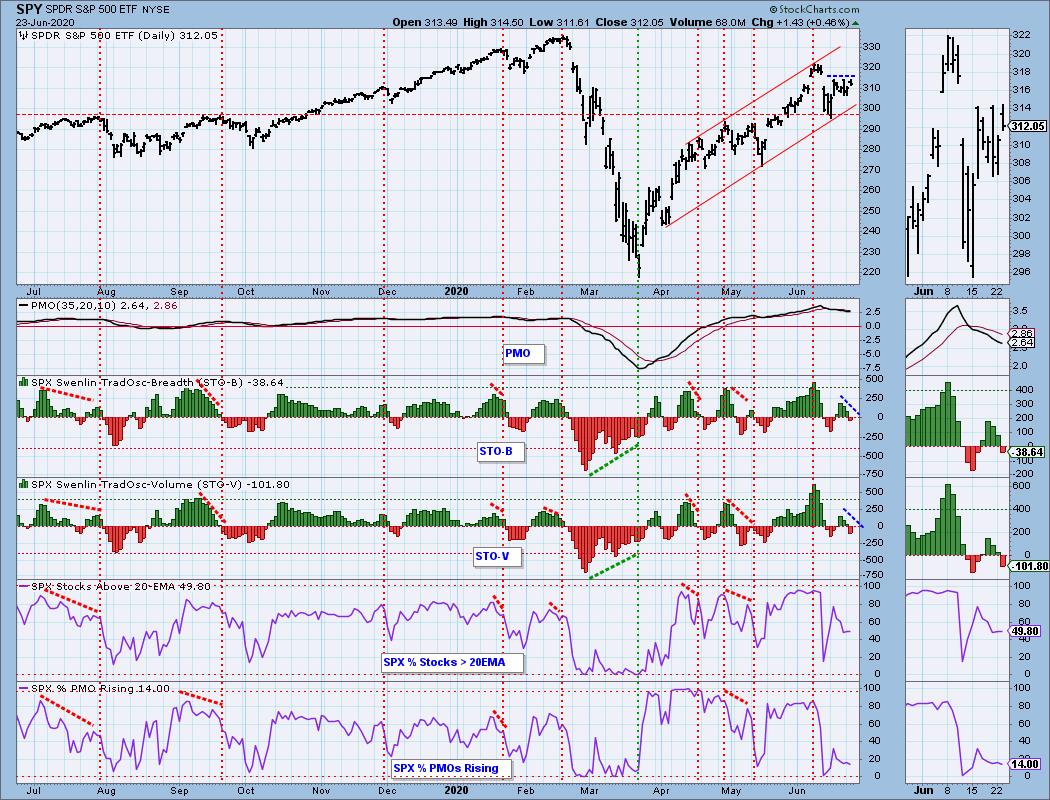
Intermediate-Term Market Indicators: The Silver Cross Index (% of SPX stocks 20EMA > 50EMA) is falling and the Golden Cross Index (% of SPX stocks 50EMA > 200EMA) is rising. The SCI has now had a negative crossover. Historically, with only a few exceptions, this isn't good for the market.
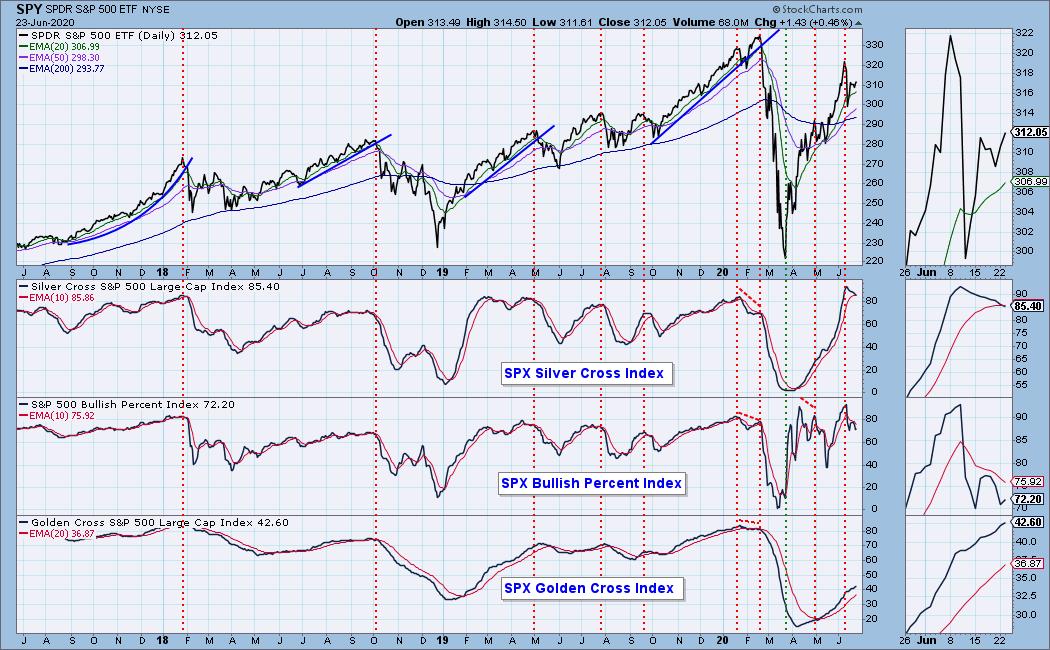
The intermediate-term market trend is UP and the condition is OVERBOUGHT. With most of the ITBM/ITVM readings since the end of April being above the zero lines, the market bias is BULLISH. The ITBM/ITVM are in declining trends and remain above zero. %PMO Xver BUY Signals continues to decline as more PMOs within the SPX cross back below their signal lines. Despite a bullish bias on these indicators, they aren't showing any improvement that would indicate a breakout rally.
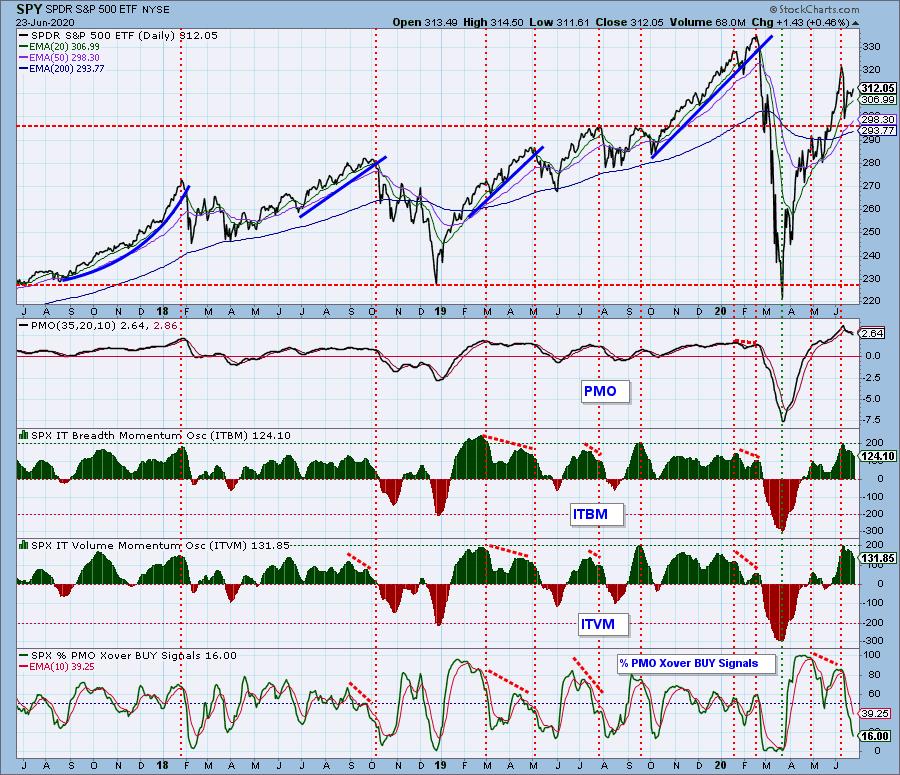
CONCLUSION: Not much change from yesterday. I hate sitting in "neutral" as a position, but none of the indicator charts show the internal strength needed for a breakout rally. Although they aren't quite negative enough to incite a correction. More sideways movement ahead for now in my estimation.
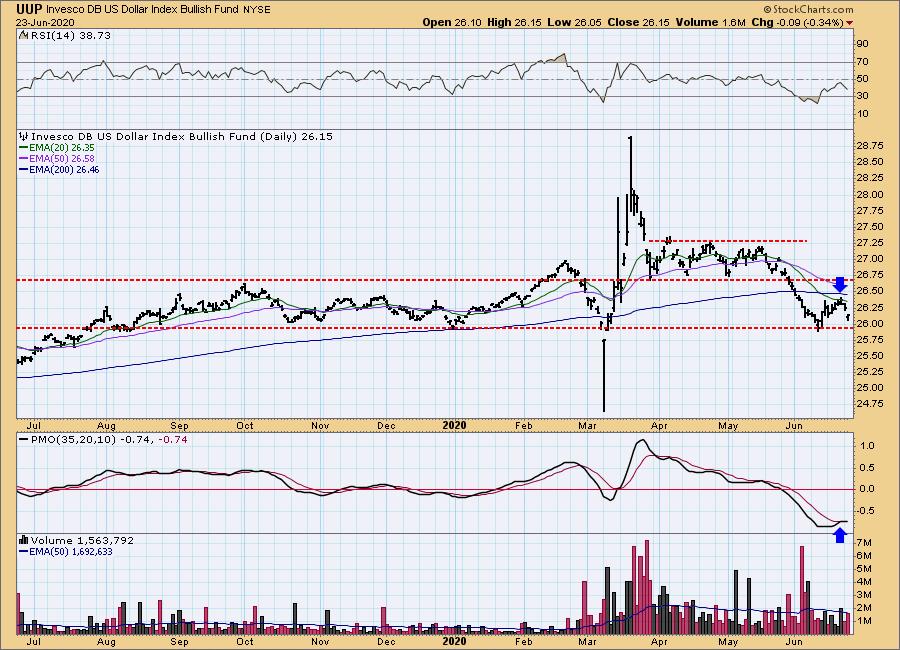
DOLLAR (UUP)
IT Trend Model: NEUTRAL as of 5/28/2020
LT Trend Model: BUY as of 5/25/2018
UUP Daily Chart: I was feeling somewhat bullish about the Dollar until the last two days of price action. The RSI is negative and the PMO actually triggered a whipsaw SELL signal. If it loses the $26 support line, it'll be time to worry.
GOLD
IT Trend Model: BUY as of 3/24/2020
LT Trend Model: BUY as of 1/8/2019
GOLD Daily Chart: The declining trend line was broken yesterday and Gold proceeded to continue the rally. The chart looks very bullish with a new PMO BUY signal and continued discounts on PHYS. Next on the agenda will be a breakout above the April top.
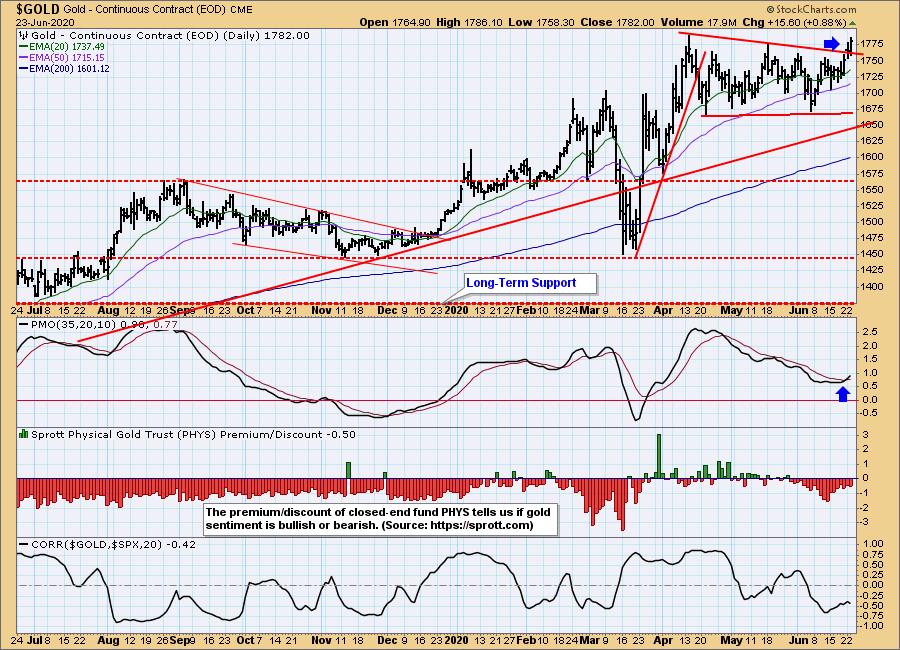
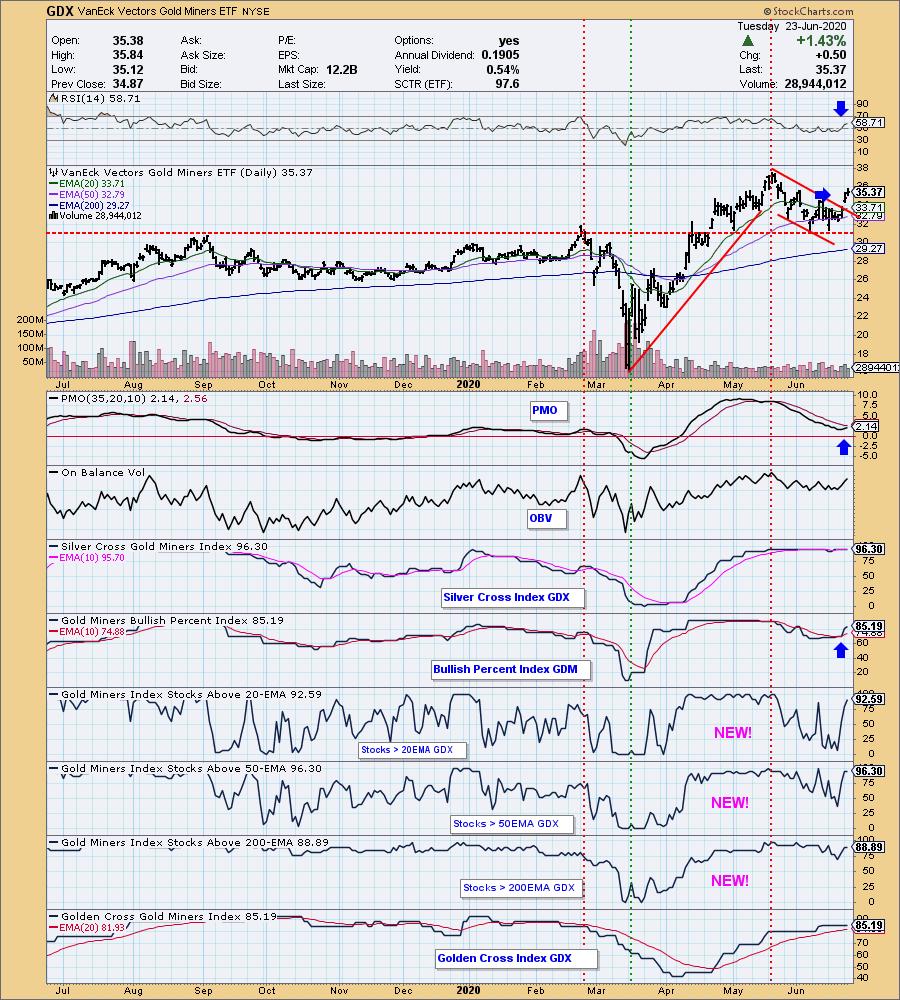
GOLD MINERS Golden and Silver Cross Indexes: I still like the Gold Miners as the breakout rally from the "flag" continues. The RSI is positive and the other indicators are improving or are already strong. I'm looking for more positive results out of this industry group.
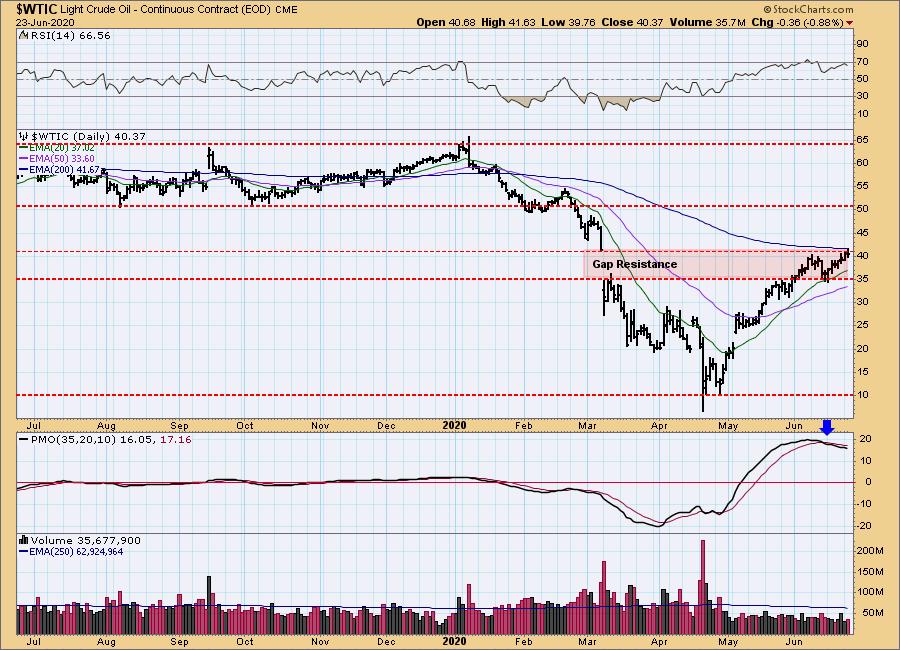
CRUDE OIL ($WTIC)
The oil market is under severe pressure due to a lack of demand, and we do not believe that USO is an appropriate investment vehicle at this time. Until further notice we will use $WTIC to track the oil market. Since this is a continuous contract dataset, it doesn't "play well" with our Trend Models, and we will not report Trend Model signals for oil.
$WTIC Daily Chart: After triggering a PMO SELL signal, price hasn't really broken down. I find that quite bullish. The RSI is positive and not overbought currently. If the PMO weren't descending, I'd be more bullish on Oil, but with that negative PMO, I can't be confident that this gap resistance area will be broken.
BONDS (TLT)
IT Trend Model: Neutral as of 6/5/2020
LT Trend Model: BUY as of 1/2/2019
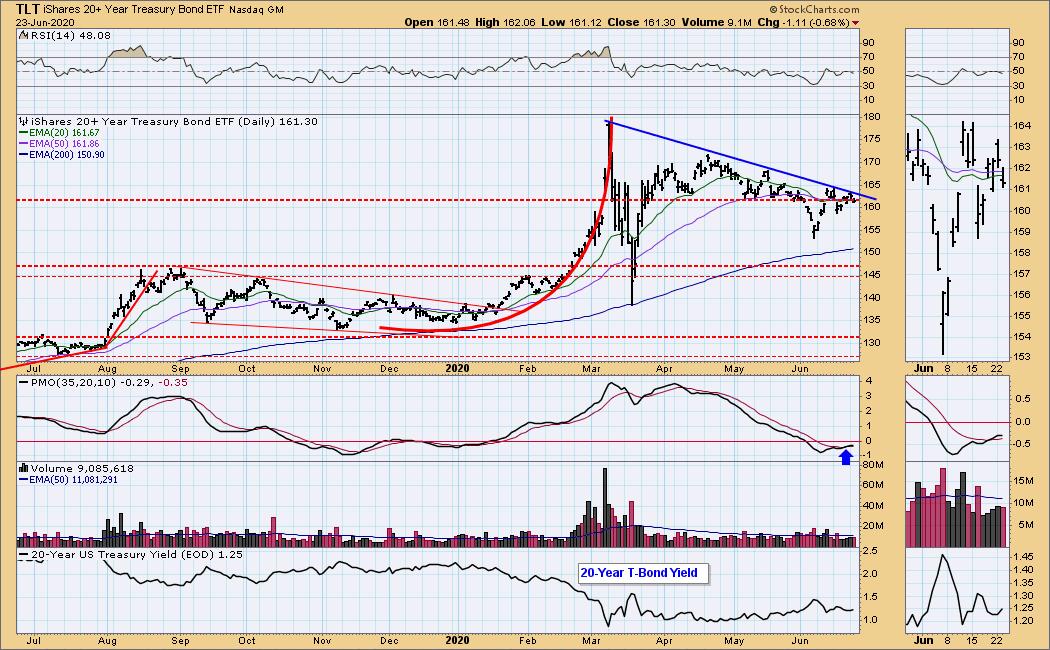
TLT Daily Chart: Given the positive PMO and the break back above resistance above $161, I was fairly bullish on Bonds. However, now the PMO is trying to turn over and the declining tops trendline continues to hold firmly. The RSI is negative. Bonds should be breaking out based on the PMO BUY signal, but we're not seeing it yet. I'll stay bullish on Bonds for now.
Have you subscribed the DecisionPoint Diamonds yet? DP does the work for you by providing handpicked stocks/ETFs from exclusive DP scans! Add it with a discount AND get the LIVE Trading Room for free! Contact support@decisionpoint.com for more information!
Technical Analysis is a windsock, not a crystal ball.
Happy Charting! - Erin
Email: erin@decisionpoint.com

Erin Swenlin will be presenting at the The MoneyShow Las Vegas August 16 - 20 at Bally's/Paris Resort! You'll have an opportunity to meet Erin and discuss the latest DecisionPoint news and Diamond Scans. Claim your FREE pass here! You can watch online with this pass too!! There will be online events held in May and when I have more information I'll let you know.
NOTE: The signal status reported herein is based upon mechanical trading model signals, specifically, the DecisionPoint Trend Model. They define the implied bias of the price index based upon moving average relationships, but they do not necessarily call for a specific action. They are information flags that should prompt chart review. Further, they do not call for continuous buying or selling during the life of the signal. For example, a BUY signal will probably (but not necessarily) return the best results if action is taken soon after the signal is generated. Additional opportunities for buying may be found as price zigzags higher, but the trader must look for optimum entry points. Conversely, exit points to preserve gains (or minimize losses) may be evident before the model mechanically closes the signal.
Helpful DecisionPoint Links (Can Be Found on DecisionPoint.com Links Page):
DecisionPoint Shared ChartList and DecisionPoint Chart Gallery
Price Momentum Oscillator (PMO)
Swenlin Trading Oscillators (STO-B and STO-V)