
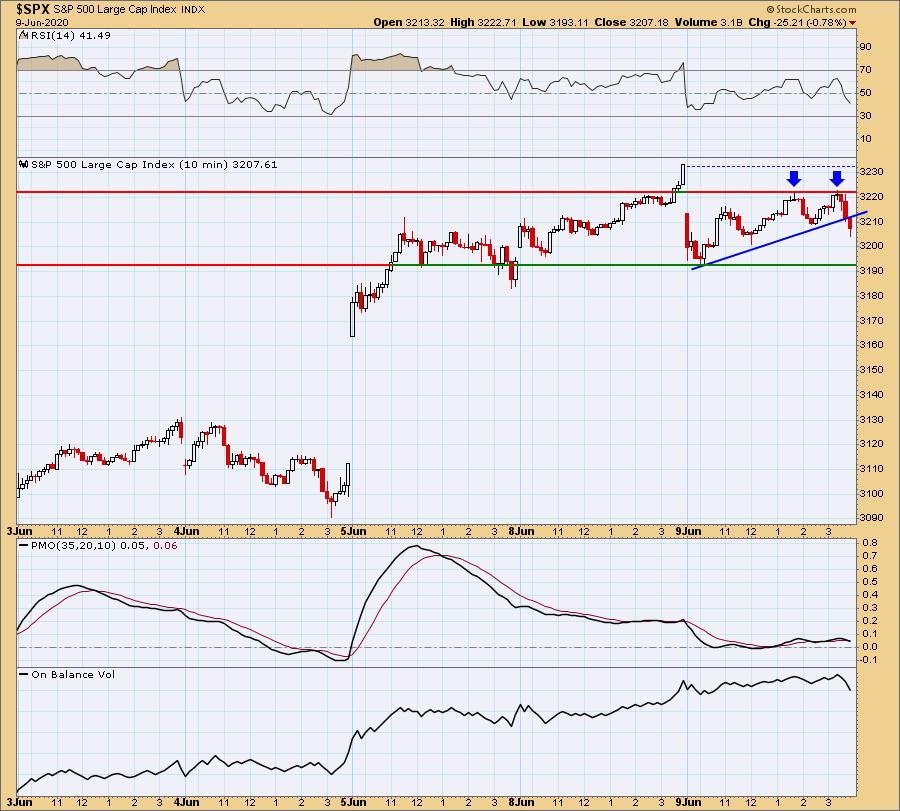
TLT has been in free fall for some time so it was about time that it bottomed and began to rally yesterday. Yet, there are already problems ahead. I'll look at TLT more closely in the section on Bonds. As far as market action today, I found it very interesting to look at on the 10-minute bar chart. First I note that price has really been confined to a trading range over the past three days after it gapped up on the 6/5 open. All indicators point to more decline tomorrow. The RSI is falling, the PMO is falling after SELL signal and we saw a rush of volume coming in on the end of day decline. Not only was today's rising trend broken, there was a bearish double-top that executed with the last 10 minutes of trading.
** Announcement **
I will be traveling July 1 - July 15. I will be writing on the road, but broadcasting will likely be suspended during that time. It's going to be an adventurous road trip for me and my husband. We will be taking a train from Los Angeles to New Orleans, visiting family, checking out retirement areas and then renting a car to make our way back to California with various sightseeing stops along the way. I'll be sure to post a picture or two and I'm sure I'll have funny stories to share along the way. It'll be interesting to see the various stages of the reopening of America. A heads up to Bundle subscribers, after tomorrow the LIVE Trading Room will be going on hiatus as Mary Ellen will also be out of pocket in the upcoming month. We hope to reopen in late-July. Please direct questions to erin@decisionpoint.com.
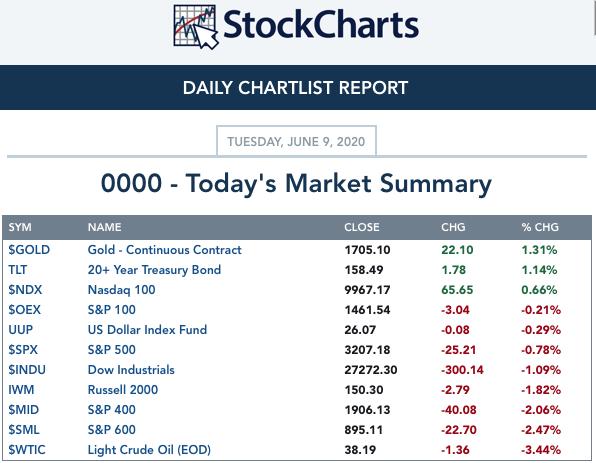
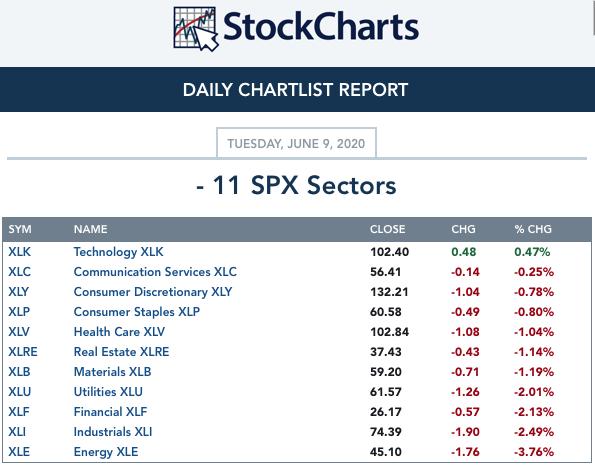
TODAY'S Broad Market Action:
Past WEEK Results: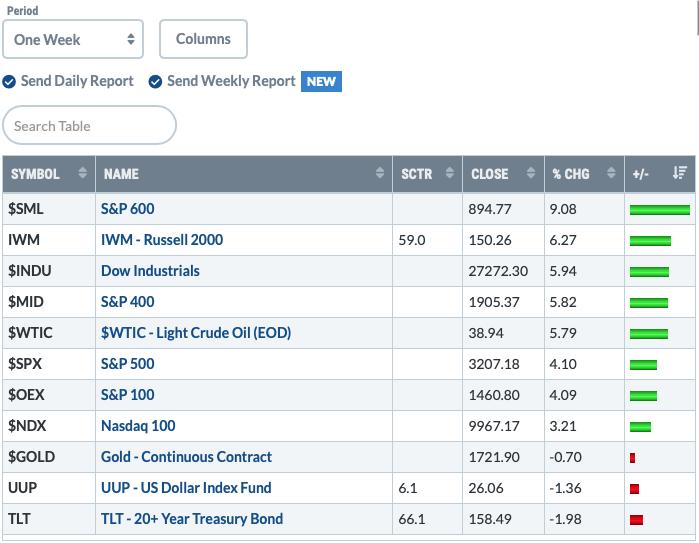
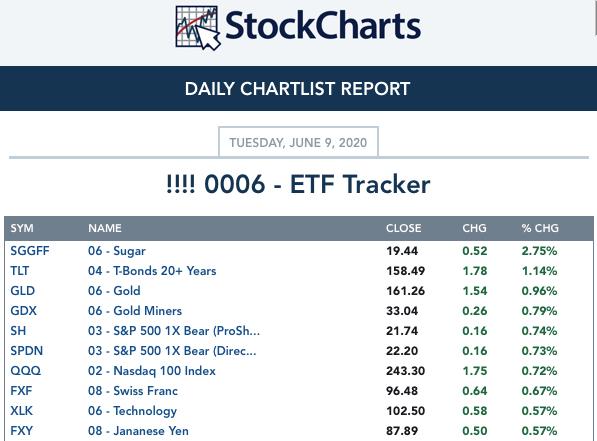
Top 10 from ETF Tracker:
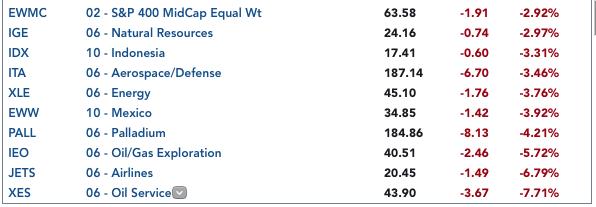
Bottom 10 from ETF Tracker:
On Friday, the DecisionPoint Alert Weekly Wrap presents an assessment of the trend and condition of the stock market (S&P 500), the U.S. Dollar, Gold, Crude Oil, and Bonds. Monday through Thursday the DecisionPoint Alert daily report is abbreviated and covers changes for the day.
Watch the latest episode of DecisionPoint on StockCharts TV's YouTube channel here!
SECTORS
SIGNALS:
Each S&P 500 Index component stock is assigned to one, and only one, of 11 major sectors. This is a snapshot of the Intermediate-Term (Silver Cross) and Long-Term (Golden Cross) Trend Model signal status for those sectors.
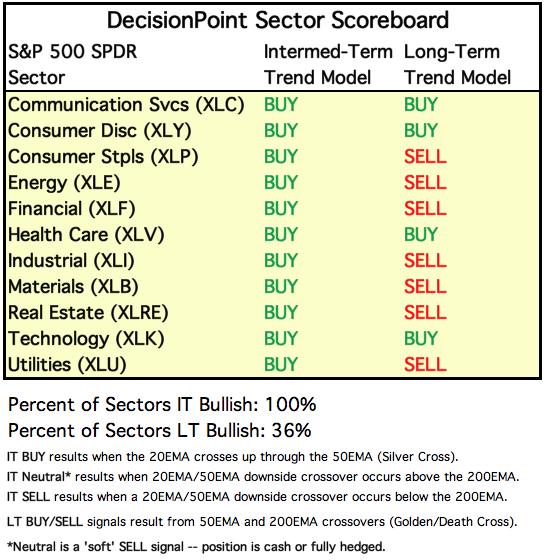
TODAY'S RESULTS:
One WEEK Results: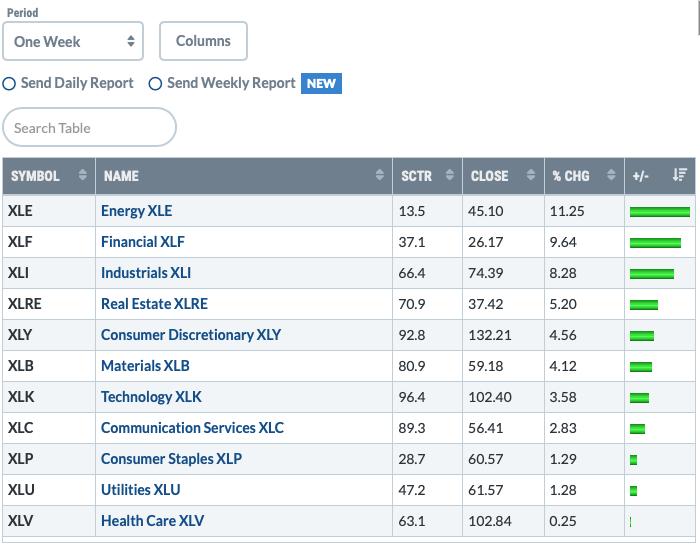
STOCKS
IT Trend Model: BUY as of 5/8/2020
LT Trend Model: BUY as of 6/8/2020
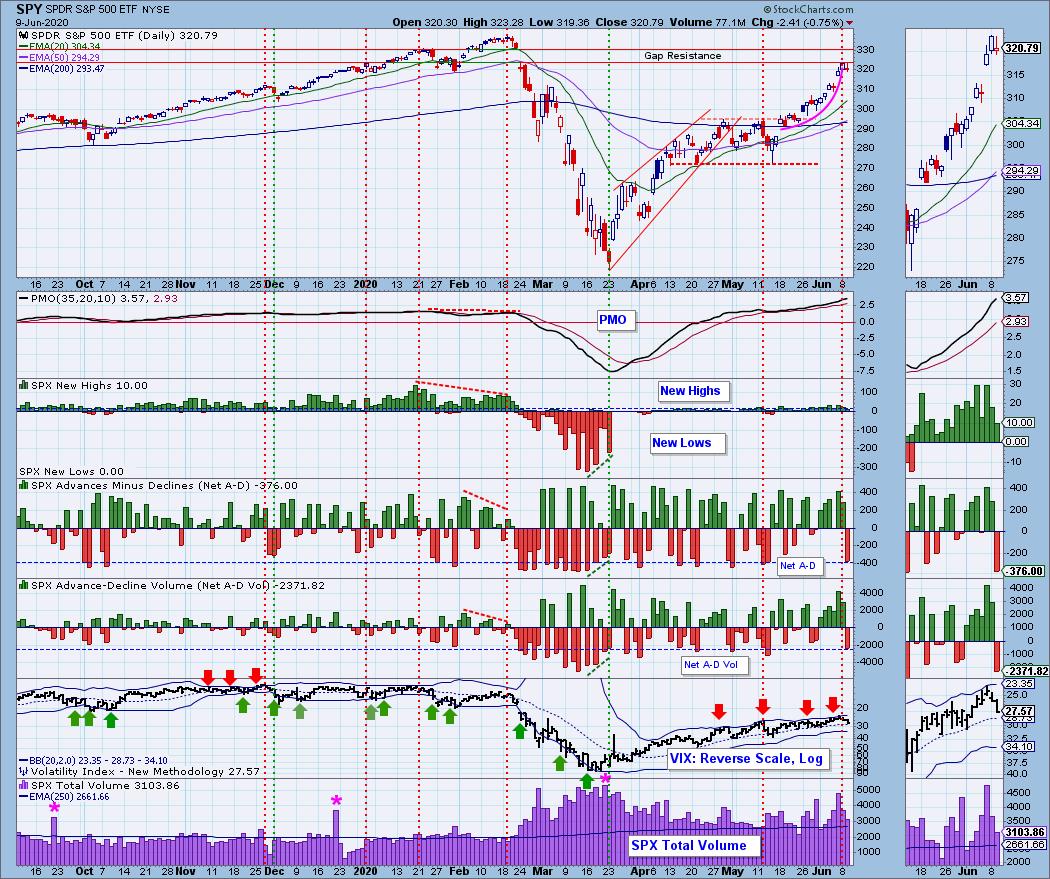
SPY Daily Chart: It appears that gap resistance is holding tough. This does seem an excellent place for price to consolidate sideways or pullback. The RSI is overbought and falling. The PMO is rising and the OBV is confirming the rally with rising bottoms. It may be difficult to see, but the rising wedge in the short term disintegrated as price broke to the upside from the pattern. I normally see that as very bullish, but given the overhead resistance, I don't think it'll continue on.
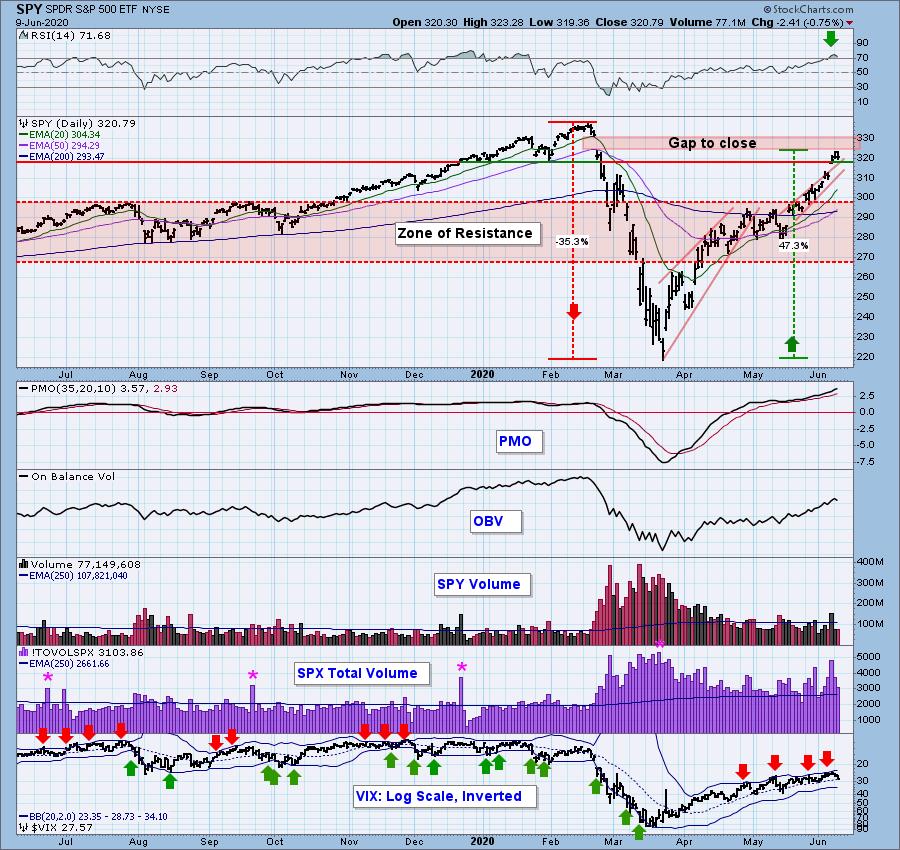
Climactic Market Indicators: Yesterday I said that the readings were showing an exhaustion climax. Prices indeed fell today and we saw very climactic negative readings. My sense is that this is now a selling initiation. The VIX remains above its average on the inverted scale, but is declining which also suggests lower prices. New Highs have been falling for the past two days.
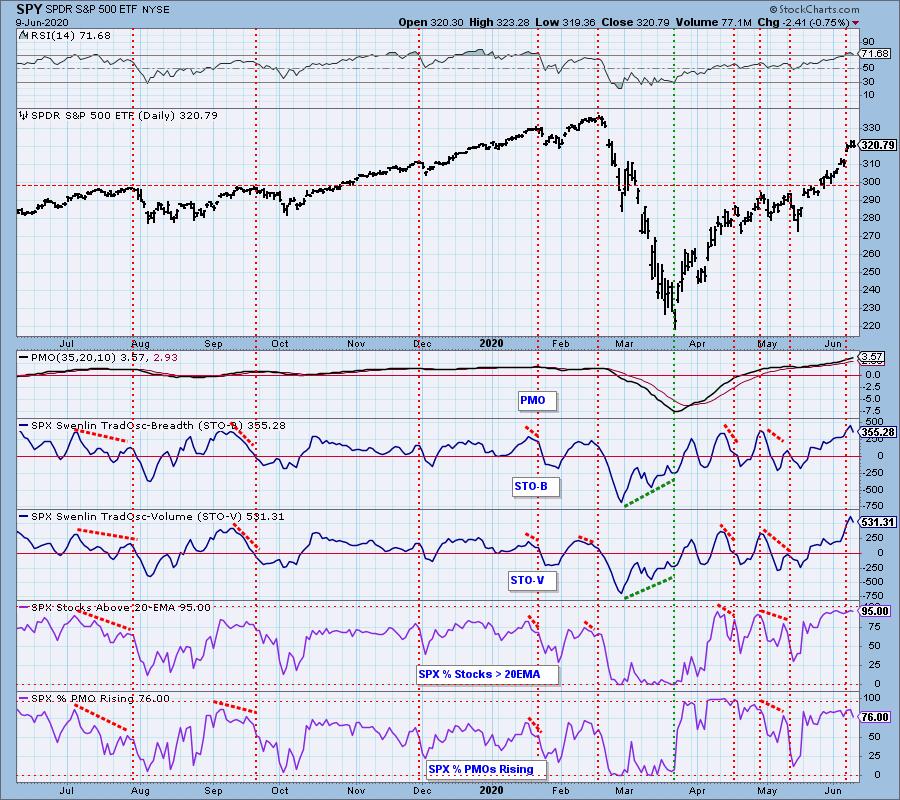
Short-Term Market Indicators: The ST trend is UP and the market condition is EXTREMELY OVERBOUGHT based upon the Swenlin Trading Oscillator (STO) readings. This is the sign we were waiting for. The STOs have turned down along with %Stocks indicators. This suggests a short-term decline ahead.
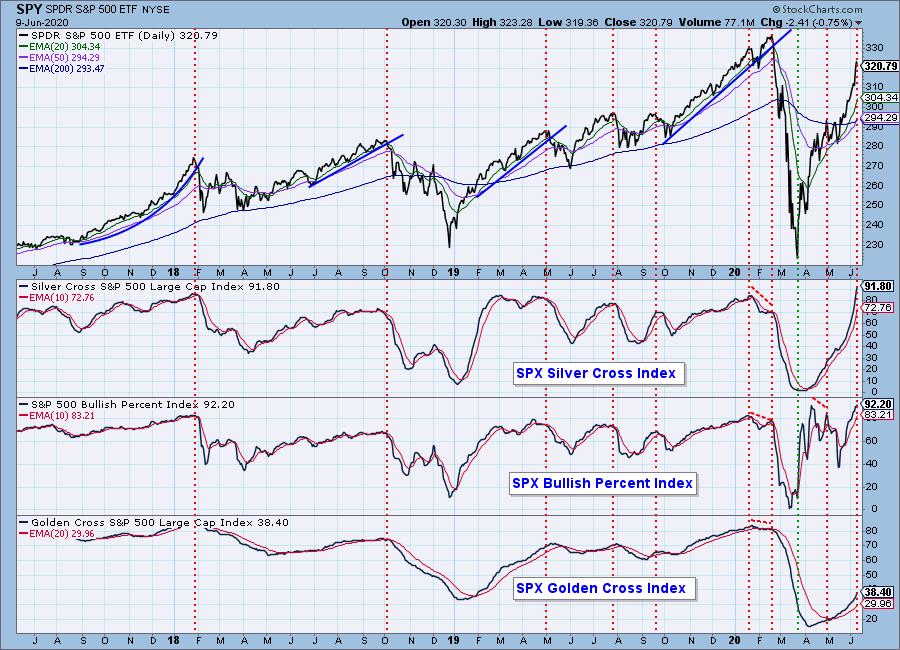
Intermediate-Term Market Indicators: The Silver Cross Index (% of SPX stocks 20EMA > 50EMA) and the Golden Cross Index (percent of SPX stocks 50EMA > 200EMA) are rising. All of these indicators continue to rise but the SCI and BPI are both very overbought.
The IT trend is UP and the market condition is EXTREMELY OVERBOUGHT based upon the ITBM and ITVM. We have an official negative divergence with the %PMO Xover BUY Signals. That indicator had flattened but hadn't actually turned down to form that second top. The other indicators are extremely overbought, albeit rising.
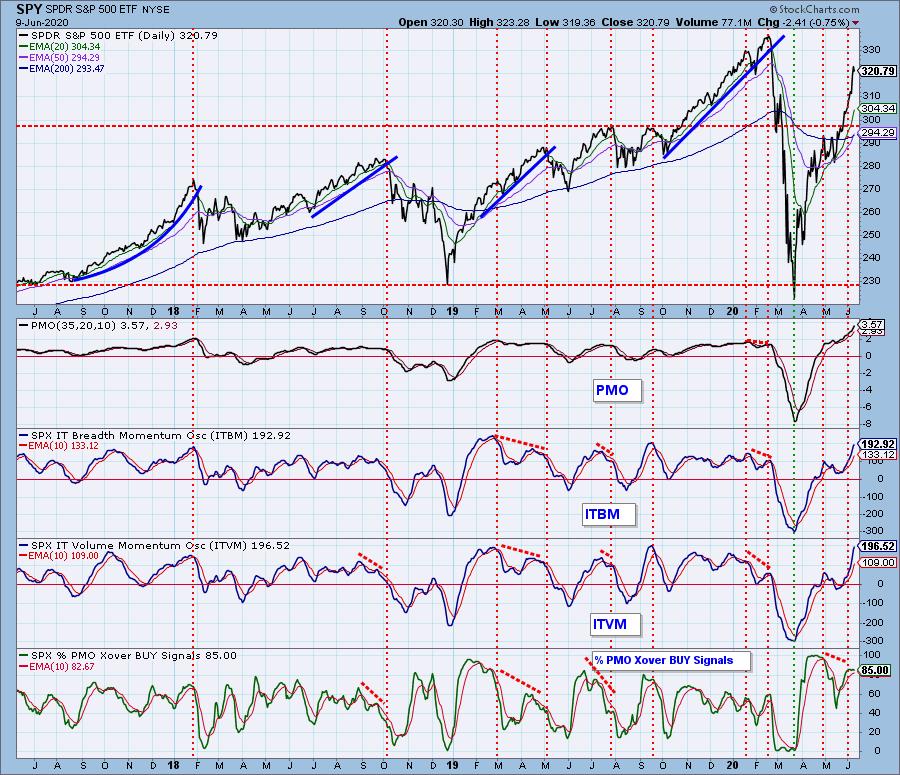
CONCLUSION: The ST trend is UP and IT trend is UP. Market condition based on ST indicators and IT indicators is EXTREMELY OVERBOUGHT. The indicators suggest decline ahead or at best consolidation under gap resistance. Seeing the STOs turn down and the negative divergence on the %PMO Xover BUY Signals, I am bearish in the short term. IT indicators are extremely overbought, but are all still rising, so I'm not looking for a deep corrective move.
DOLLAR (UUP)
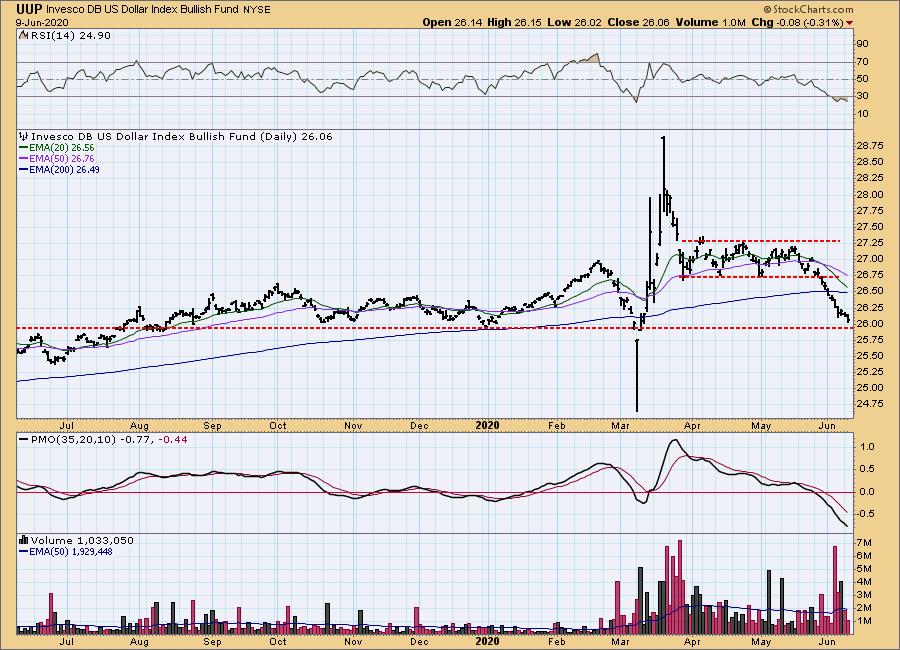
IT Trend Model: NEUTRAL as of 5/28/2020
LT Trend Model: BUY as of 5/25/2018
UUP Daily Chart: The PMO has slowed down and is very oversold. The RSI is also very oversold. Price has reached strong support at $26 and today, held it. As I noted yesterday, I believe UUP is lining up for an upside reversal.
GOLD
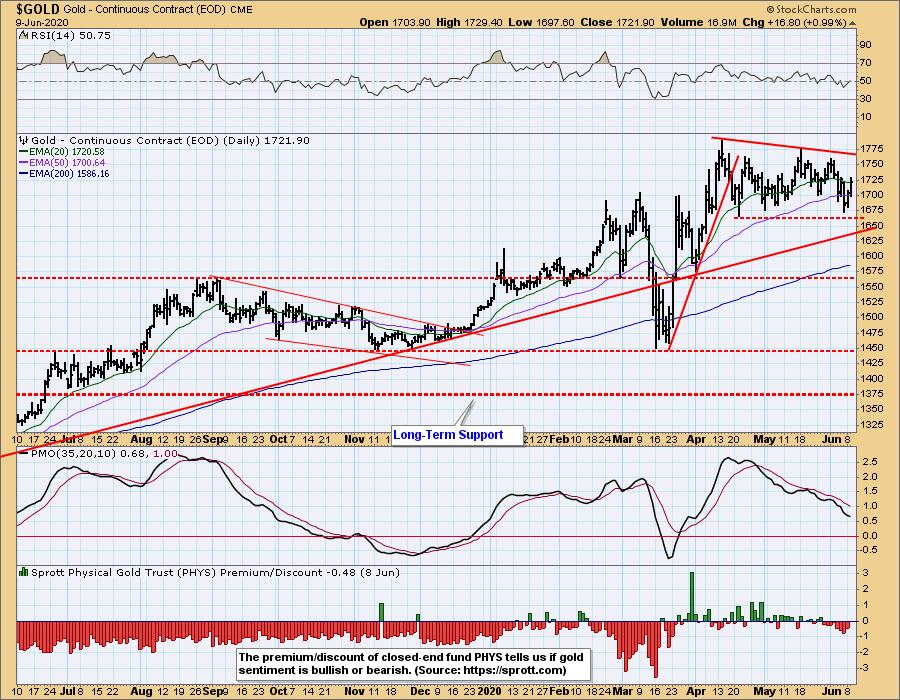
IT Trend Model: BUY as of 3/24/2020
LT Trend Model: BUY as of 1/8/2019
GOLD Daily Chart: Another rally for Gold but the PMO hasn't turned up yet. That's okay, today's rally took price above the 20-EMA. It bounced just before reaching support at the April bottom. The RSI is now above 50. I suspect the rally will continue, but I'm not expecting a big breakout. I suspect Gold is now in a wide trading range.
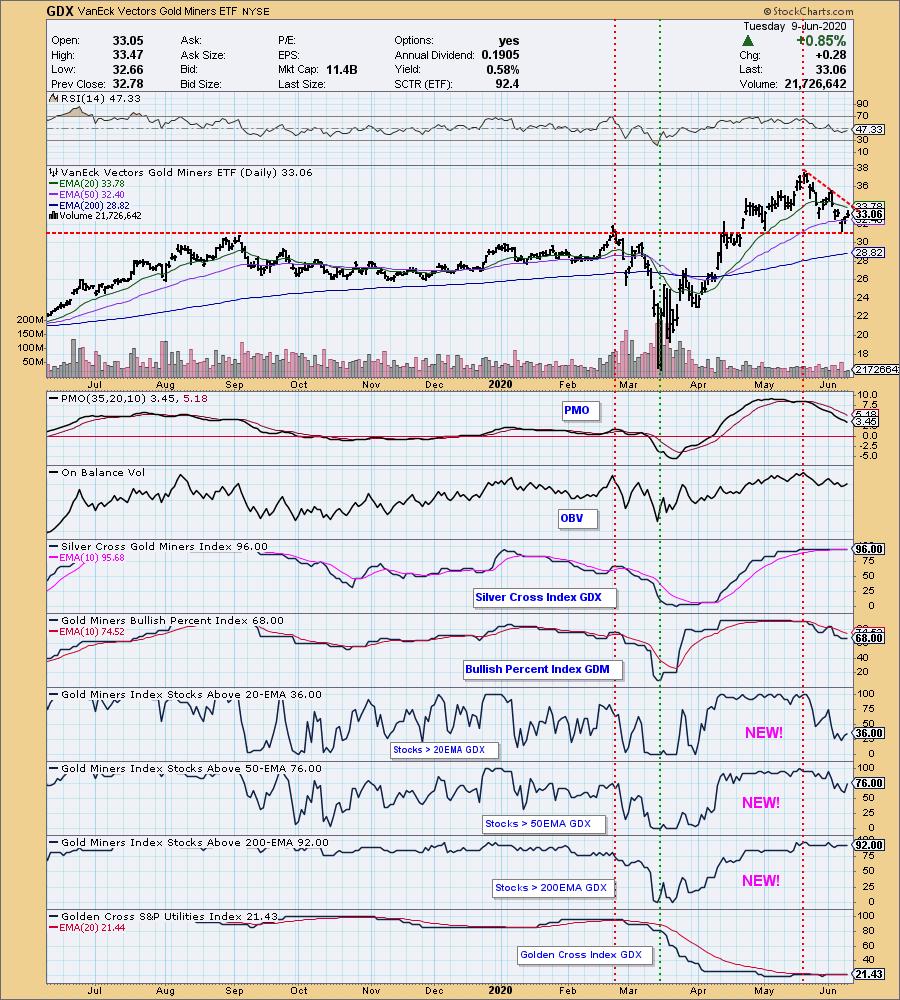
GOLD MINERS Golden and Silver Cross Indexes: Miners were up today. The bounce off support at the late April low is positive. The PMO hasn't turned up yet. If the indicators aren't overbought, they are in declining trends. I don't hold much confidence in a break above the declining tops trendline.
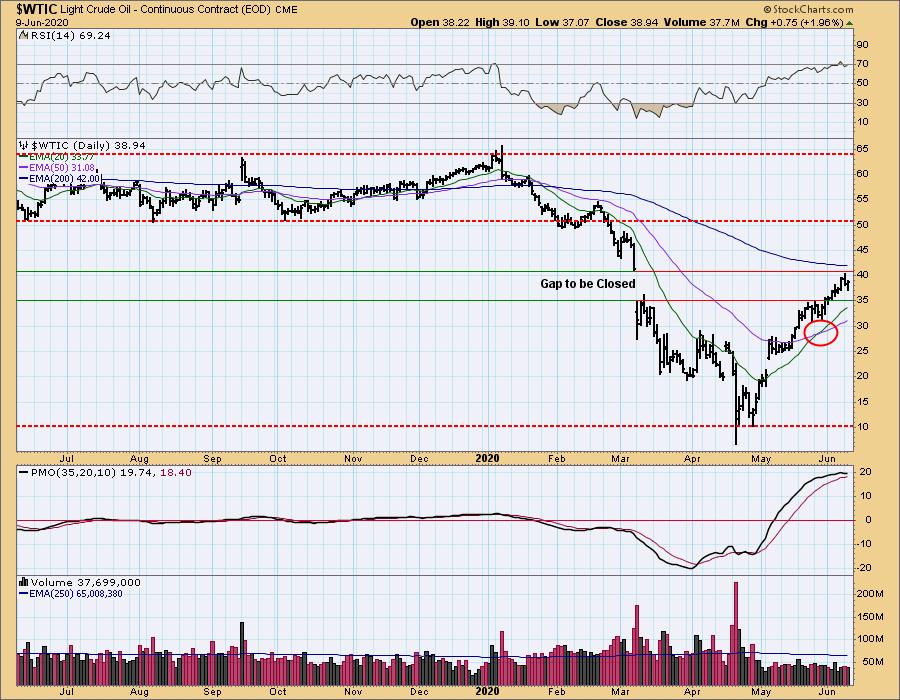
CRUDE OIL ($WTIC)
The oil market is under severe pressure due to a lack of demand, and we do not believe that USO is an appropriate investment vehicle at this time. Until further notice we will use $WTIC to track the oil market. Since this is a continuous contract dataset, it doesn't "play well" with our Trend Models, and we will not report Trend Model signals for oil.
$WTIC Daily Chart: The gap wasn't closed and price turned down. Likely it needs to work out overbought conditions. The PMO turned down and the RSI is overbought. It appears that gap resistance will hold this time around.
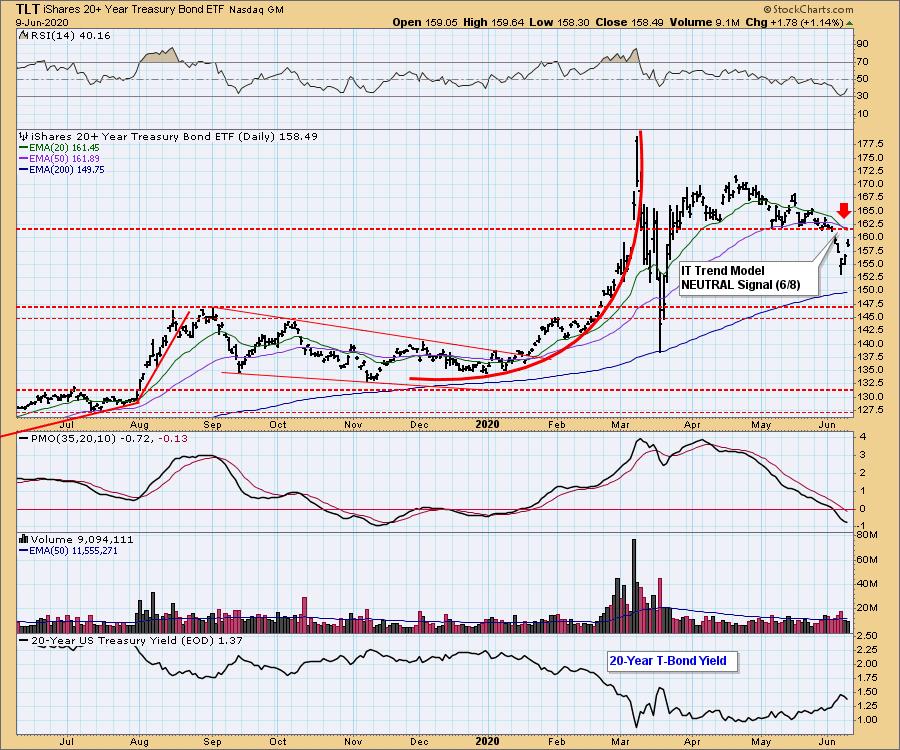
BONDS (TLT)
IT Trend Model: Neutral as of 6/5/2020
LT Trend Model: BUY as of 1/2/2019
TLT Daily Chart: After yesterday's rally, TLT continued higher with a strong gap up. Unfortunately, the IT Trend Model Neutral signal came in yesterday and horizontal resistance at the May lows won't be the only problem for price. Both the 20/50-EMAs are sitting along that resistance line currently. A bright spot is the RSI which turned up and a decelerating PMO. I'm not saying that price will be stopped at this overhead resistance, I'm saying that it could pose a problem and take some time to break above.
Have you subscribed the DecisionPoint Diamonds yet? DP does the work for you by providing handpicked stocks/ETFs from exclusive DP scans! Add it with a discount AND get the LIVE Trading Room for free! Contact support@decisionpoint.com for more information!
Technical Analysis is a windsock, not a crystal ball.
Happy Charting! - Erin
Email: erin@decisionpoint.com

Erin Swenlin will be presenting at the The MoneyShow Las Vegas August 16 - 20 at Bally's/Paris Resort! You'll have an opportunity to meet Erin and discuss the latest DecisionPoint news and Diamond Scans. Claim your FREE pass here! You can watch online with this pass too!! There will be online events held in May and when I have more information I'll let you know.
NOTE: The signal status reported herein is based upon mechanical trading model signals, specifically, the DecisionPoint Trend Model. They define the implied bias of the price index based upon moving average relationships, but they do not necessarily call for a specific action. They are information flags that should prompt chart review. Further, they do not call for continuous buying or selling during the life of the signal. For example, a BUY signal will probably (but not necessarily) return the best results if action is taken soon after the signal is generated. Additional opportunities for buying may be found as price zigzags higher, but the trader must look for optimum entry points. Conversely, exit points to preserve gains (or minimize losses) may be evident before the model mechanically closes the signal.
Helpful DecisionPoint Links (Can Be Found on DecisionPoint.com Links Page):
DecisionPoint Shared ChartList and DecisionPoint Chart Gallery
Price Momentum Oscillator (PMO)
Swenlin Trading Oscillators (STO-B and STO-V)