Attention

Your browser does not have JavaScript enabled!

In order to use DecisionPoint.com successfully, you must enable JavaScript in your browser.
Click Here to learn how to enable JavaScript.

decision point logo
  • Home
  • About Us
  • Subscriptions
  • Blogs and Links
  • New around here? Subscribe now! Forgot password?

    Manage Account

    • HOME
    • ABOUT US
    • SUBSCRIPTIONS
    • BLOGS AND LINKS

    One for the Bears and One for the Bulls

    Published on May 12, 2020 at 12:58 PM by Carl Swenlin

    FOR THE BEARS . . .

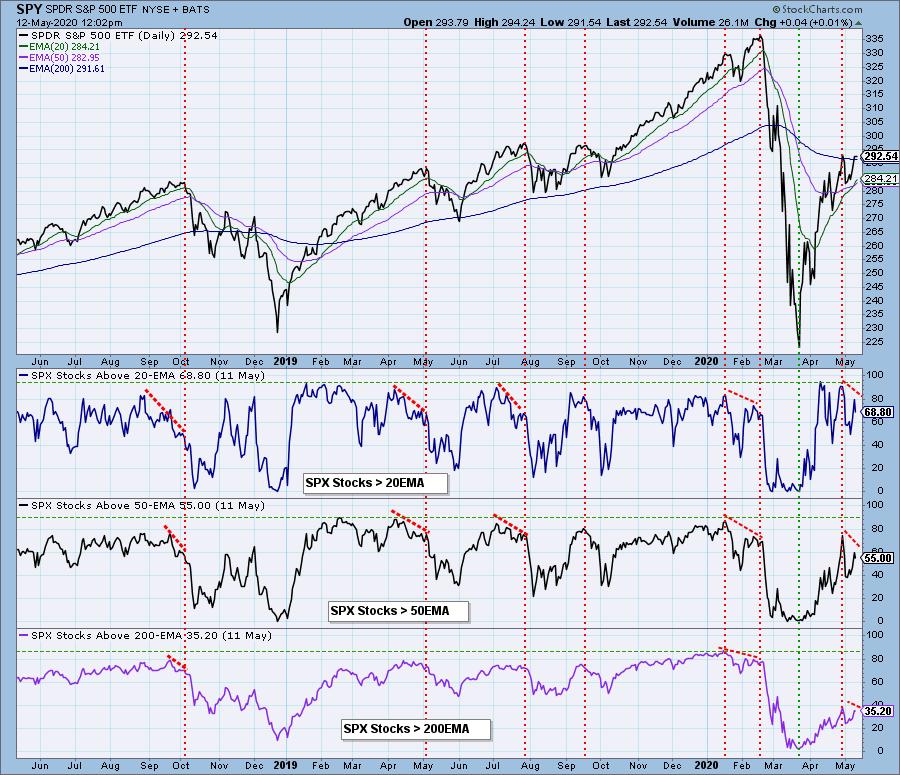
    This chart tracks the price of the individual S&P 500 component stocks relative to their 20EMA, 50EMA, and 200EMA. As price approaches the level of a prior top, I look for the indicators to make a lower top, which is a negative divergence. Such divergences tell us that fewer stocks are participating in the current price advance than the one before, and the message is that there is probably a price top and decline coming. We can see how reliable these warnings have proven to be in the past, although the amount of the declines varies greatly.

    As investors we want to accomplish two basic things: (1) Determine the trend and condition of the market, and (2) select stocks that will ride that tide. The DecisionPoint Alert helps with the first step, and DecisionPoint Diamonds helps with the second. Go to DecisionPoint.com and SUBSCRIBE TODAY!


    FOR THE BULLS . . .

    If you're looking for a reason to be bullish, here's a chart that that I featured in last Friday's DecisionPoint ALERT. It shows the percentage of S&P 500 stocks that have PMO crossover buy signals, and recently it went from zero to 100% in a short period of time. When an indicator goes from very oversold to very overbought in one swift, smooth, uninterrupted move, it is a very bullish sign. We can see a similar move from the 2018 price low, and, even though the indicator subsequently drops rather precipitously from its high, we can see that the initial thrust launched an impressive rally. Will that follow through be duplicated this time? It could happen, but, as usual, there is no guarantee; nevertheless, this looks like a good start.
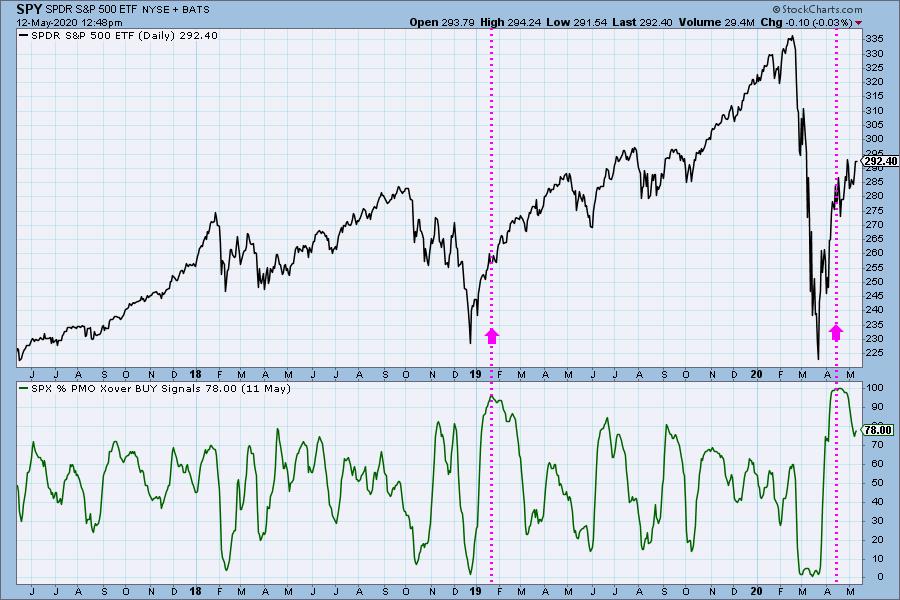

    CONCLUSION: So we have a bearish sign and a bullish sign. Which should we believe? Actually, both could be right. While the bearish sign has the potential to be completely dominant, we could see a technical correction, even a substantial one, followed by a resumption of the rally. I personally tend to look for a more bearish result, but that bullish thrust on the second chart is quite compelling, and can't be ignored. Of course, other outcomes are possible, but I think these charts prepare us for many of the possible variations.

    ** NOTE: I posted these charts intraday, and the indicators do not update until after the close.


    Technical Analysis is a windsock, not a crystal ball.


    Helpful DecisionPoint Links:

    DecisionPoint Alert Chart List

    DecisionPoint Golden Cross/Silver Cross Index Chart List

    DecisionPoint Sector Chart List

    DecisionPoint Chart Gallery

    Trend Models

    Price Momentum Oscillator (PMO)

    On Balance Volume

    Swenlin Trading Oscillators (STO-B and STO-V)

    ITBM and ITVM

    SCTR Ranking


    Blog Archive
    Previous Article
    Next Article

    Contact Us

    Email: support@decisionpoint.com

    © Proudly created by Alamo City Marketing Solutions

    Socialize With Us

    DecisionPoint logo

    DecisionPoint is not a registered investment advisor. Investment and trading decisions are solely your responsibility. None of the DecisionPoint newsletters or web site materials should be interpreted as a recommendation or solicitation to buy or sell any security or to take any specific action.

    DecisionPoint does not represent or endorse the accuracy or reliability of any of the information, content, or advertisements contained on, distributed through, linked from, downloaded or otherwise accessed from any of the services contained on this web site or in our newsletters, nor the quality of any products, information or other materials displayed, purchased, or obtained by you as a result of an advertisement or any other information or offer in or in connection with the materials. You hereby acknowledge that any reliance upon any Materials shall be at your sole risk. It is your responsibility to verify from other sources, such as your broker, critical elements of a decision to act. DecisionPoint reserves the right, in its sole discretion and without any obligation, to make improvements/changes to, or to correct any error or omissions in any portion of the Materials.

    THE SERVICE AND THE MATERIALS ARE PROVIDED BY DECISIONPOINT ON AN "AS IS" BASIS, AND DECISIONPOINT EXPRESSLY DISCLAIMS ANY AND ALL WARRANTIES, EXPRESS OR IMPLIED, INCLUDING WITHOUT LIMITATION WARRANTIES OF MERCHANTABILITY AND FITNESS FOR A PARTICULAR PURPOSE, WITH RESPECT TO THE SERVICE OR ANY MATERIALS AND PRODUCTS. IN NO EVENT SHALL DECISIONPOINT BE LIABLE FOR ANY DIRECT, INDIRECT, INCIDENTAL, PUNITIVE, OR CONSEQUENTIAL DAMAGES OF ANY KIND WHATSOEVER WITH RESPECT TO THE SERVICE, THE MATERIALS AND THE PRODUCTS.