
GLOBAL MARKETS
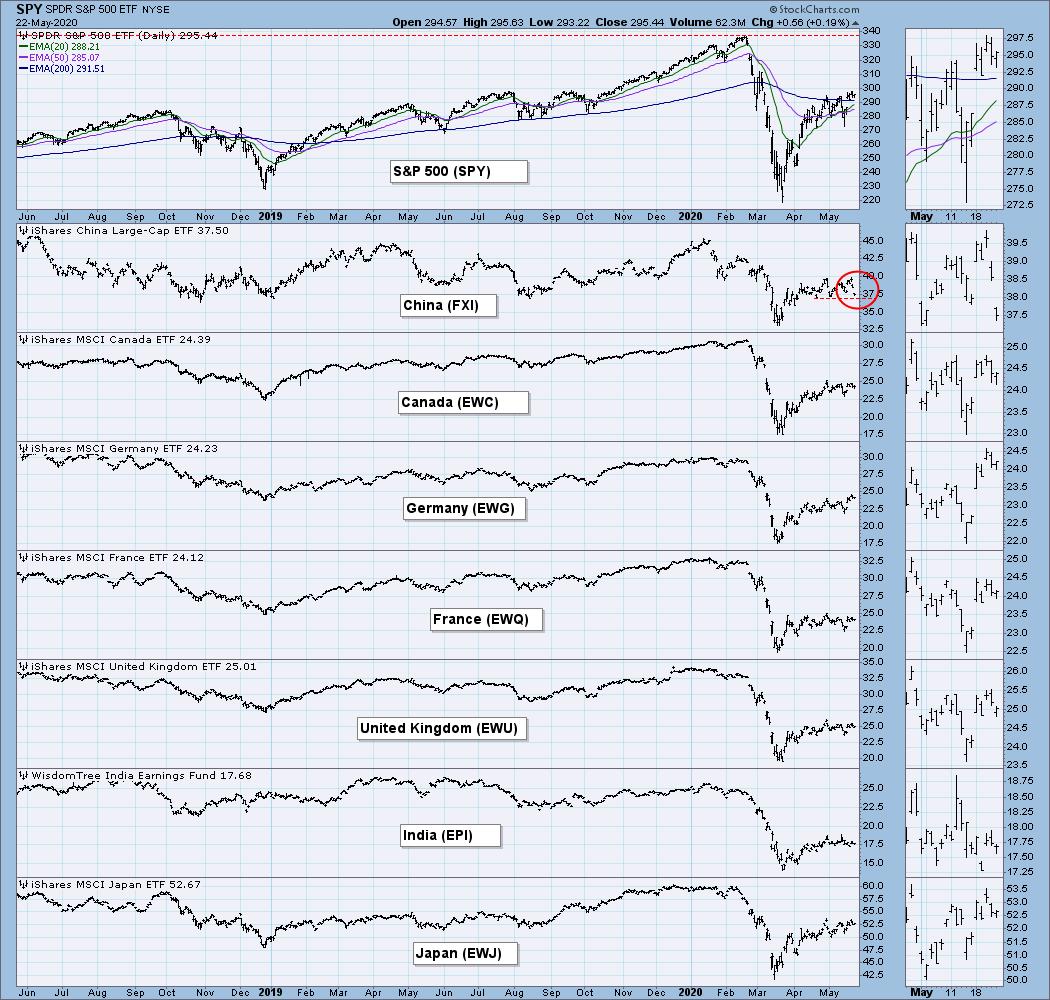
We always make this chart available so we can stay generally informed on the relative performance of global markets. While I don't normally comment on it, today I thought that I should point out how the China ETF (FXI) has started breaking down. Nothing critical yet, it is still above the support line drawn across the May low, but we can see that this week it has shown a lot more weakness than other markets. The causes are fairly obvious: (1) increasing tensions between the U.S. and China because of COVID-19, (2) China's move on Friday to beat down freedom in Hong Kong, and (3) the Trump administration's insistence that Chinese stocks meet the same standards as other stocks trading in our markets.
The DecisionPoint Alert Weekly Wrap presents an end-of-week assessment of the trend and condition of the Stock Market, the U.S. Dollar, Gold, Crude Oil, and Bonds. The DecisionPoint Alert daily report (Monday through Thursday) is abbreviated and gives updates on the Weekly Wrap assessments.
Watch the latest episode of DecisionPoint on StockCharts TV's YouTube channel here!
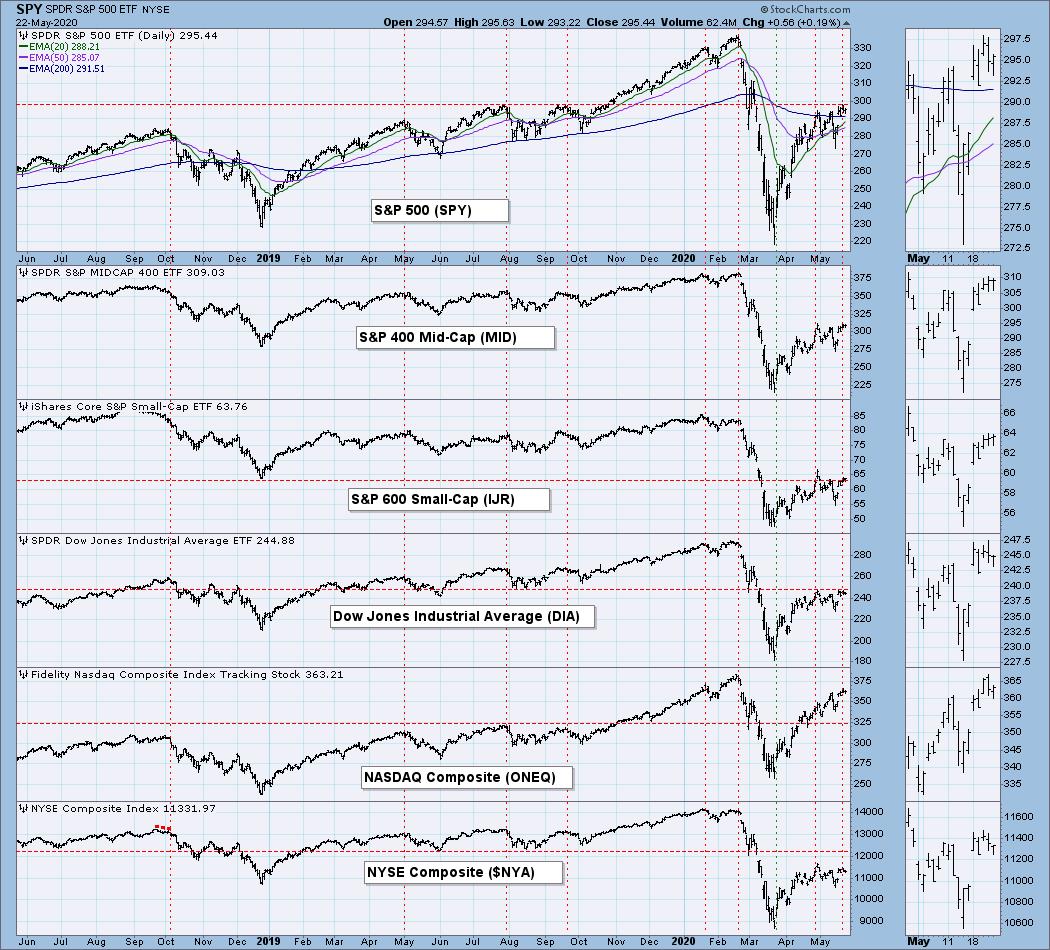
BROAD MARKET INDEXES
SECTORS
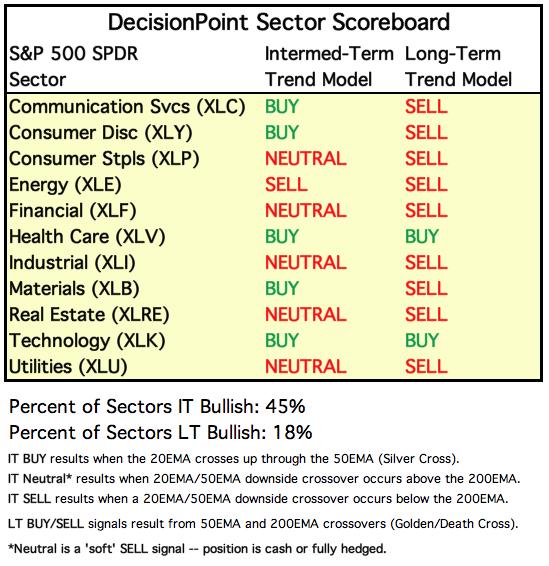
Each S&P 500 Index component stock is assigned to one, and only one, of 11 major sectors. This is a snapshot of the Intermediate-Term (Silver Cross) and Long-Term (Golden Cross) Trend Model signal status for those sectors.
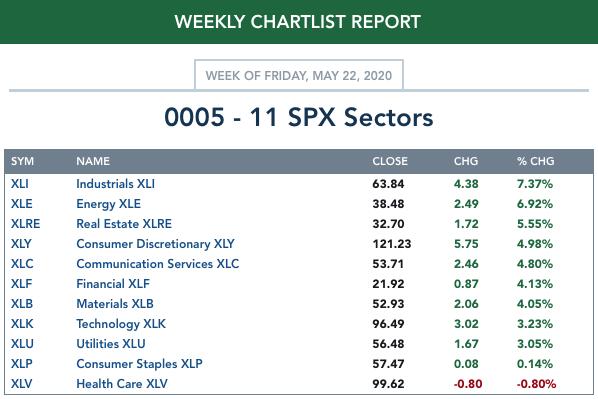
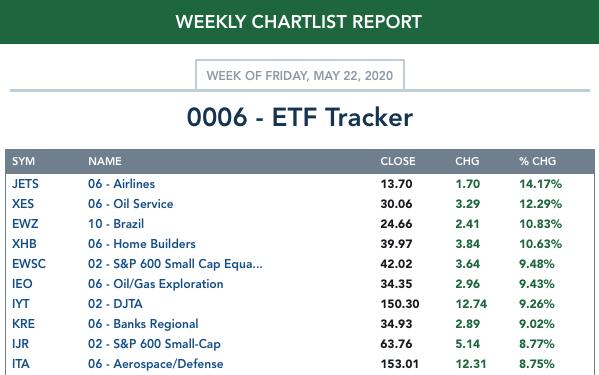
ETF TRACKER: This is a list of about 100 ETFs intended to track a wide range of U.S. market indexes, sectors, global indexes, interest rates, currencies, and commodities. StockCharts.com subscribers can acquire it in the DecisionPoint Trend and Condition ChartPack.
Top 10 . . .
. . . and bottom 10: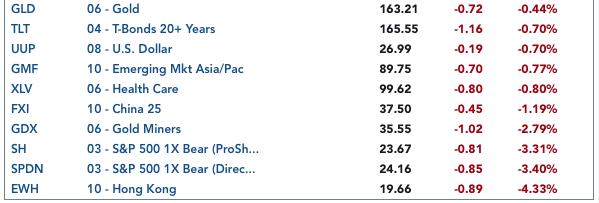
INTEREST RATES
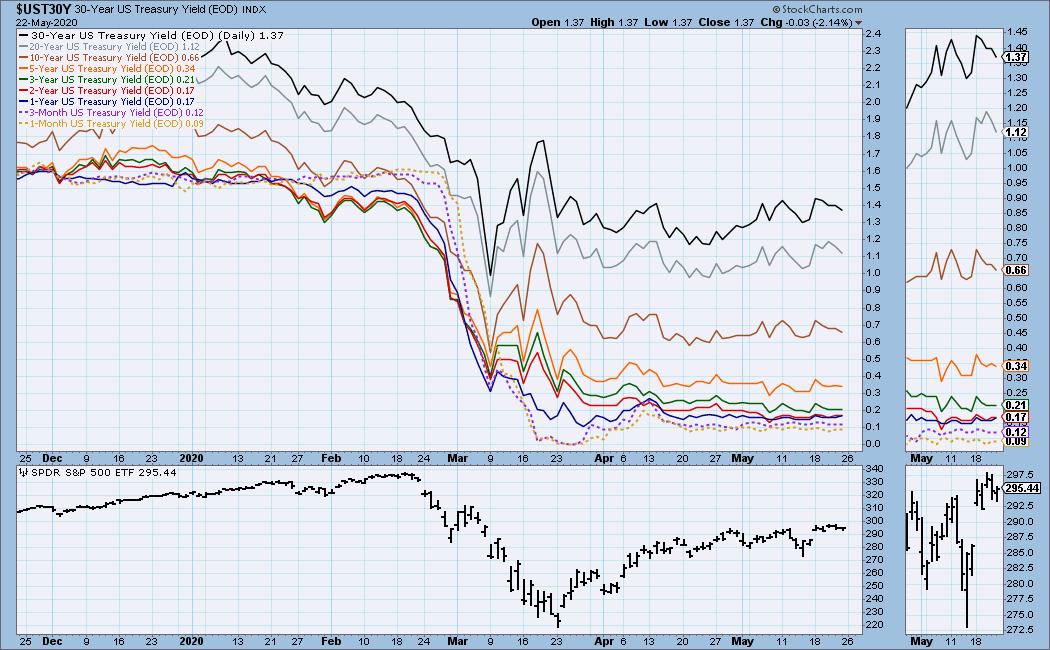
This chart is included so we can monitor rate inversions. In normal circumstances the longer money is borrowed the higher the interest rate that must be paid. When rates are inverted, the reverse is true.
STOCKS
IT Trend Model: BUY as of 5/8/2020
LT Trend Model: SELL as of 3/19/2020
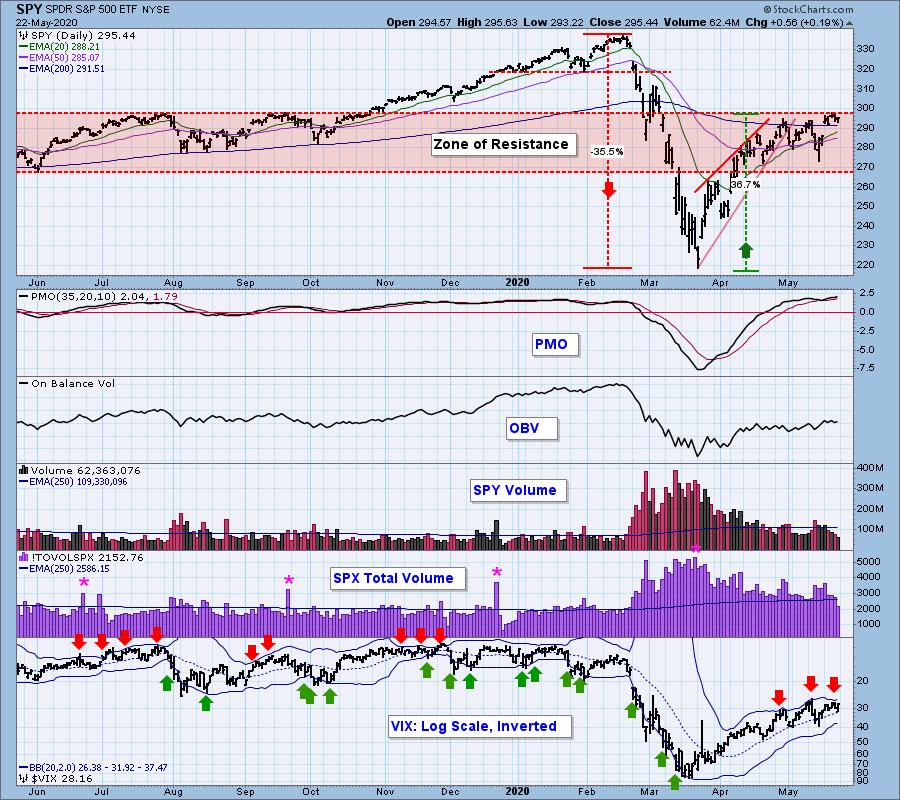
SPY Daily Chart: After Monday's +3% advance, price settled into a very narrow range, seemingly stopped by the top of the trading range or the 200EMA. Volume was light on Friday -- holiday related, not otherwise significant.
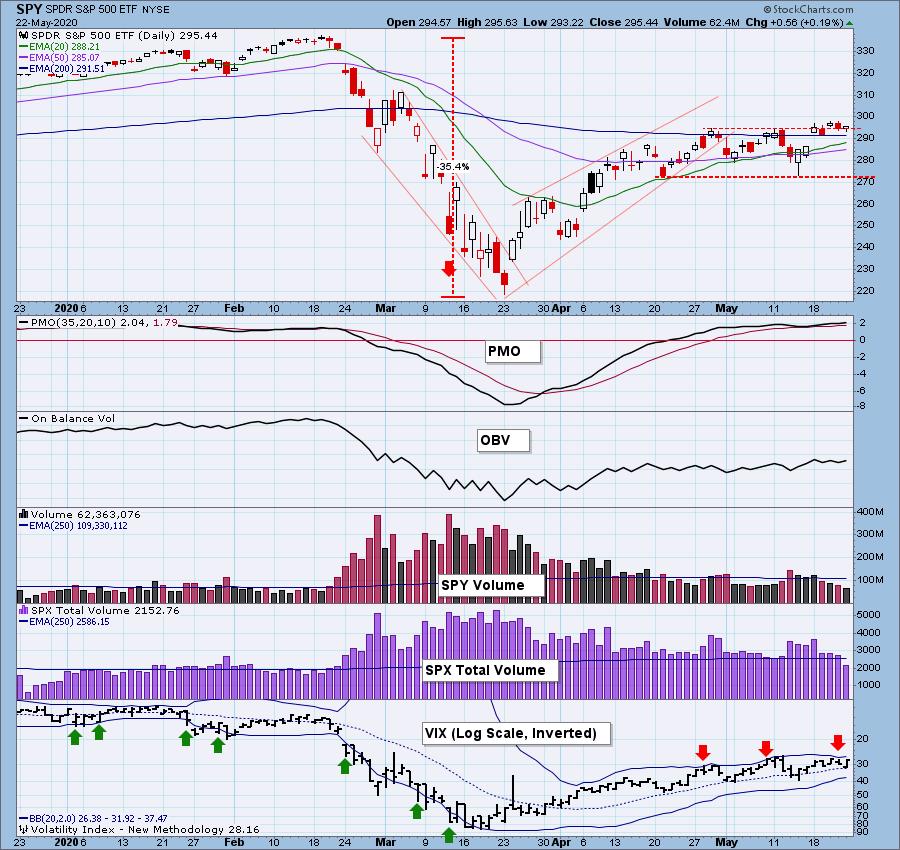
Price has hit the top of the zone of resistance we have been watching. Also, note that the VIX has given an overbought signal by crowding the top Bollinger Band, and a short-term price retreat is likely.
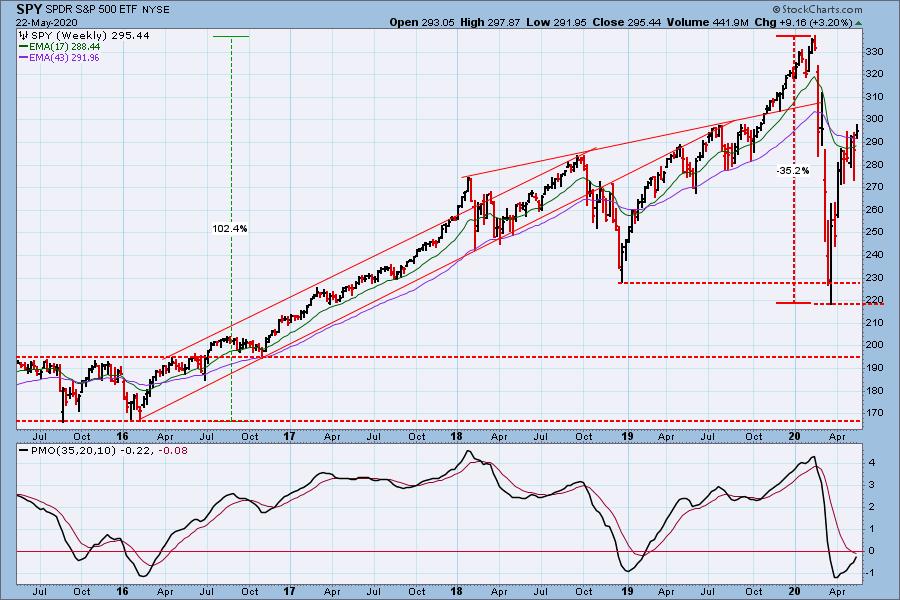
SPY Weekly Chart: The advance of the weekly PMO off its recent bottom seems labored compared to the two previous PMO bottoms, possibly a sign that the rally is coming to an end.
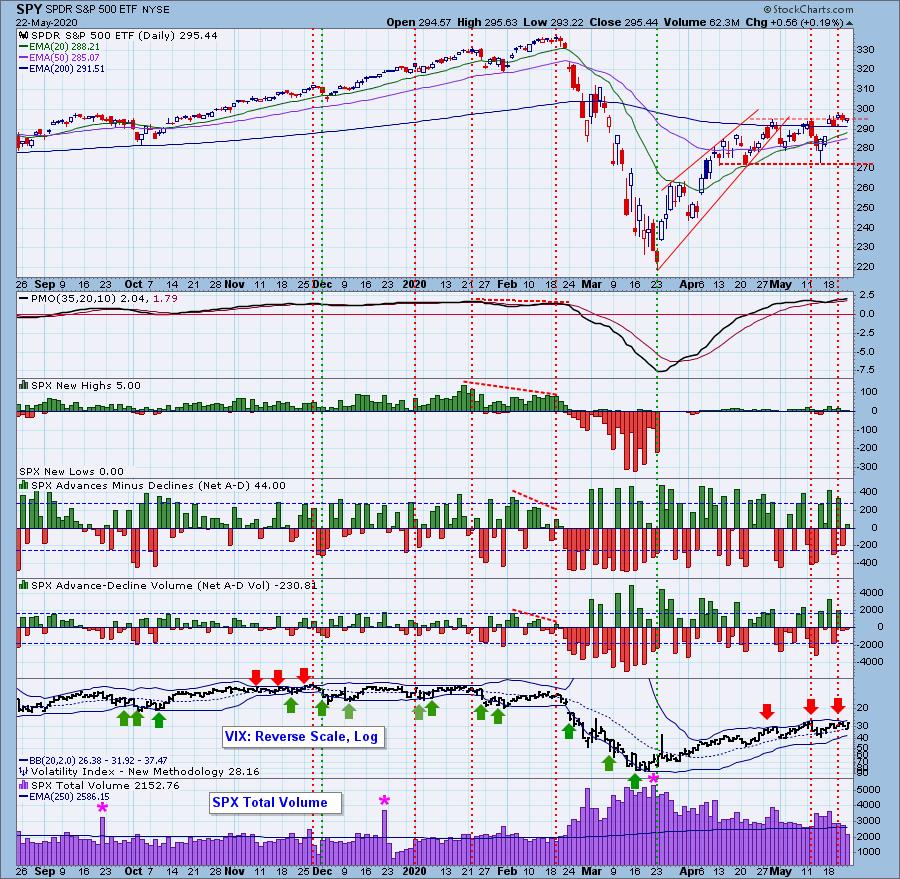
Climactic Market Indicators: Monday's climactic action looked promising as an upside initiation climax, but it turned out to be an exhaustion climax, marking the end of the rally from last week's low.
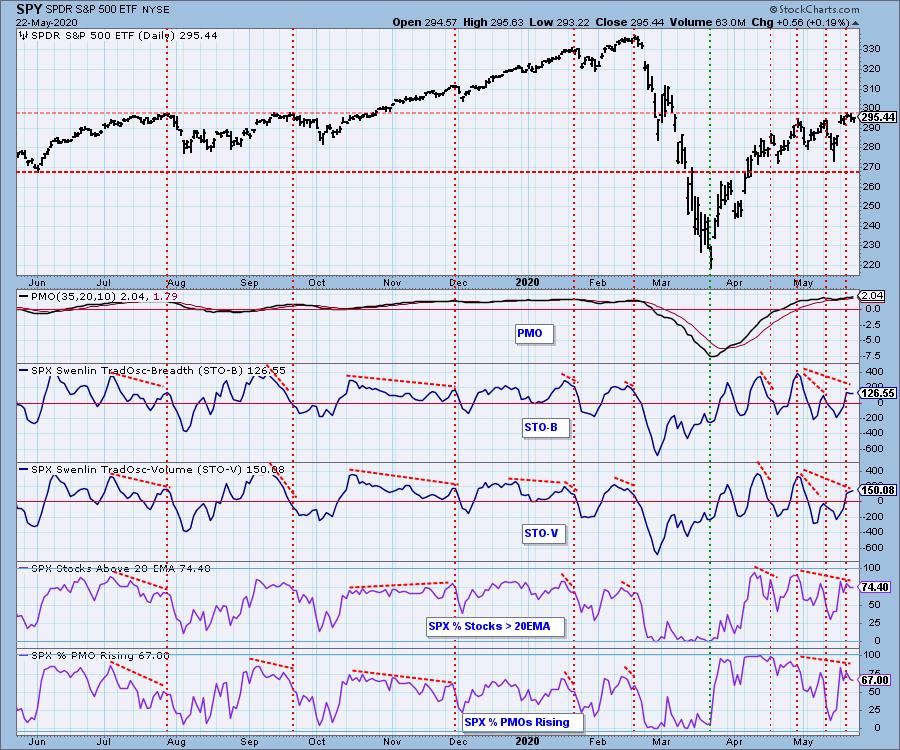
Short-Term Market Indicators: The short-term market trend is SIDEWAYS and the condition is modestly OVERBOUGHT. Notice that all the indicators are lower than they were at their late-April tops, showing lower participation in this week's market advance.
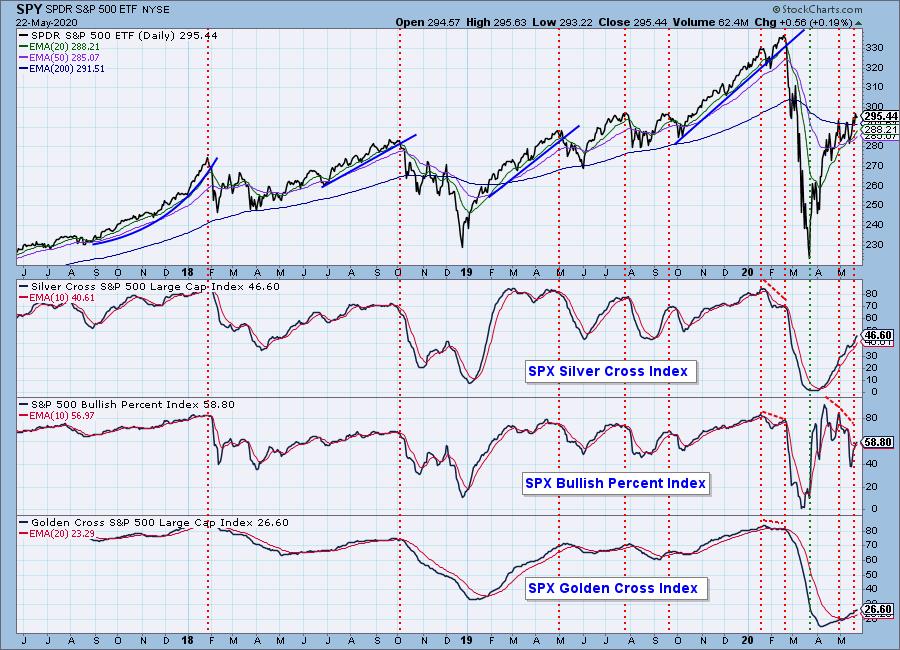
Intermediate-Term Market Indicators: Worthy of remark on this chart is the sharp BPI negative divergence. That is one of the more significant technical issues for this week. The BPI is -36% down from its April high, which is a stunning contraction of the number of stocks participating in the rally.
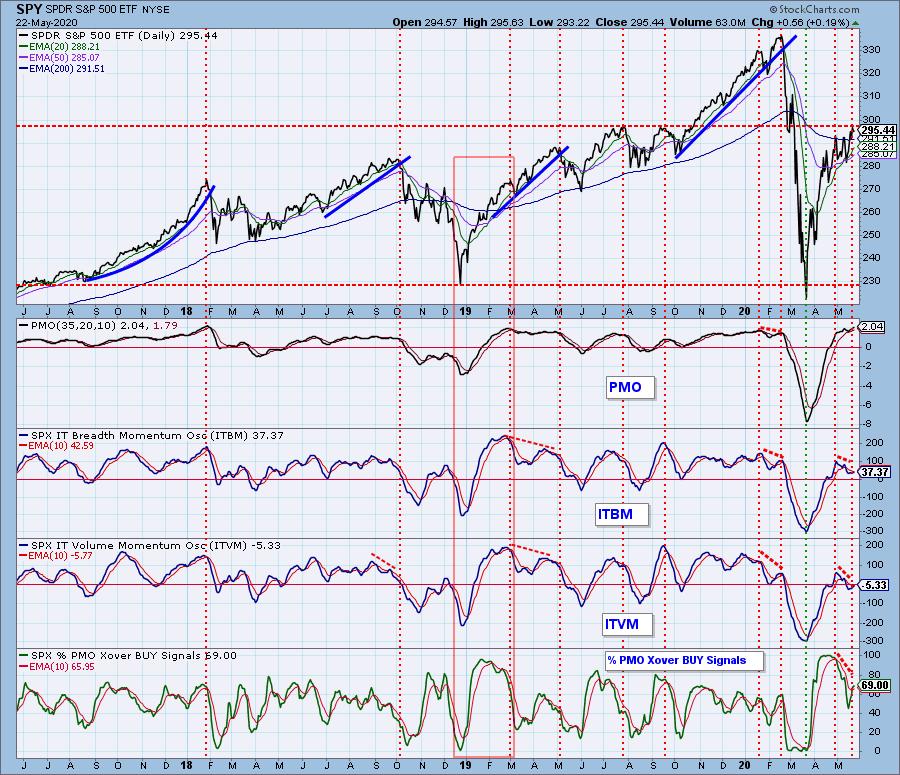
The intermediate-term market trend is UP. The condition is MIXED with the daily PMO being overbought, and the remaining indicators neutral. The ITBM and ITVM failed to reach normal overbought levels during the rally, and they have been creeping lower while prices moved higher, and the Percent of PMO Crossover BUY Signals reflects weak participation similar to the BPI on the chart above.
CONCLUSION: Last week I said, "Granted, the two-day upside reversal we saw on Thursday and Friday could continue next week and bend those indicators skyward, but right now, at this moment, it doesn't look good for next week and beyond." As it turned out, before Monday's open, Moderna (MRNA) announced that it had a vaccine in testing that could be ready by the end of the year. The futures went through the roof, and the market followed after the open. After Monday's pop, the Moderna story seemed to loose traction, but the market still didn't seems to have any interest in falling. Market participants are in a "V-shaped recovery," "look across the valley" frame of mind, and the re-opening of the economy has spirits high -- good news celebrated, bad news ignored.
Be that as it may, there are still troubling technical issues, discussed above, that warn of trouble. Specifically, the SPY daily PMO is overbought, and contracting participation does not support continued new rally highs. More good news next week could stimulate a repeat of this week, but failing that, my outlook for the intermediate-term is negative.
The U.S. markets will be closed on Monday for Memorial Day.
Have you subscribed the DecisionPoint Diamonds yet? DP does the work for you by providing handpicked stocks/ETFs from exclusive DP scans! Add it with a discount! Contact support@decisionpoint.com for more information!
DOLLAR (UUP)
IT Trend Model: BUY as of 3/13/2020
LT Trend Model: BUY as of 5/25/2018
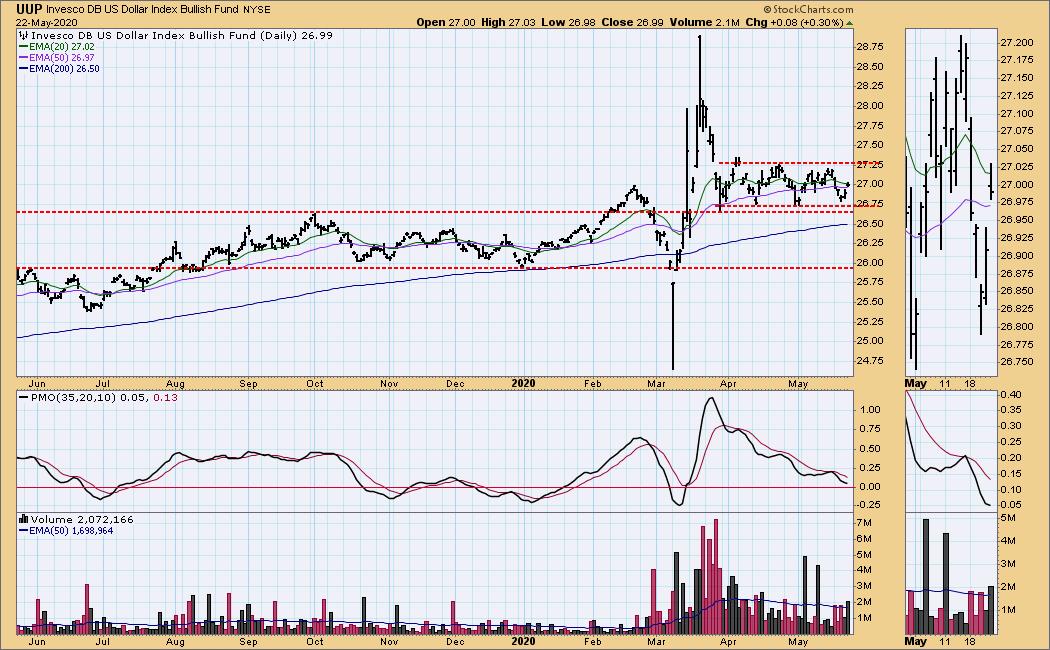
UUP Daily Chart: Price has been in a narrow two percentage point range for two months. My guess is that the market is in a "wait-and-see" mode until there is more visibility on how the U.S. economy will recover relative to other global economies.
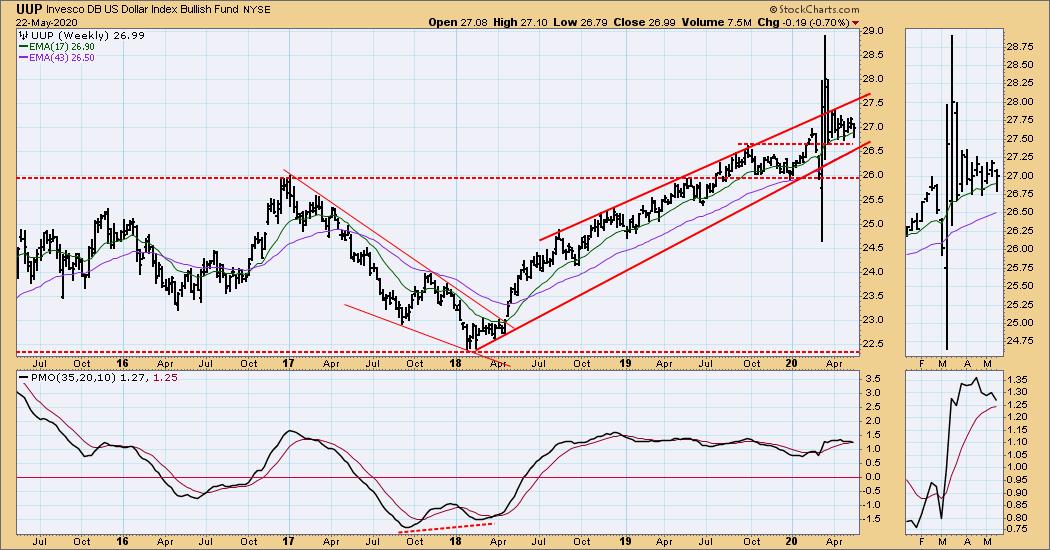
UUP Weekly Chart: Sideways price movement is not hurting the technical picture at present, as the bottom of the rising trend channel will not be encountered for at least another month at this pace.
GOLD
IT Trend Model: BUY as of 12/26/2019
LT Trend Model: BUY as of 1/8/2019
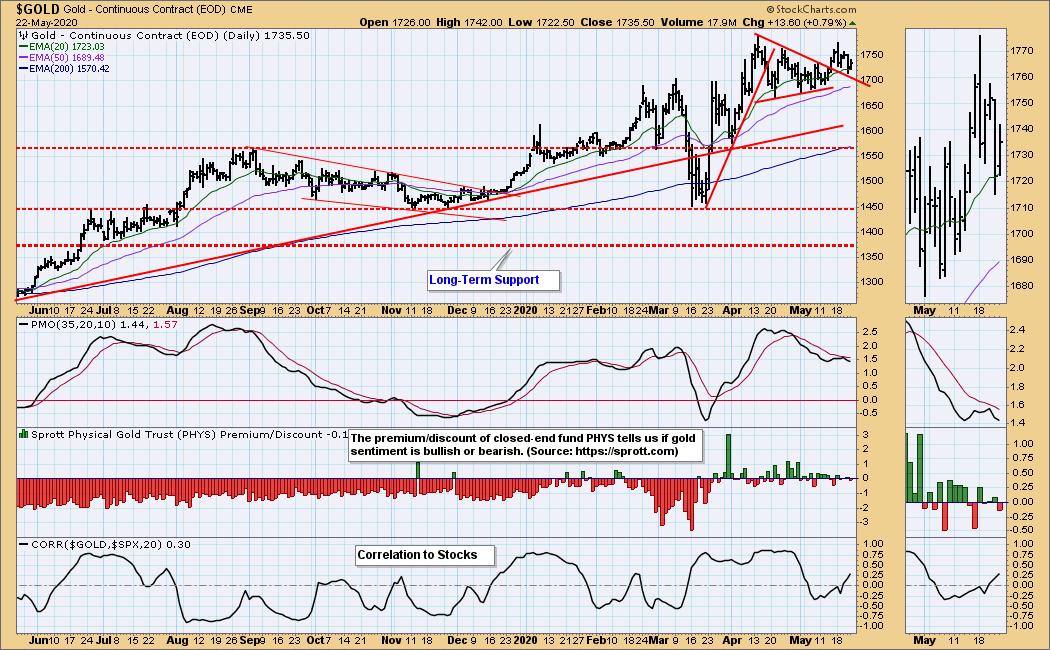
GOLD Daily Chart: Gold broke out of a symmetrical triangle, and has pulled back to the declining tops line. The problem on this chart is that the daily PMO has topped below the signal line, which is a very bearish look.
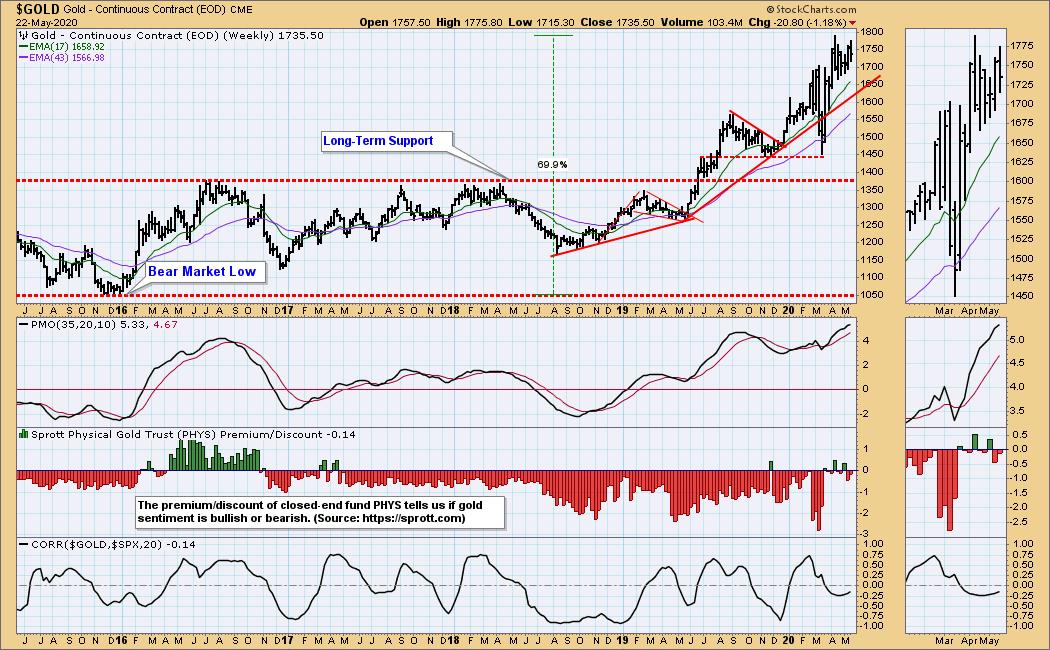
GOLD Weekly Chart: Gold look very bullish in this time frame, although a pullback to the rising trend line may be necessary. The weekly PMO is overbought in this time frame, but longer-term a +10 PMO reading is not impossible during a strong advance.
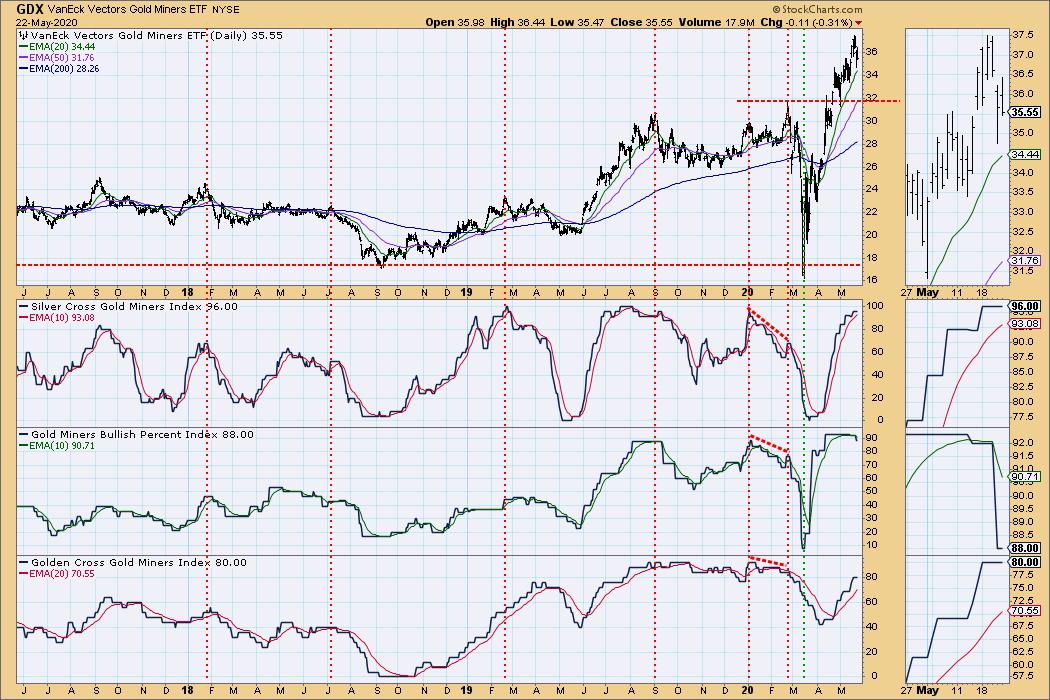
GOLD MINERS Golden and Silver Cross Indexes: These indicators are overbought, but they can stay that way for extended periods. GDX has had a strong rebound from the March low, and a pullback to the support line drawn across the February top would not damage the positive technical picture.
CRUDE OIL ($WTIC)
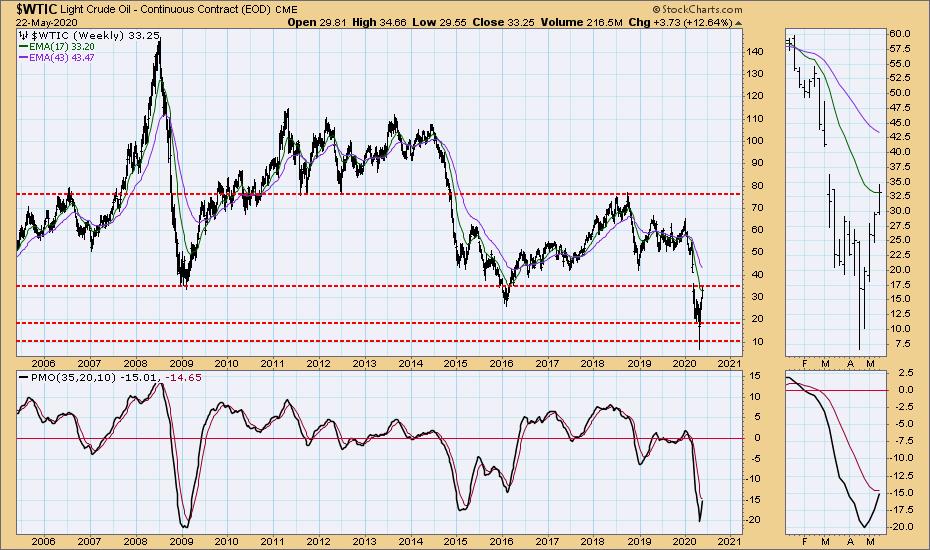
Until further notice we will use $WTIC to track the oil market. Since this is a continuous contract dataset, it doesn't "play well" with our Trend Models, and we will not report Trend Model signals for oil.
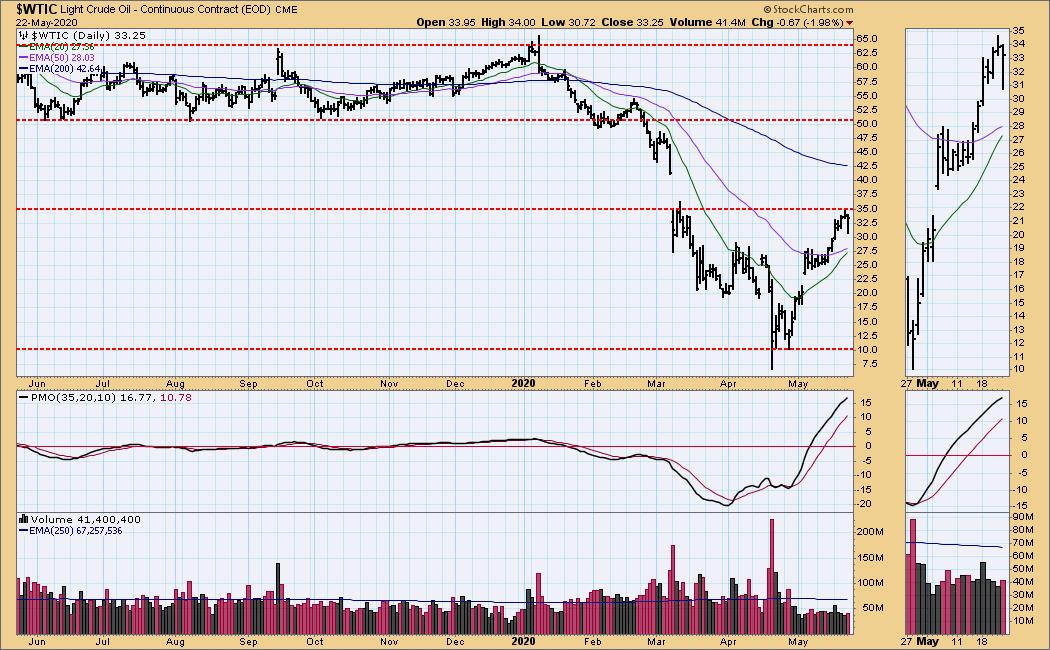
$WTIC Daily Chart: Crude reached the bottom of the March gap and was turned back down.
$WTIC Weekly Chart: The weekly PMO has bounced off an historical low level. Keep in mind that it will work itself back to the zero line even if price settles into an horizontal trading range.
BONDS (TLT)
IT Trend Model: BUY as of 1/22/2020
LT Trend Model: BUY as of 1/2/2019
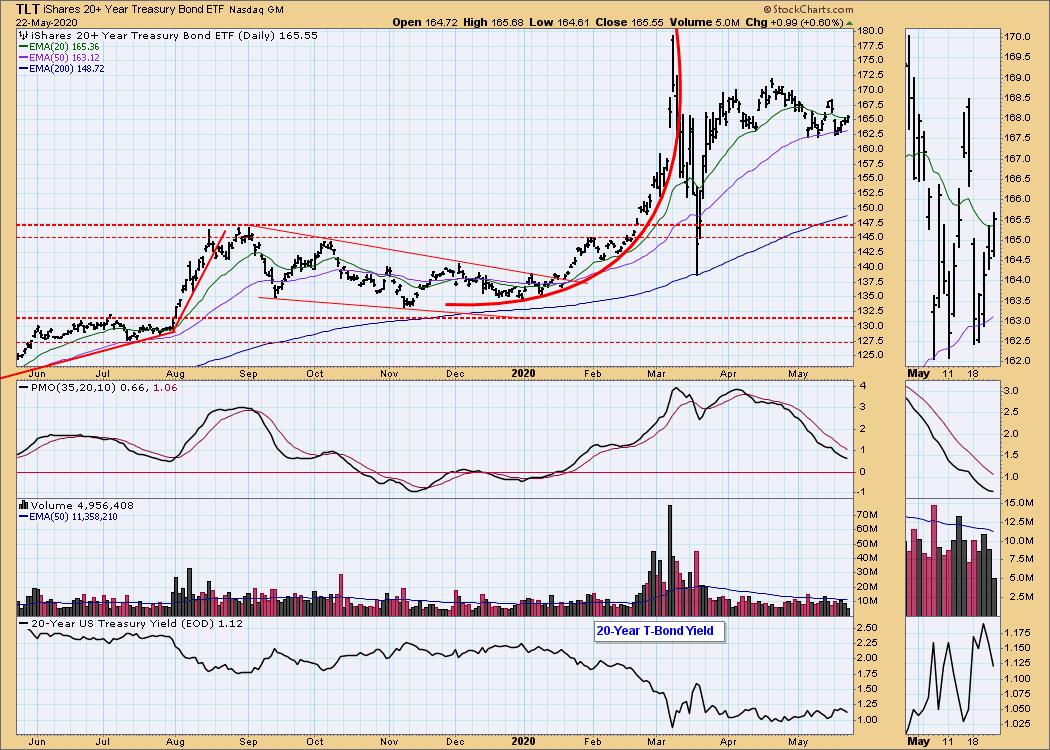
TLT Daily Chart: It is going to take higher interest rates for bonds to move lower, and I don't think that is likely any time soon.
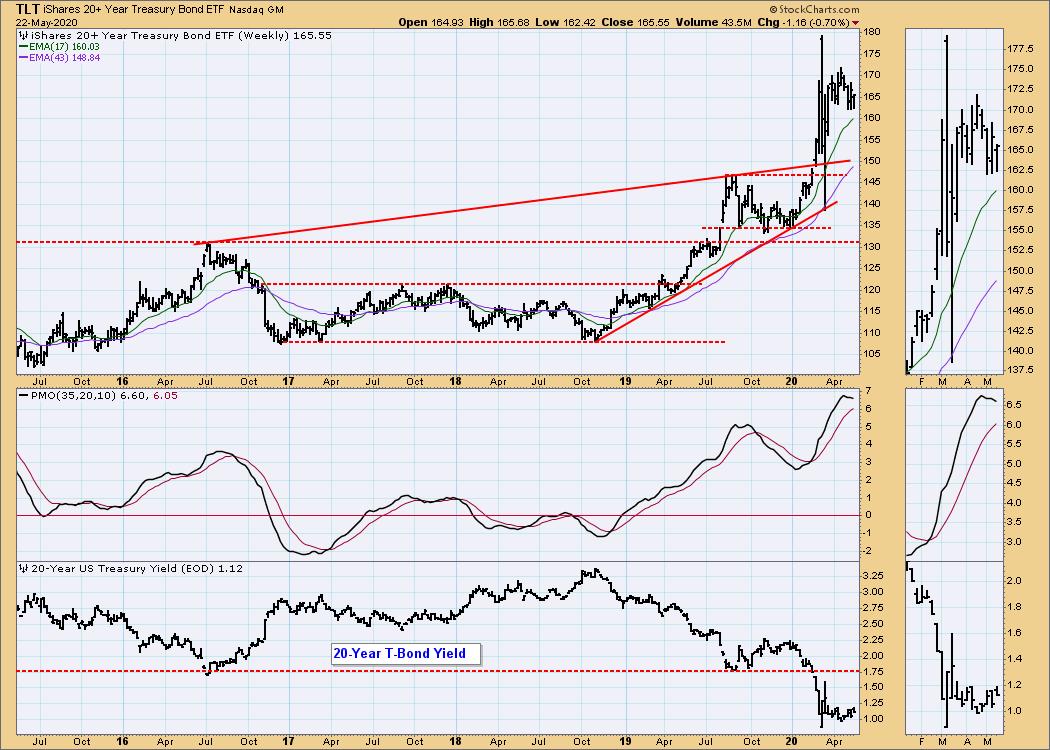
TLT Weekly Chart: The weekly PMO is at the top of the historical range, very overbought, but, as I said above, I don't expect significantly lower bond prices.
Technical Analysis is a windsock, not a crystal ball.
Happy Charting! - Carl
NOTE: The signal status reported herein is based upon mechanical trading model signals, specifically, the DecisionPoint Trend Model. They define the implied bias of the price index based upon moving average relationships, but they do not necessarily call for a specific action. They are information flags that should prompt chart review. Further, they do not call for continuous buying or selling during the life of the signal. For example, a BUY signal will probably (but not necessarily) return the best results if action is taken soon after the signal is generated. Additional opportunities for buying may be found as price zigzags higher, but the trader must look for optimum entry points. Conversely, exit points to preserve gains (or minimize losses) may be evident before the model mechanically closes the signal.
Helpful DecisionPoint Links:
DecisionPoint Alert Chart List
DecisionPoint Golden Cross/Silver Cross Index Chart List
DecisionPoint Sector Chart List
Price Momentum Oscillator (PMO)
Swenlin Trading Oscillators (STO-B and STO-V)