
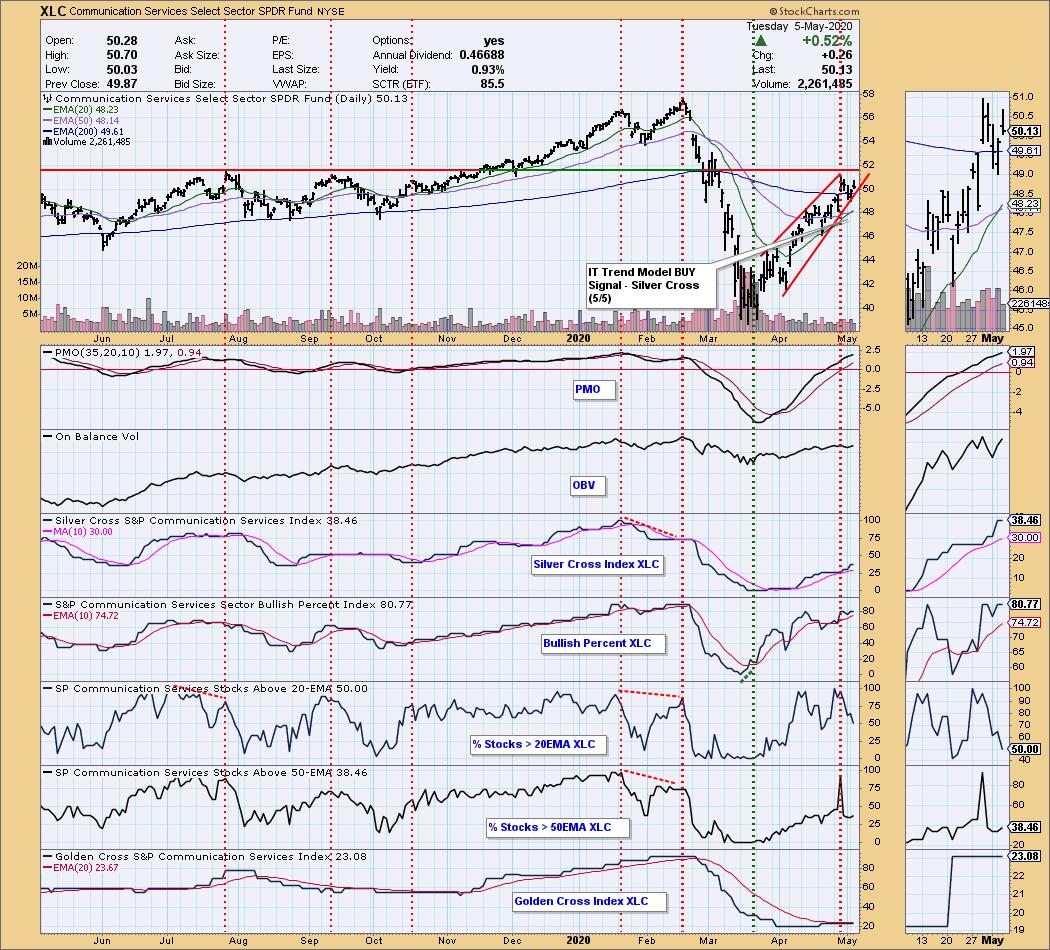
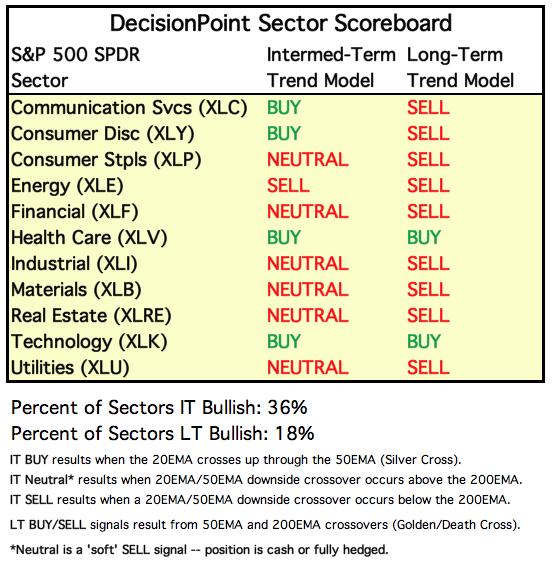
Another green BUY signal was added to the DecisionPoint Sector Scoreboard. XLC joins pals XLK, XLV and XLY with a "Silver Cross" or IT Trend Model BUY signal. It was triggered today as the 20-EMA crossed above the 50-EMA. We're still looking at a bearish rising wedge and a decline in stocks above their 20-EMA. However, the OBV, PMO and other indicators are rising or flat. The line in the sand is the overhead resistance at the July/September 2019 tops. Indicators are somewhat mixed, so it'll be a moment of truth when price hits that resistance level.
Free Live Trading Room - Tuesdays/Thursdays

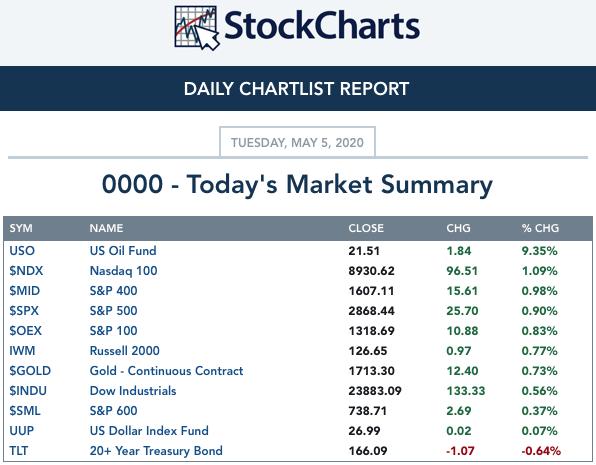
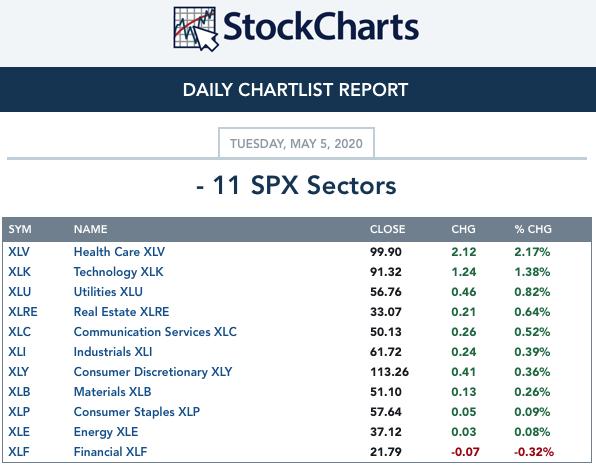
TODAY'S Broad Market Action:
Past WEEK Results: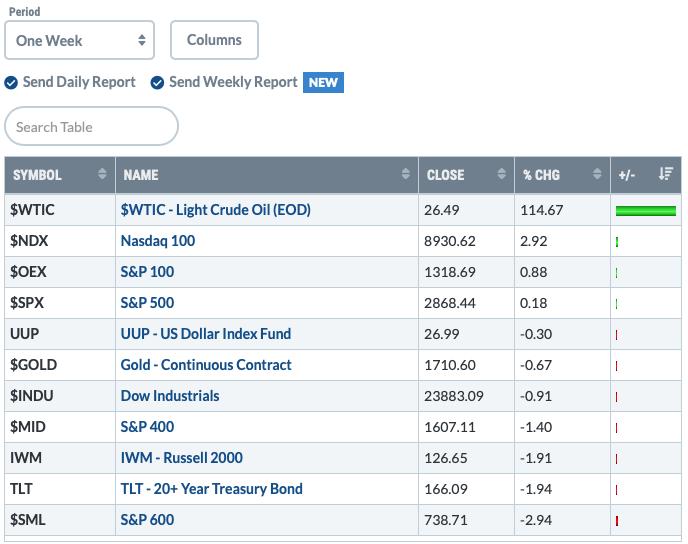
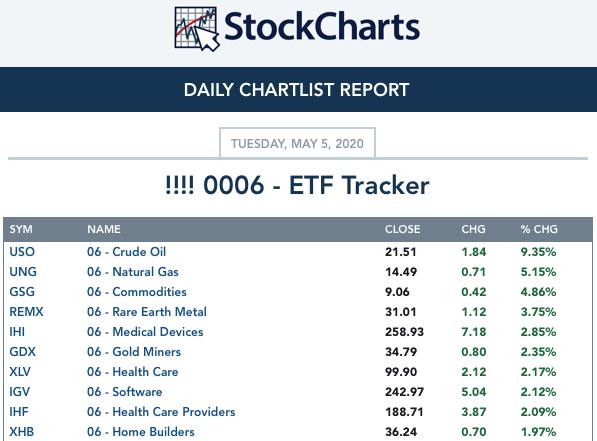
Top 10 from ETF Tracker:
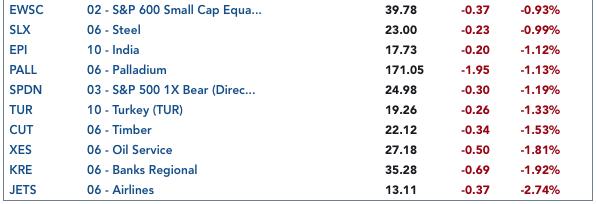
Bottom 10 from ETF Tracker:
On Friday, the DecisionPoint Alert Weekly Wrap presents an assessment of the trend and condition of the stock market (S&P 500), the U.S. Dollar, Gold, Crude Oil, and Bonds. Monday through Thursday the DecisionPoint Alert daily report is abbreviated and covers changes for the day.
Watch the latest episode of DecisionPoint on StockCharts TV's YouTube channel here!
SECTORS
SIGNALS:
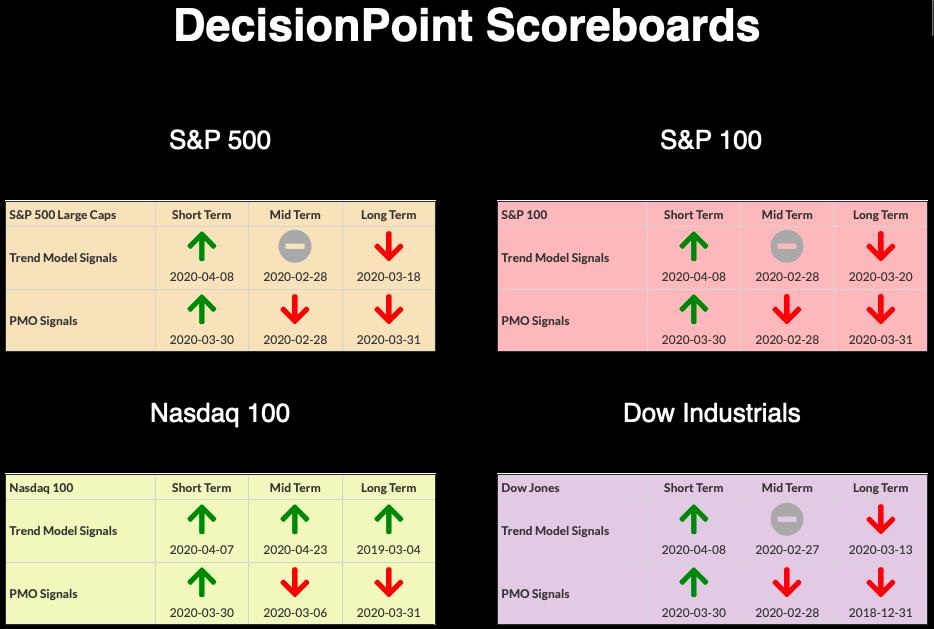
Each S&P 500 Index component stock is assigned to one, and only one, of 11 major sectors. This is a snapshot of the Intermediate-Term (Silver Cross) and Long-Term (Golden Cross) Trend Model signal status for those sectors.
TODAY'S RESULTS:
One WEEK Results: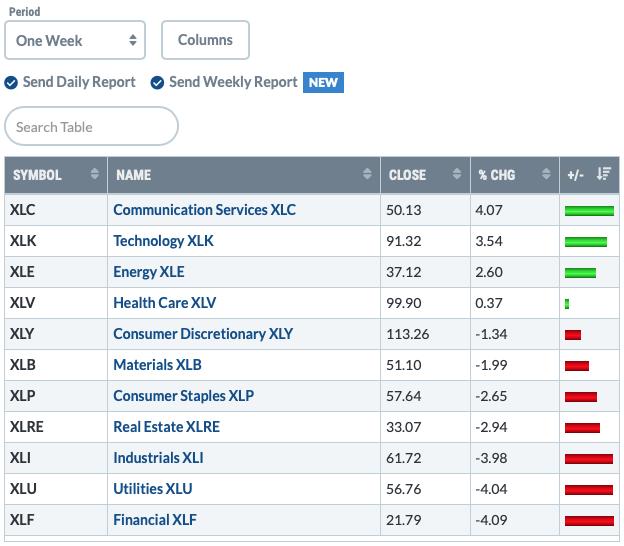
STOCKS
IT Trend Model: NEUTRAL as of 2/28/2020
LT Trend Model: SELL as of 3/19/2020
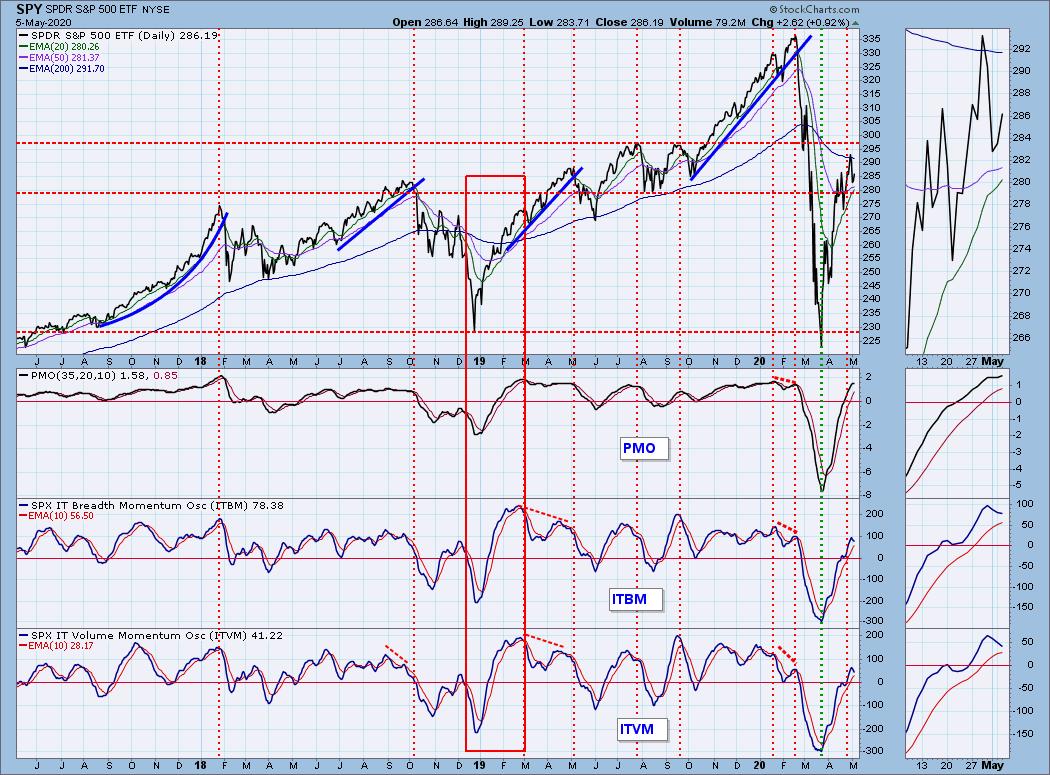
SPY Daily Chart: I let viewers know in this morning's trading room that I was somewhat surprised by the positive open. I only saw a few bullish signs last night while the short-term indicators flashed bearish. The VIX is getting overbought again, but is rising on the inverted scale. The OBV still has the negative divergence with price tops. On a rally of nearly 1%, volume wasn't that impressive (especially on the SPY). The PMO is still rising, barely. It is bullish to see a bounce off the 20-EMA. Price is now being squeezed between the 200-EMA and 20/50-EMAs.
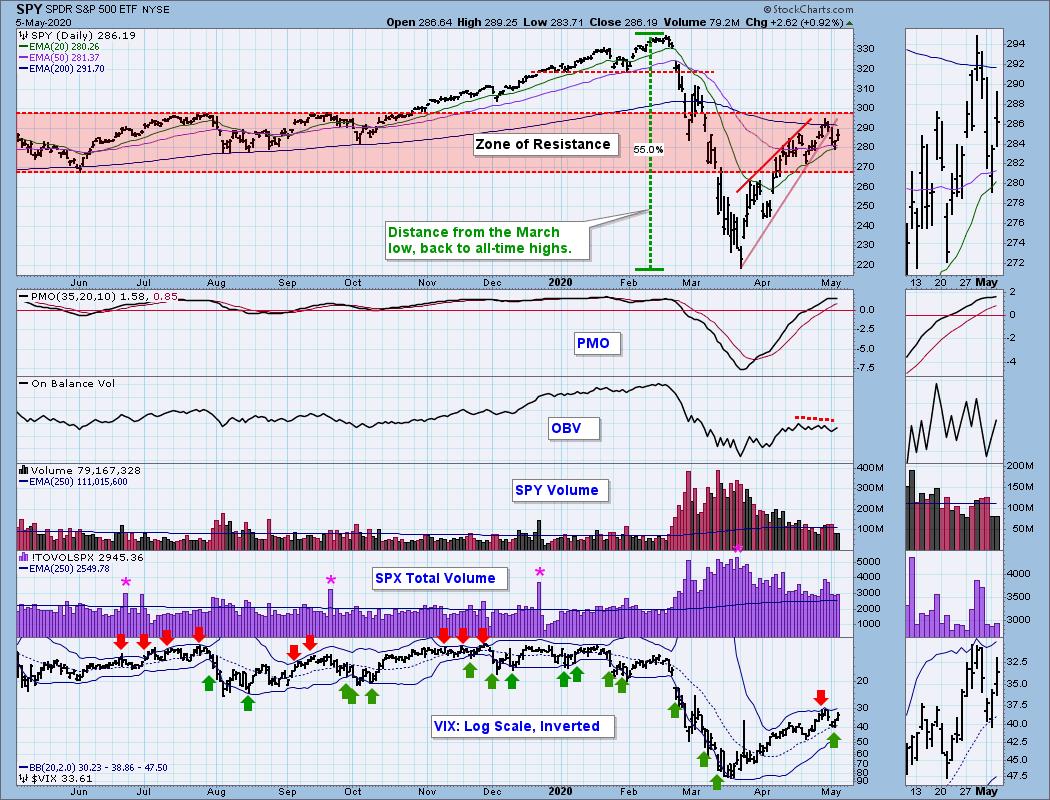
Climactic Market Indicators: Readings aren't climactic. I mentioned the VIX is rising positively. It suggests internal strength in my mind when the VIX turns back up above its average, not having to test the lower Bollinger Band. Unfortunately, the upper Bollinger Band is waiting close by and a penetration generally leads to a decline.
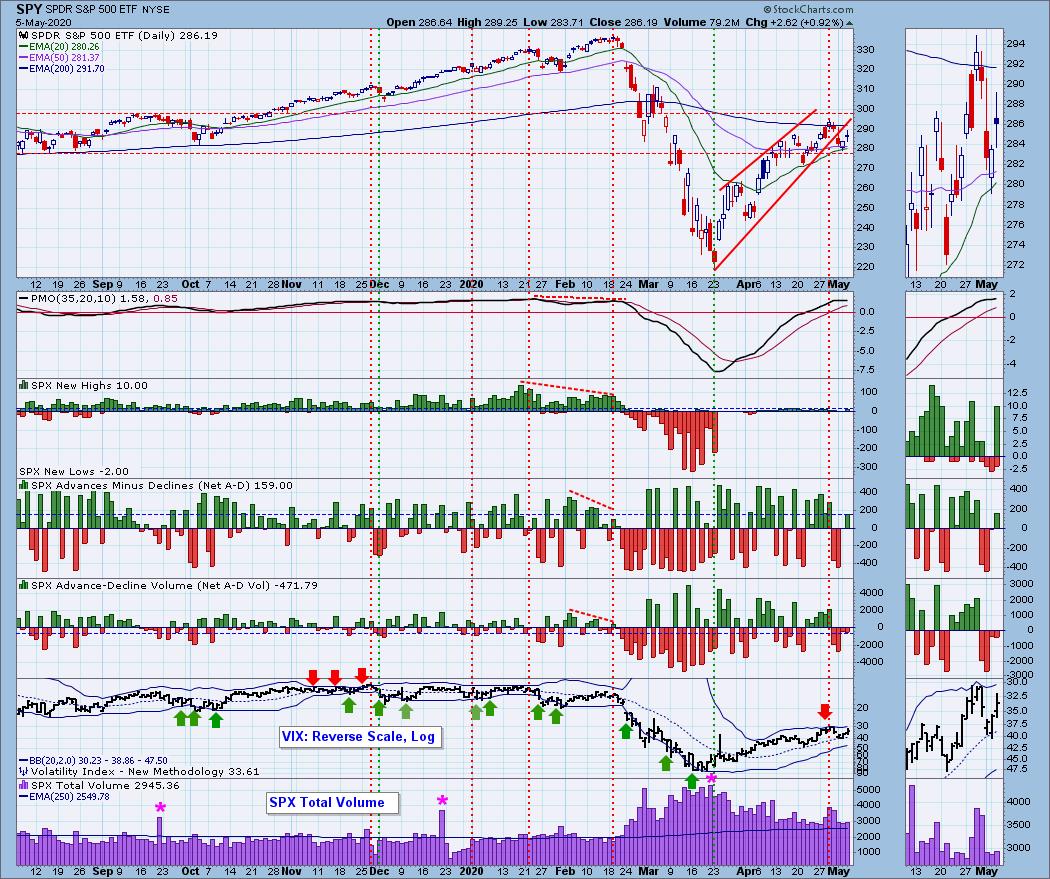
Short-Term Market Indicators: The ST trend is UP and the market condition is NEUTRAL based upon the Swenlin Trading Oscillator (STO) readings. I was a little surprised to see the STOs haven't turned back up. I have to remain bearish in the short term, although there is a little light with Stocks above 20/50-EMAs bottoming and rising.
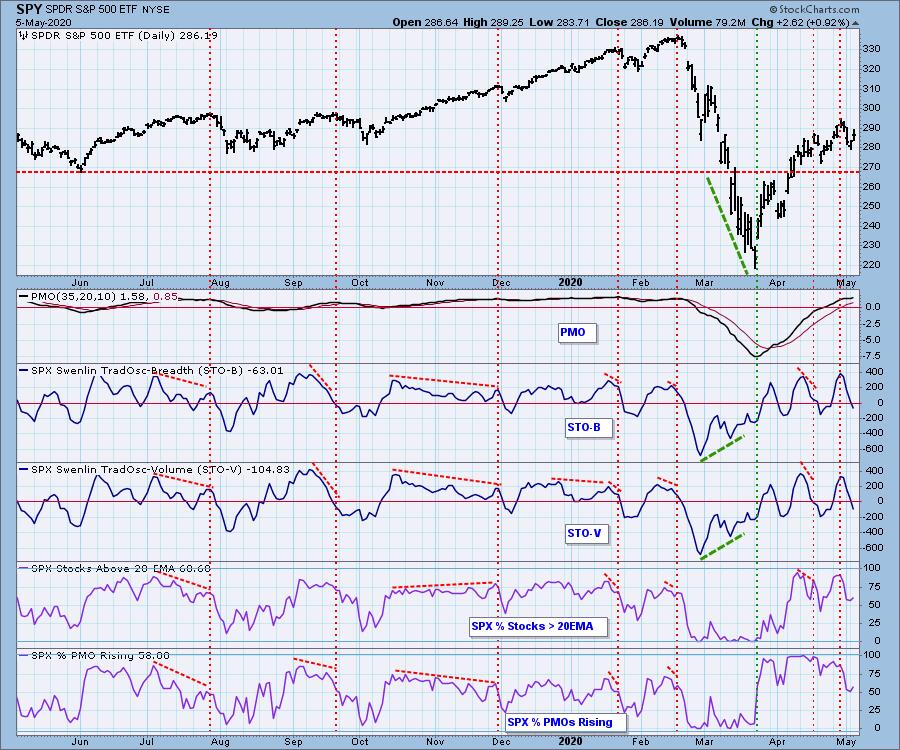
Intermediate-Term Market Indicators: The Silver Cross Index (% of SPX stocks 20EMA > 50EMA) and the Golden Cross Index (percent of SPX stocks 50EMA > 200EMA) are both rising. This chart looks better than yesterday. The SCI is now accelerating higher and the GCI just turned higher. The BPI stopped declining.
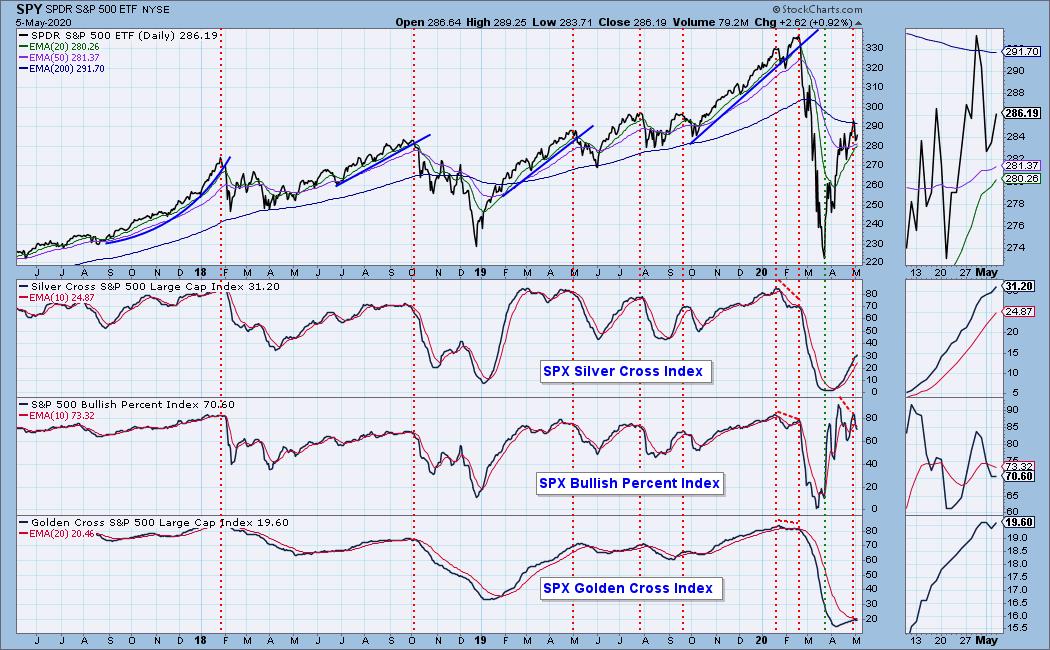
The IT trend is UP and the market condition is NEUTRAL based upon the ITBM and ITVM. Yesterday's comments still apply: "They have now turned down which is bearish, but they haven't had a negative crossover. We saw similar action around April 21 and it didn't pan out. I prefer to wait for the crossovers before I get too bearish."
CONCLUSION: The ST is UP and IT trend is also UP. Market condition based on ST indicators and on IT indicators is NEUTRAL. Indicators are still mixed today. I lean most heavily on the STOs and they didn't turn up on a rally. I would look for lower prices. If we see another rally, I might tighten up some stops so I can lock in some profit and prepare for the decline that the majority of our indicators suggest will arrive.
(Not a Diamonds subscriber? Add it to your DP Alert subscription and get a discount! Contact support@decisionpoint.com for your limited time coupon code!)
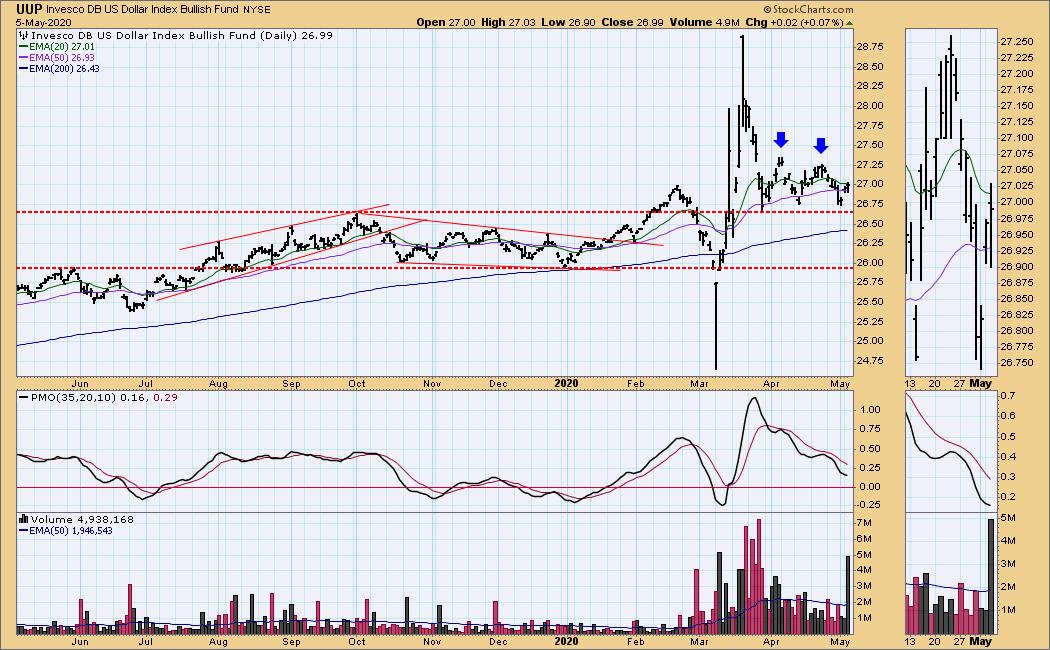
DOLLAR (UUP)
IT Trend Model: BUY as of 3/12/2020
LT Trend Model: BUY as of 5/25/2018
UUP Daily Chart: Price is in a consolidation zone. I still am looking at that bearish double-top, but at this rate we could end up with a bullish triple-bottom. The PMO is still in decline.
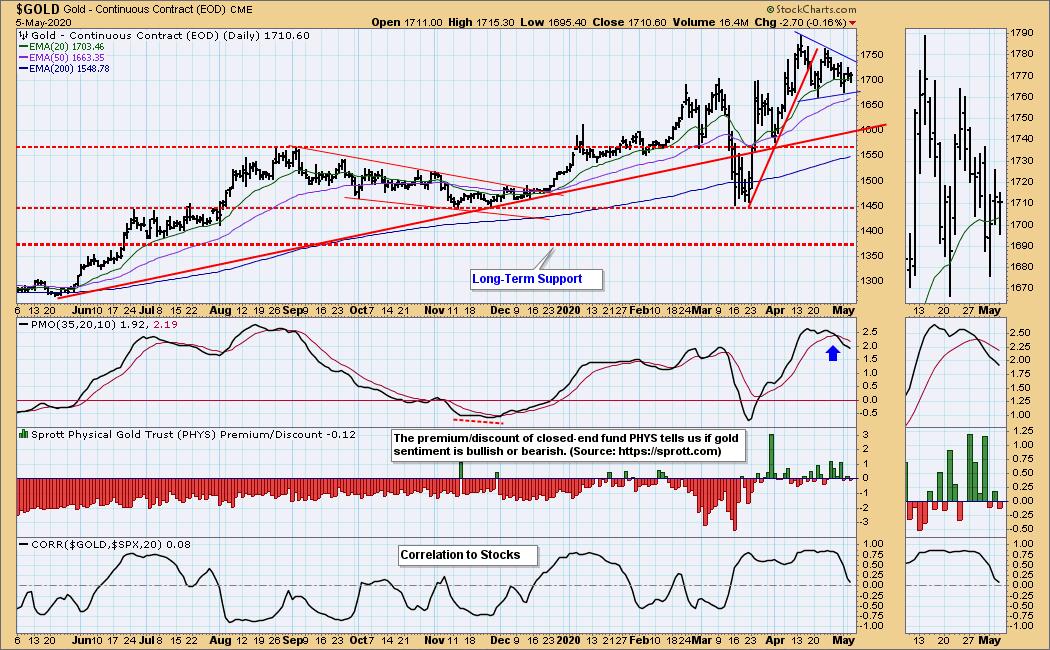
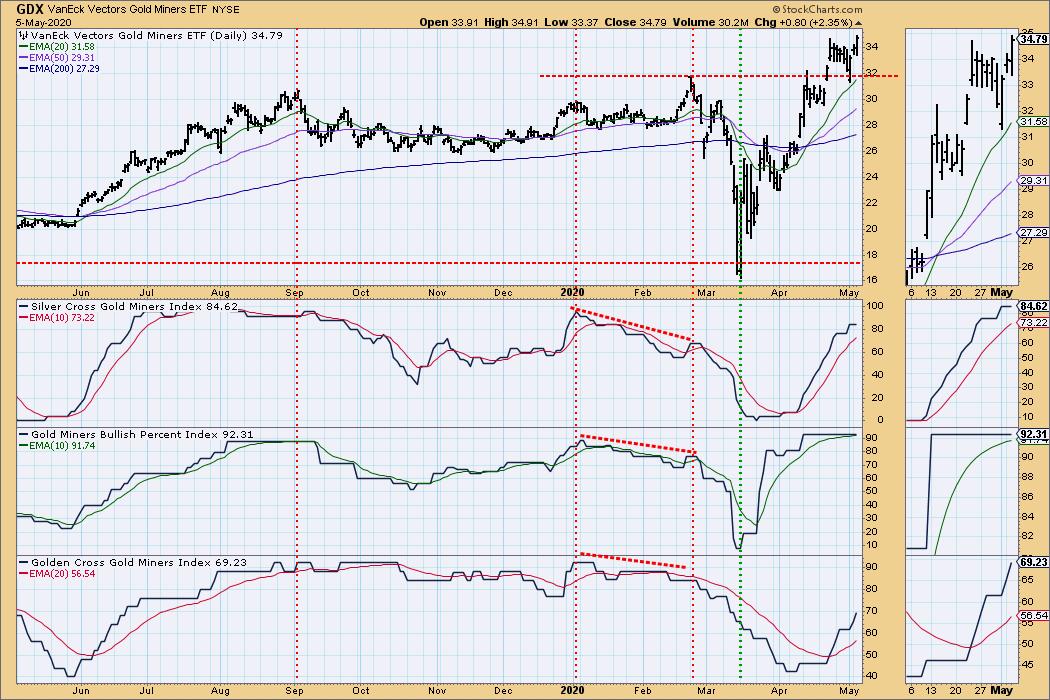
GOLD
IT Trend Model: BUY as of 12/26/2019
LT Trend Model: BUY as of 1/8/2019
GOLD Daily Chart: I noticed that we have a symmetrical triangle or pennant. They're continuation patterns so we should expect an upside breakout. The PMO is decompressing as price forms the pennant, but is still in decline.
GOLD MINERS Golden and Silver Cross Indexes: Miners had a great follow-on rally to yesterday's gap up. This is a great area of the market right now. IT and LT indicators below remain very bullish.
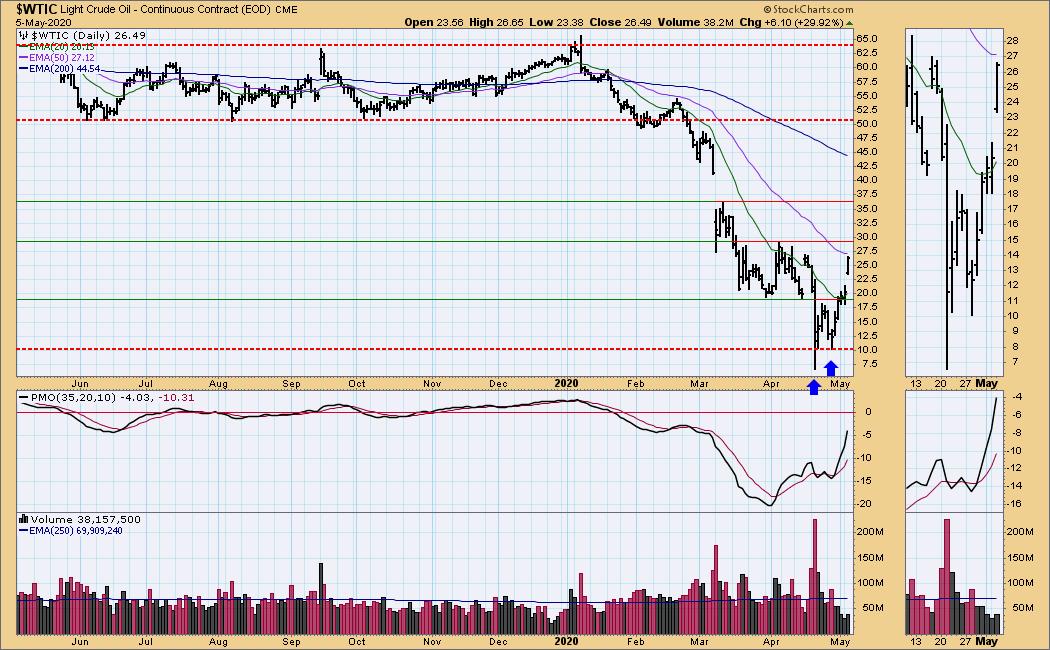
CRUDE OIL ($WTIC)
The oil market is under severe pressure due to a lack of demand, and we do not believe that USO is an appropriate investment vehicle at this time. Until further notice we will use $WTIC to track the oil market. Since this is a continuous contract dataset, it doesn't "play well" with our Trend Models, and we will not report Trend Model signals for oil.
$WTIC Daily Chart: Looks like Oil is ready to make a comeback. With the reopening of America, supply and demand issues may start to clear a little bit and I suspect that is what investors are considering. This was a forceful gap up and the PMO is accelerating quickly. Overhead resistance is very close at about $30 and could be the first stumbling block. If you look in the thumbnail, volume is in a declining trend on this rally. I would beware of a buying exhaustion and island reversal.
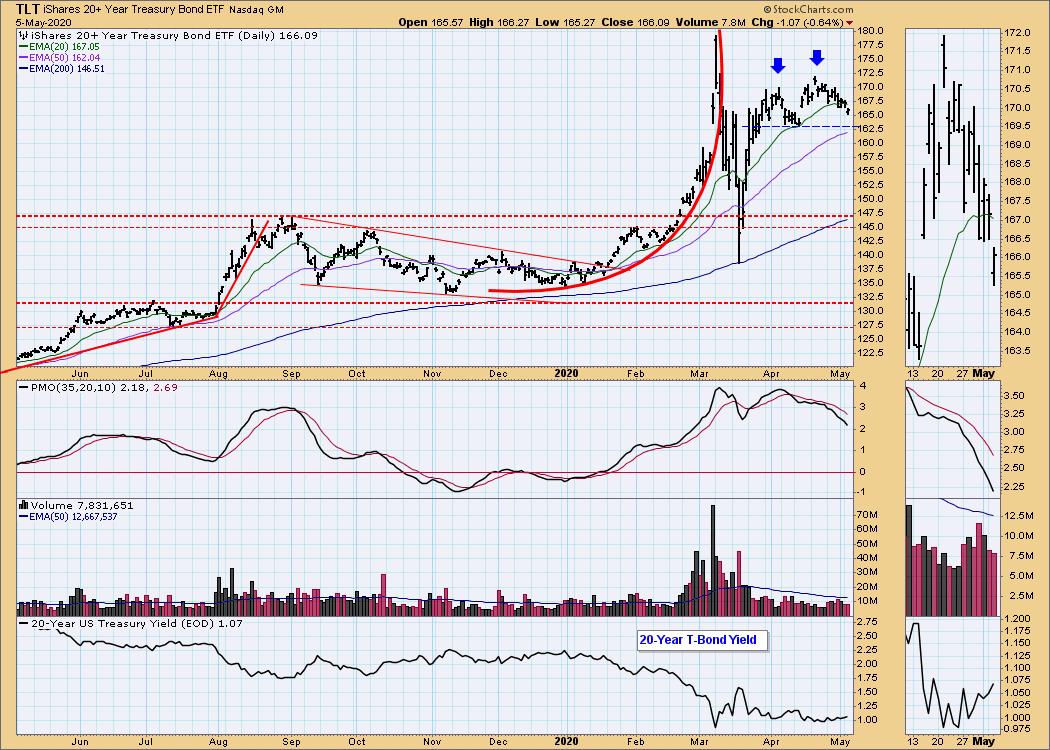
BONDS (TLT)
IT Trend Model: BUY as of 1/22/2020
LT Trend Model: BUY as of 1/2/2019
TLT Daily Chart: Yesterday's comments still apply: "A bearish double-top is still in play, price is just taking its time to arrive at the confirmation line. The PMO in decline suggests price will at least test it."
Have you subscribed the DecisionPoint Diamonds yet? DP does the work for you by providing handpicked stocks/ETFs from exclusive DP scans! Add it with a discount! Contact support@decisionpoint.com for more information!
Technical Analysis is a windsock, not a crystal ball.
Happy Charting! - Erin
Email: erin@decisionpoint.com

Erin Swenlin will be presenting at the The MoneyShow Las Vegas August 16 - 20 at Bally's/Paris Resort! You'll have an opportunity to meet Erin and discuss the latest DecisionPoint news and Diamond Scans. Claim your FREE pass here! You can watch online with this pass too!! There will be online events held in May and when I have more information I'll let you know.
NOTE: The signal status reported herein is based upon mechanical trading model signals, specifically, the DecisionPoint Trend Model. They define the implied bias of the price index based upon moving average relationships, but they do not necessarily call for a specific action. They are information flags that should prompt chart review. Further, they do not call for continuous buying or selling during the life of the signal. For example, a BUY signal will probably (but not necessarily) return the best results if action is taken soon after the signal is generated. Additional opportunities for buying may be found as price zigzags higher, but the trader must look for optimum entry points. Conversely, exit points to preserve gains (or minimize losses) may be evident before the model mechanically closes the signal.
Helpful DecisionPoint Links (Can Be Found on DecisionPoint.com Links Page):
DecisionPoint Shared ChartList and DecisionPoint Chart Gallery
Price Momentum Oscillator (PMO)
Swenlin Trading Oscillators (STO-B and STO-V)