
Watching the market today I was brought back to when my girls were toddlers. What I had asked them to do was for their own good (eating vegetables, taking medicine...) and they had no interest in complying. The common reply was "but, I don't want to!" Unfortunately I can't put the market in time out, tell it "because I said so" or force it to eat its vegetables. All of our indicators flashed bearish yesterday, so the open made complete sense to me. The follow-on rally shows us market participants continue to look across the valley to the other side where America is open and all is well with the world, while at the same time ignoring the gaping canyon that has to be crossed to get there. Despite the push forward at the end of the day, price didn't manage to get back in the rising trend channel and it certainly didn't negate the double-top pattern which is still prominent.
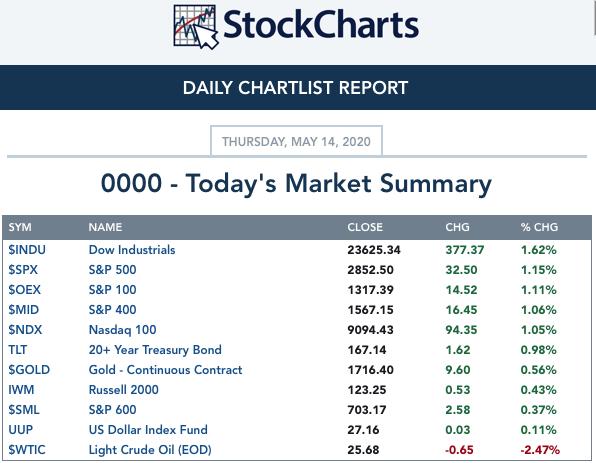
TODAY'S Broad Market Action:
Past WEEK Results: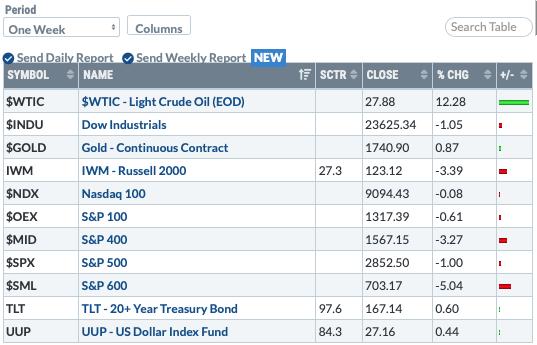
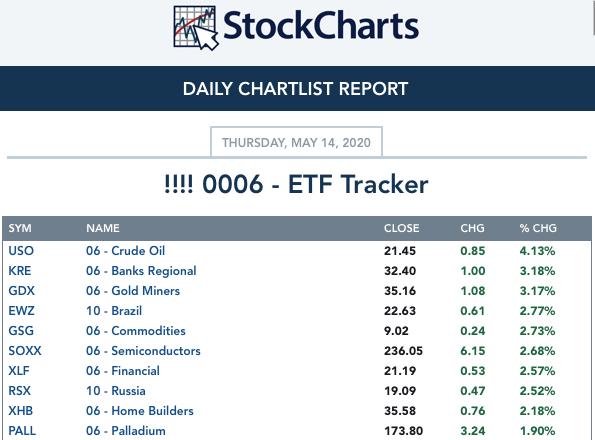
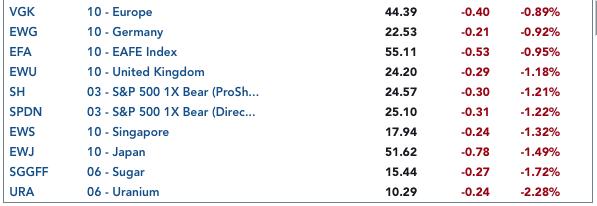
Top 10 from ETF Tracker:
Bottom 10 from ETF Tracker:
On Friday, the DecisionPoint Alert Weekly Wrap presents an assessment of the trend and condition of the stock market (S&P 500), the U.S. Dollar, Gold, Crude Oil, and Bonds. Monday through Thursday the DecisionPoint Alert daily report is abbreviated and covers changes for the day.
Watch the latest episode of DecisionPoint on StockCharts TV's YouTube channel here!
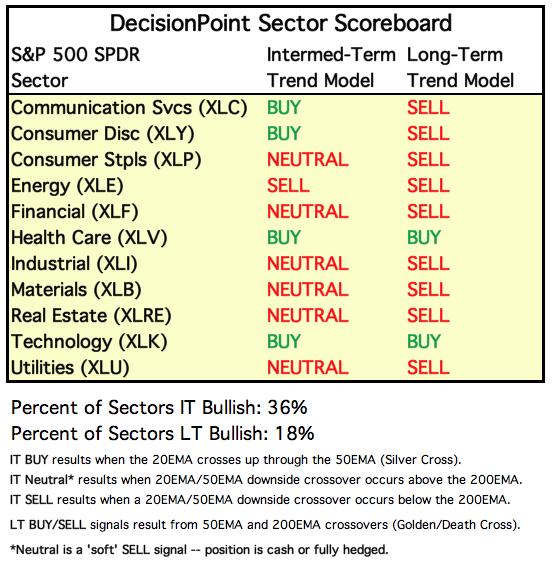
SECTORS
SIGNALS:
Each S&P 500 Index component stock is assigned to one, and only one, of 11 major sectors. This is a snapshot of the Intermediate-Term (Silver Cross) and Long-Term (Golden Cross) Trend Model signal status for those sectors.
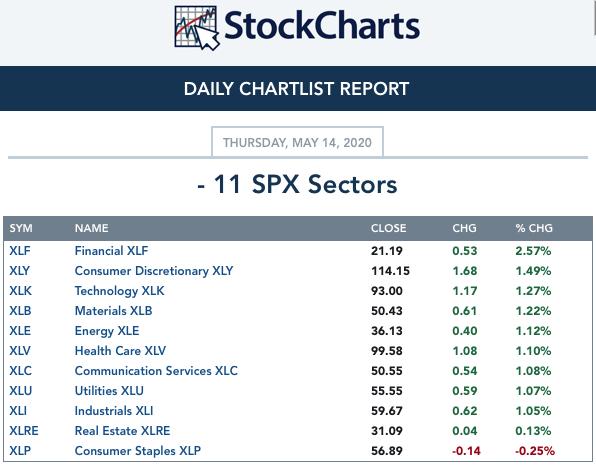
TODAY'S RESULTS:
One WEEK Results: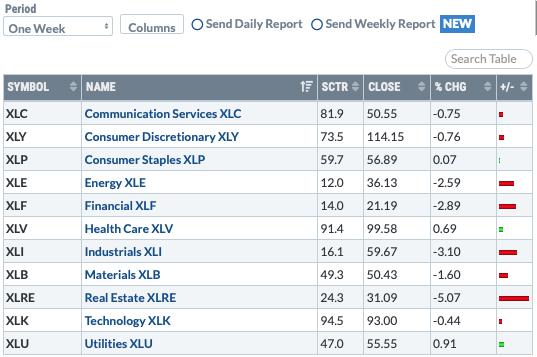
STOCKS
IT Trend Model: BUY as of 5/8/2020
LT Trend Model: SELL as of 3/19/2020
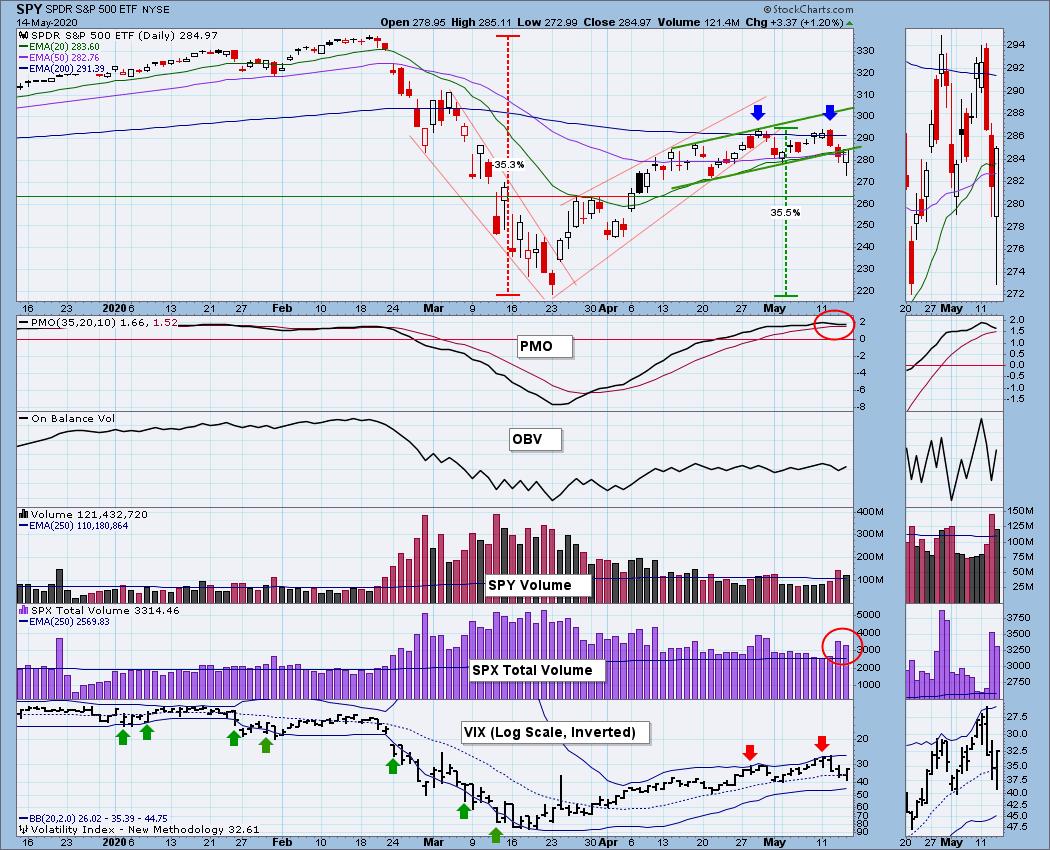
SPY Daily Chart: The PMO is still in decline (first time since before the bear market low). The OBV is flat and I do note that it has rising bottoms as price is making lower lows. That's a positive divergence. At the same time, the double-top is still viable and has technically executed today. Volume was slightly lower and on a positive close with a rally like we saw, I would have wanted to see more.
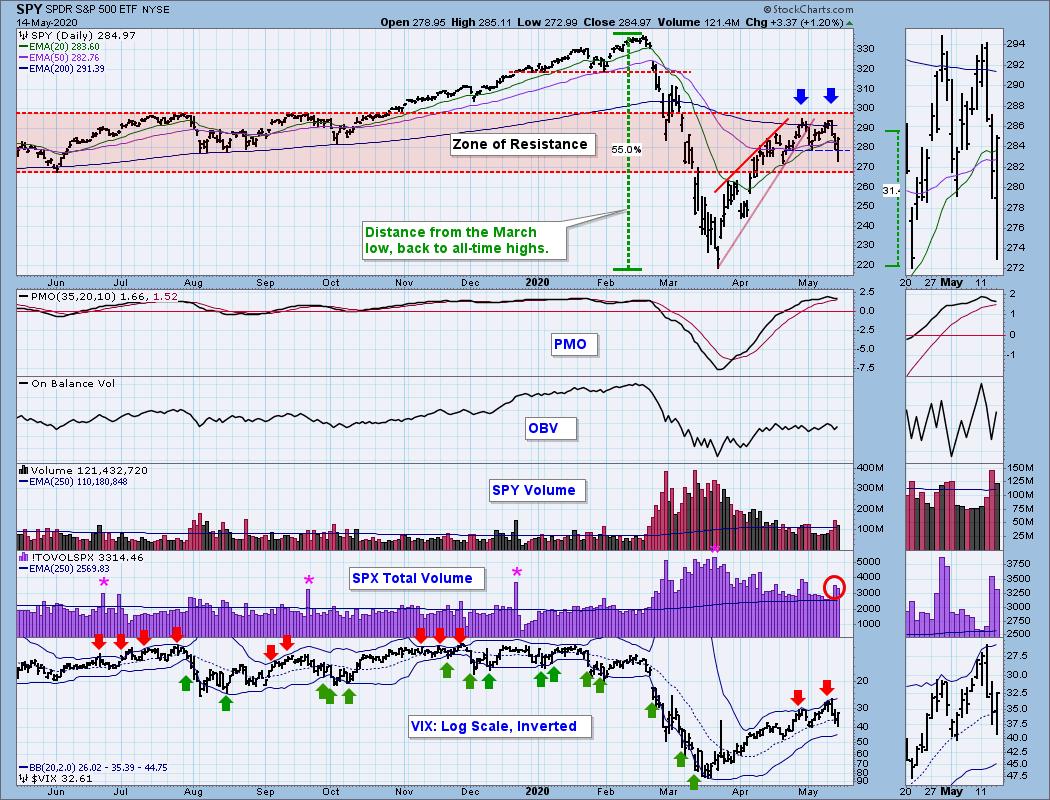
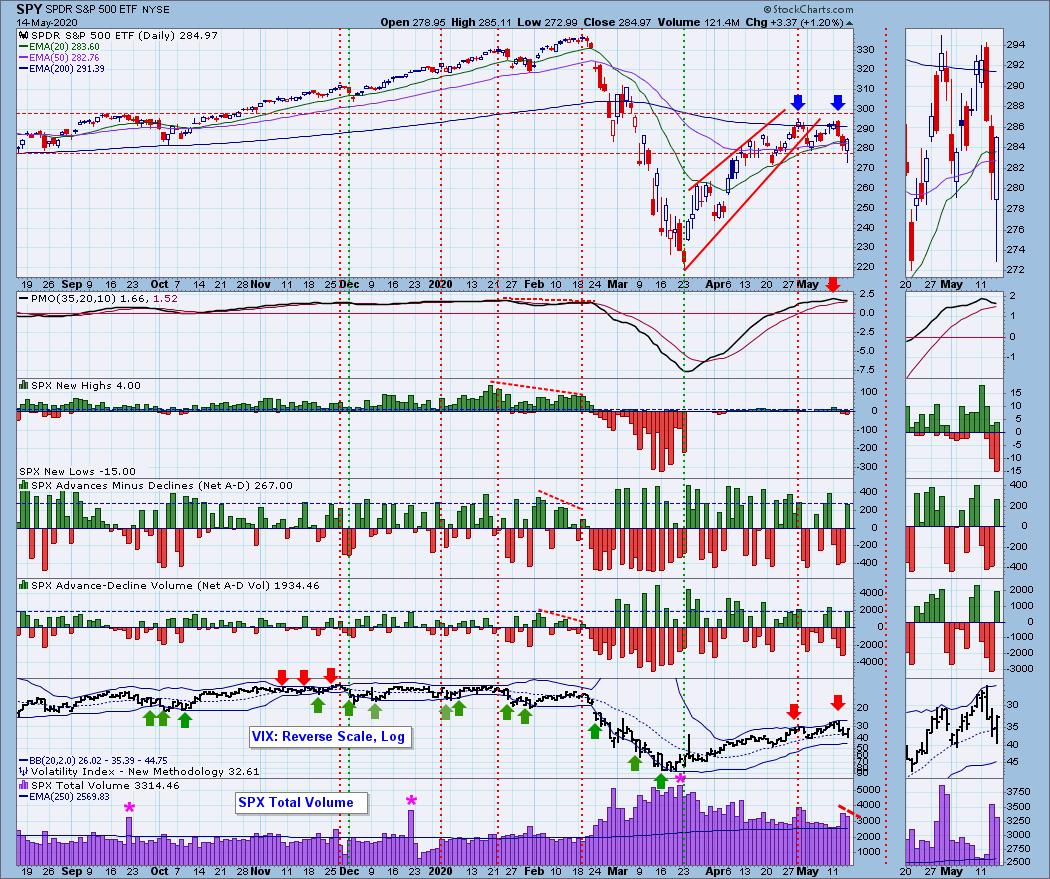
Climactic Market Indicators: Indicators were climactic to the positive side today. I would look at this as a buying exhaustion not an initiation to higher prices. Remember price was unable to get back into the rising trend and it executed a bearish double-top. This isn't really the time to look for higher prices. The VIX moved below its average on the inverted scale and if that "fear factor" is moving lower within those bands, that typically accompanies price declines.
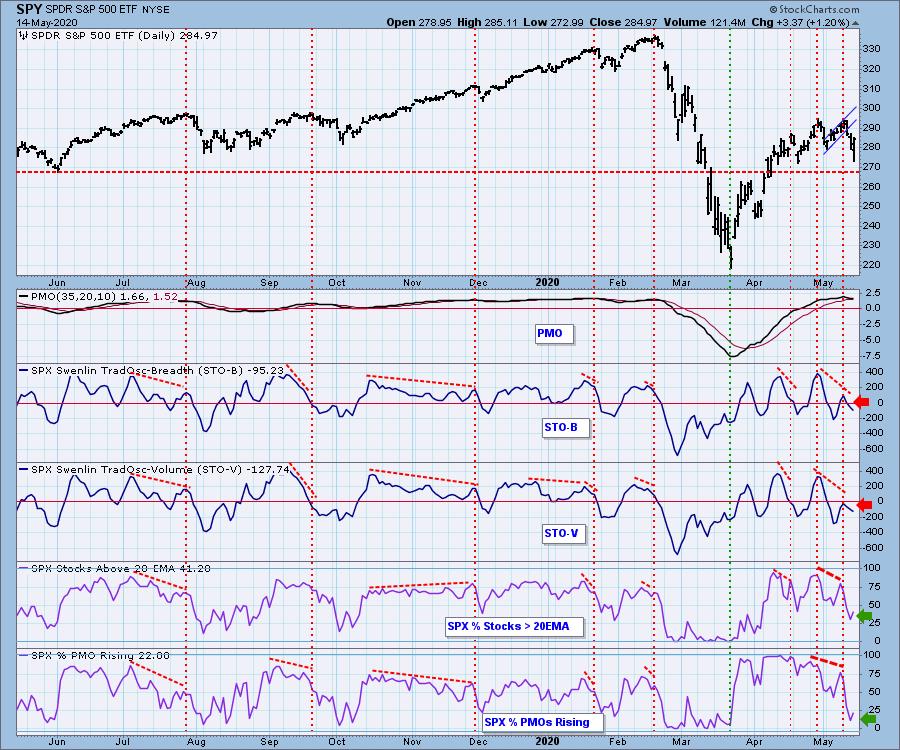
Short-Term Market Indicators: The ST trend is DOWN and the market condition is NEUTRAL based upon the Swenlin Trading Oscillator (STO) readings. The STOs are confirming the decline. We did see a tick up on the %Stocks indicators which could mean a continuation of the end of day rally, but I don't think it is enough to fuel a new up leg.
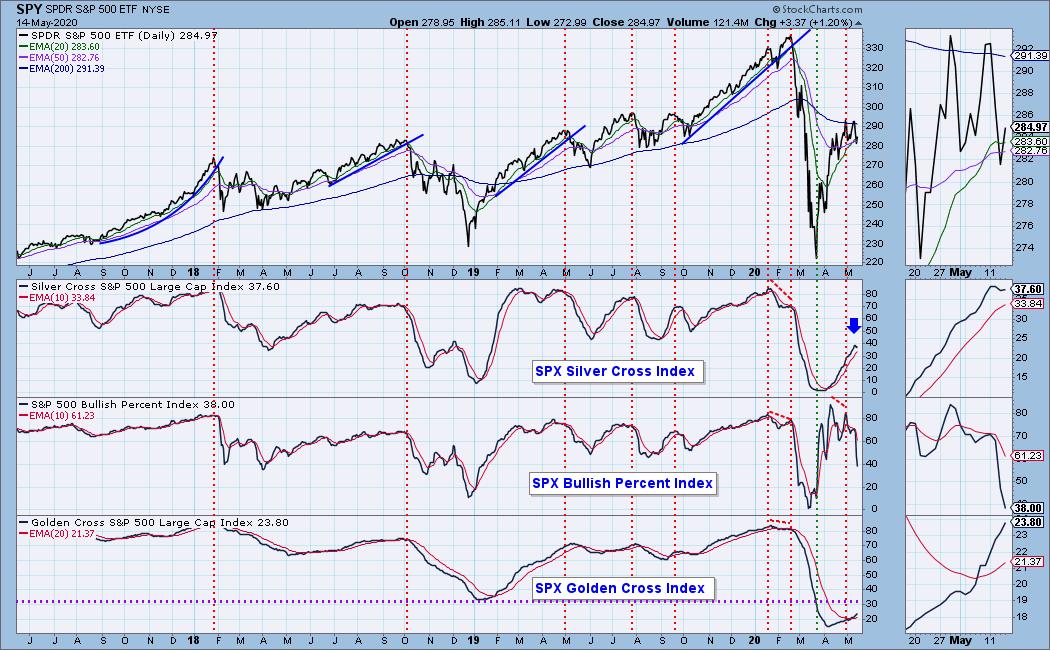
Intermediate-Term Market Indicators: The Silver Cross Index (% of SPX stocks 20EMA > 50EMA) and the Golden Cross Index (percent of SPX stocks 50EMA > 200EMA) are rising. The SCI had topped yesterday, but it has turned up slightly. The most important item on this chart is the declining BPI which is falling fast.

Remember DecisionPoint Bundle Subscribers Get the
LIVE Trading Room for FREE ($49.95 value)!
The IT trend is UP and the market condition is NEUTRAL based upon the ITBM and ITVM. Declining tops on the ITBM and ITVM confirm this breakdown. They continue lower which is also bearish.
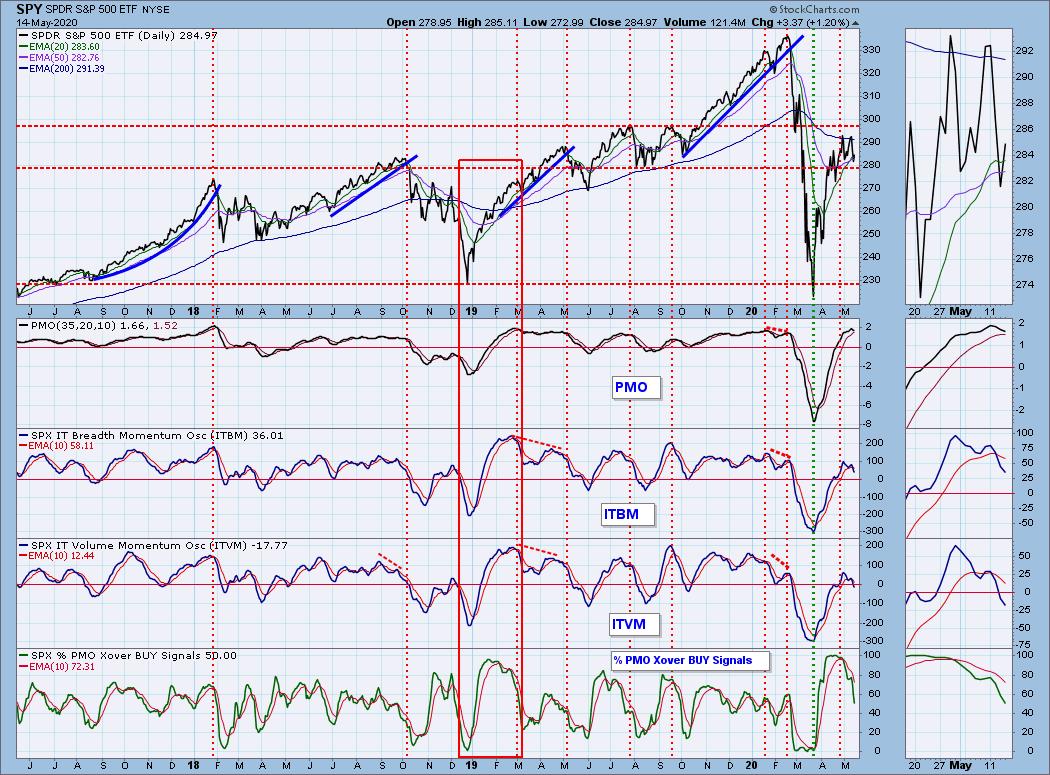
CONCLUSION: The ST trend is DOWN and IT trend is UP (barely). Market condition based on ST indicators and IT indicators is NEUTRAL. The market is obstinately trying to prevent the decline the economic environment is calling for. I remain short-term bearish (I adjusted all of my stops today) and am reconsidering price targets in order to lock in some profit. If we see a continuation of today's end of day rally, I'd look at it as a blow off.
DOLLAR (UUP)
IT Trend Model: BUY as of 3/12/2020
LT Trend Model: BUY as of 5/25/2018
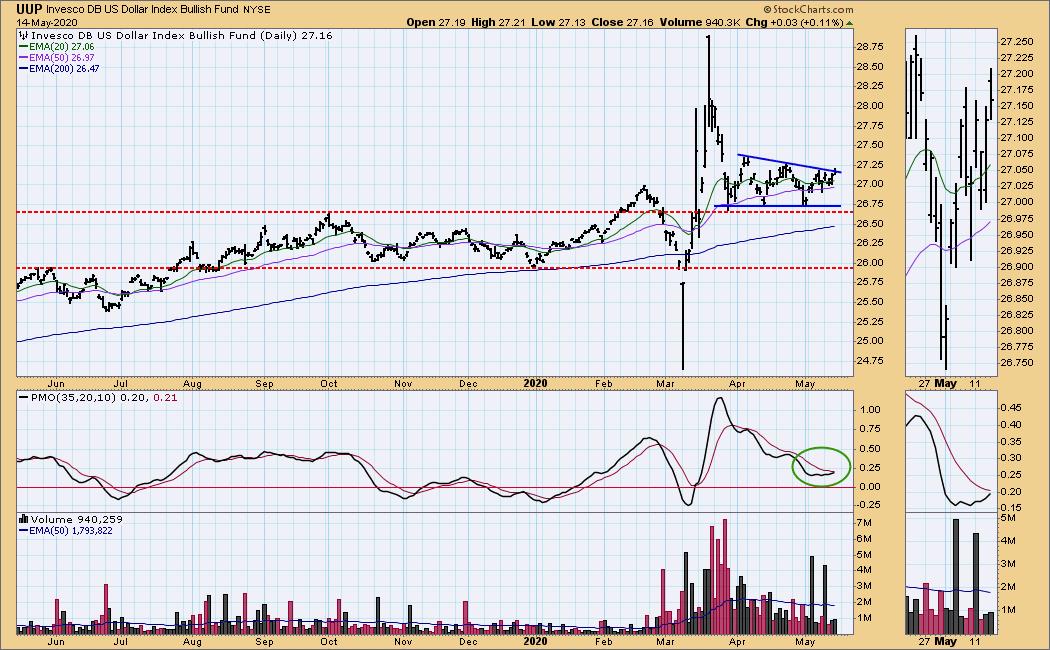
UUP Daily Chart: Using the same logic as with the rising trend channel example I gave above, notice that price didn't test the bottom of the bearish descending triangle before heading back up. That's a bullish sign. The PMO has turned up as well. The declining tops trendline was broken. If this bearish descending triangle resolves upward, I would find that especially bullish. I'll need to see price trade completely above that declining trend before I would consider this bearish formation busted.
GOLD
IT Trend Model: BUY as of 12/26/2019
LT Trend Model: BUY as of 1/8/2019
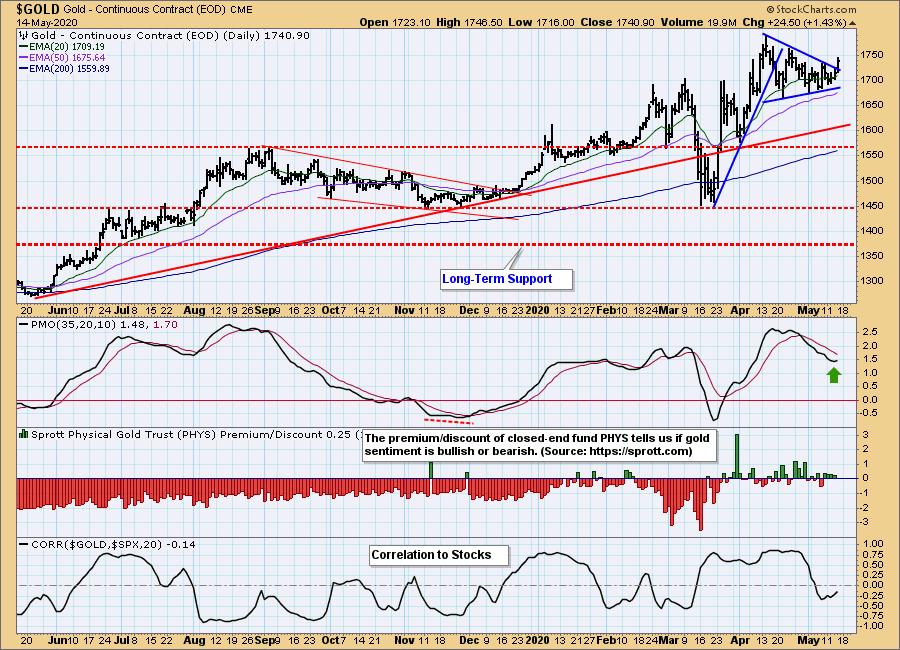
GOLD Daily Chart: We finally saw the upside breakout we've been looking for. The PMO has now turned up. There is interest in Gold based on investors willing to pay a premium for PHYS.
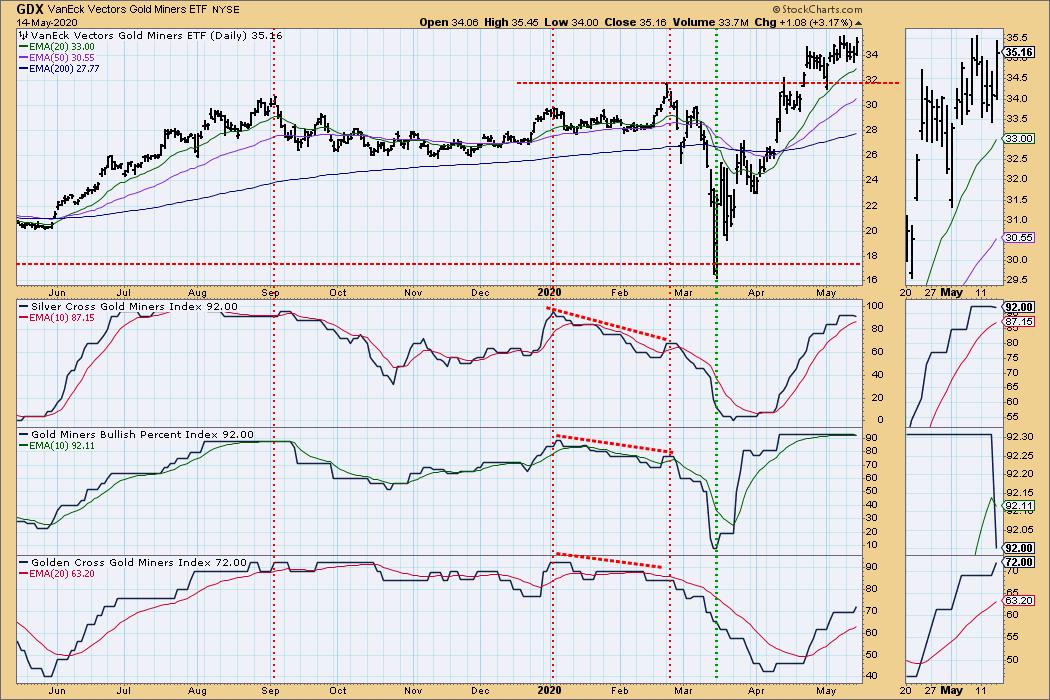
GOLD MINERS Golden and Silver Cross Indexes: The Miners continue to outperform and with Gold breaking out, I suspect Miners will too. You should be aware though that Miners don't always walk hand in hand with Gold. They are companies and while their business is about gold, it is still a business and that makes it subject to more than just the price of Gold.
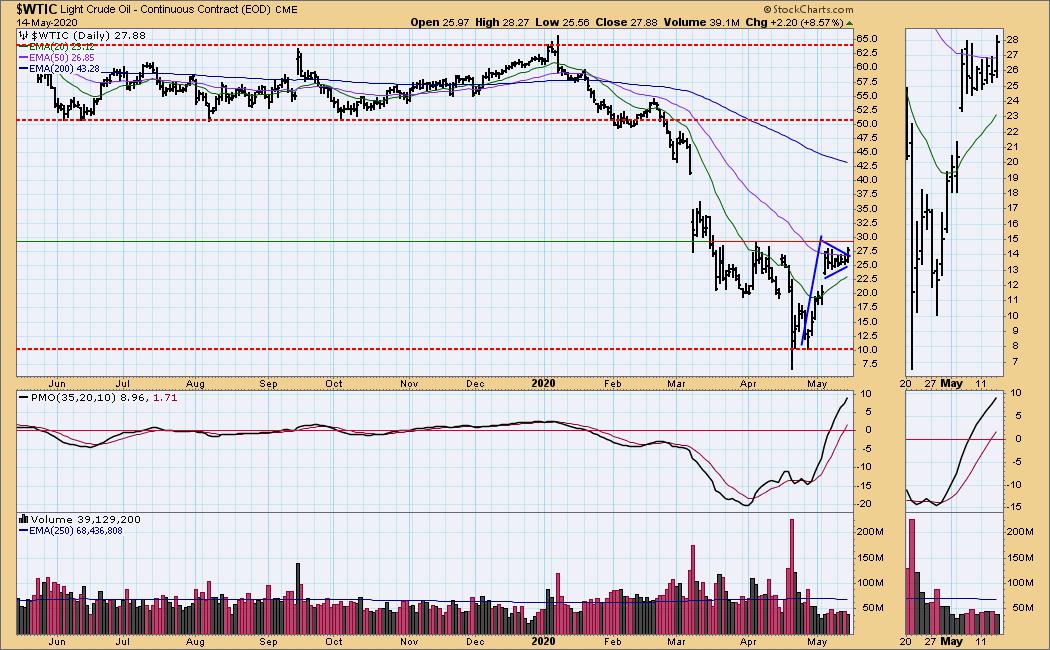
CRUDE OIL ($WTIC)
The oil market is under severe pressure due to a lack of demand, and we do not believe that USO is an appropriate investment vehicle at this time. Until further notice we will use $WTIC to track the oil market. Since this is a continuous contract dataset, it doesn't "play well" with our Trend Models, and we will not report Trend Model signals for oil.
$WTIC Daily Chart: Oil broke out of its symmetrical triangle just like Gold. There is heavy resistance for price at the April top.
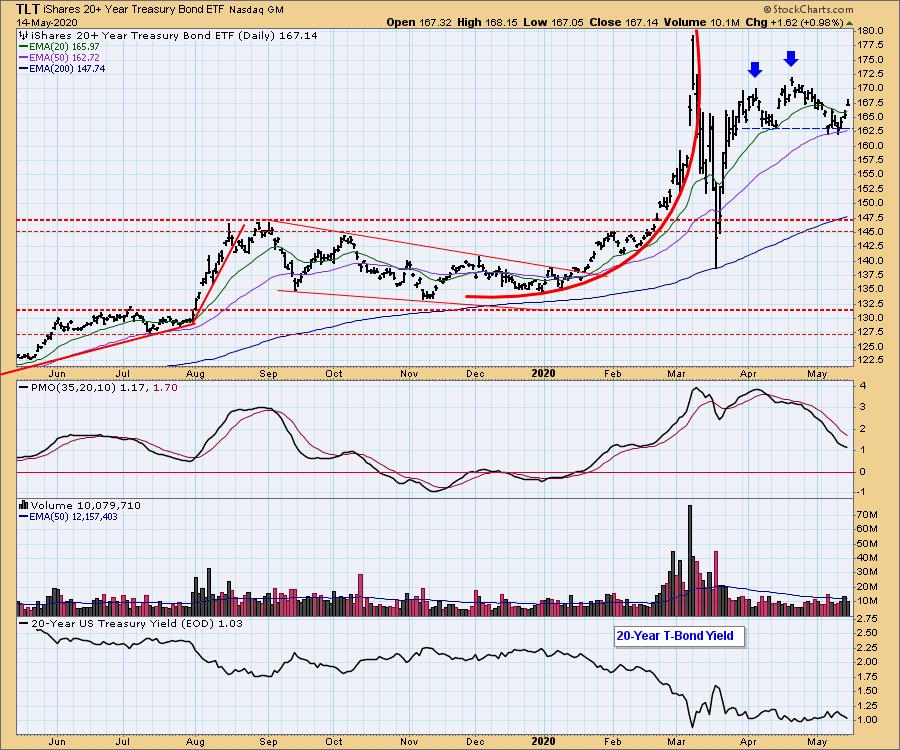
BONDS (TLT)
IT Trend Model: BUY as of 1/22/2020
LT Trend Model: BUY as of 1/2/2019
TLT Daily Chart: Well, TLT has decided that we do not have a double-top. I will keep it annotated however. Today's bar/candlestick was a bearish "shooting star" that suggests this is an island reversal in the making.
Have you subscribed the DecisionPoint Diamonds yet? DP does the work for you by providing handpicked stocks/ETFs from exclusive DP scans! Add it with a discount AND get the LIVE Trading Room for free! Contact support@decisionpoint.com for more information!
Technical Analysis is a windsock, not a crystal ball.
Happy Charting! - Erin
Email: erin@decisionpoint.com

Erin Swenlin will be presenting at the The MoneyShow Las Vegas August 16 - 20 at Bally's/Paris Resort! You'll have an opportunity to meet Erin and discuss the latest DecisionPoint news and Diamond Scans. Claim your FREE pass here! You can watch online with this pass too!! There will be online events held in May and when I have more information I'll let you know.
NOTE: The signal status reported herein is based upon mechanical trading model signals, specifically, the DecisionPoint Trend Model. They define the implied bias of the price index based upon moving average relationships, but they do not necessarily call for a specific action. They are information flags that should prompt chart review. Further, they do not call for continuous buying or selling during the life of the signal. For example, a BUY signal will probably (but not necessarily) return the best results if action is taken soon after the signal is generated. Additional opportunities for buying may be found as price zigzags higher, but the trader must look for optimum entry points. Conversely, exit points to preserve gains (or minimize losses) may be evident before the model mechanically closes the signal.
Helpful DecisionPoint Links (Can Be Found on DecisionPoint.com Links Page):
DecisionPoint Shared ChartList and DecisionPoint Chart Gallery
Price Momentum Oscillator (PMO)
Swenlin Trading Oscillators (STO-B and STO-V)