
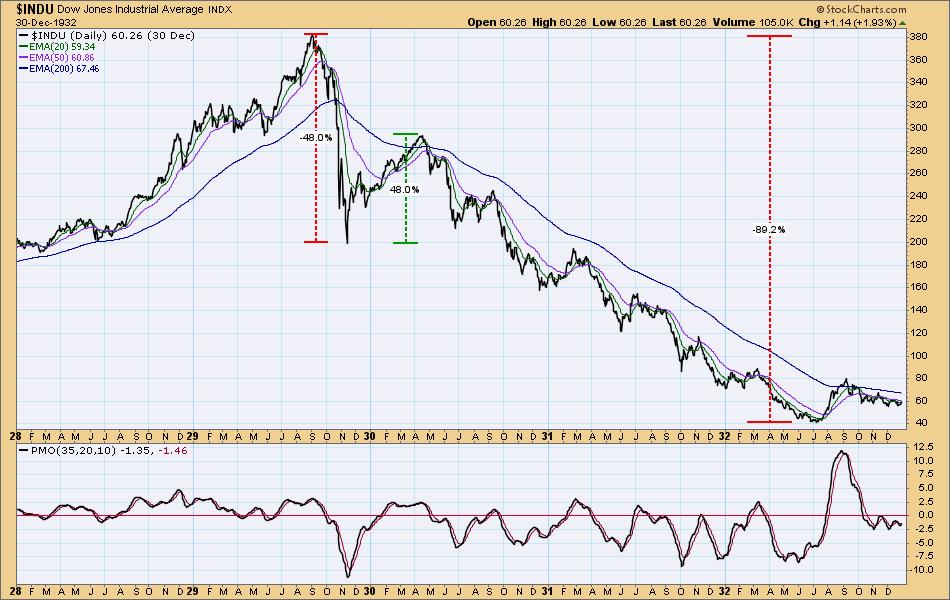
Over the years I have frequently dragged out the chart of the 1929 Crash and 1929-32 Bear Market to illustrate various points, but mostly to emphasize how bad the market can be. While I don't consider this to be a model of what is going to happen, it offers possibilities we should consider. As I have said before, I'm a guy who tends to see the glass half-empty and the remaining water evaporating, so I need to remind myself to periodically take stock and consider positive alternatives. On the chart below we can see from the September 1929 top the market declined -48% into a November low, and from there it rallied +48%. In the midst of all our present misery, maybe we should have an open mind for such a rally visitation. After our indicator review, we'll discuss it in the CONCLUSION section below.
The DecisionPoint Alert Weekly Wrap presents an end-of-week assessment of the trend and condition of the Stock Market, the U.S. Dollar, Gold, Crude Oil, and Bonds. The DecisionPoint Alert daily report (Monday through Thursday) is abbreviated and gives updates on the Weekly Wrap assessments.
Watch the latest episode of DecisionPoint on StockCharts TV's YouTube channel here!
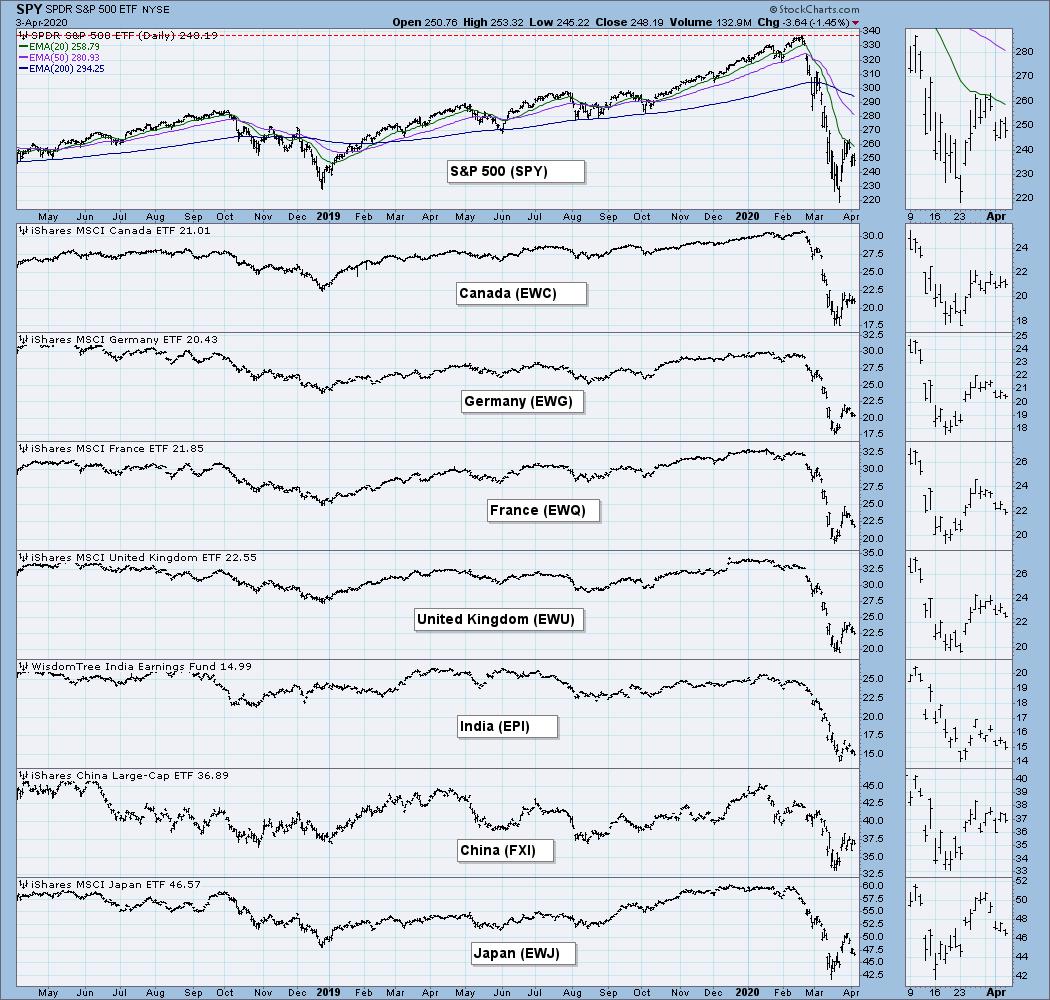
GLOBAL MARKETS
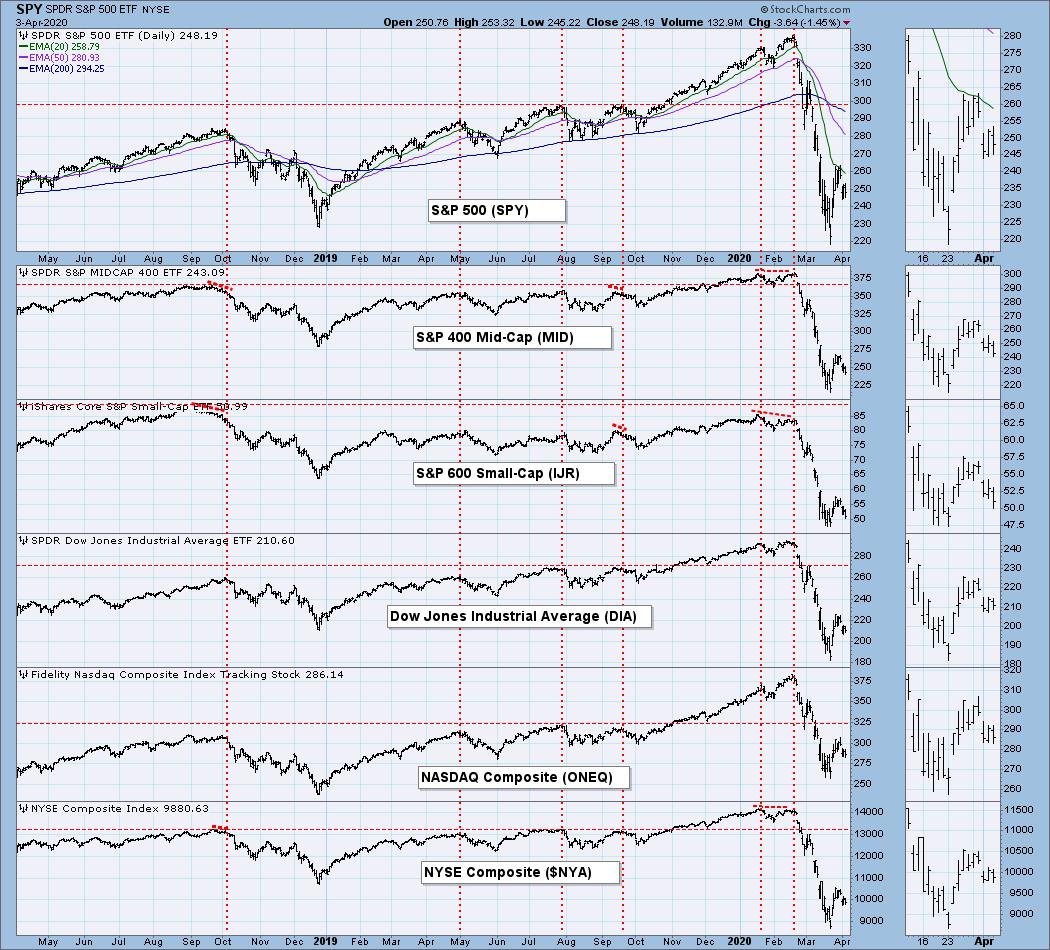
BROAD MARKET INDEXES
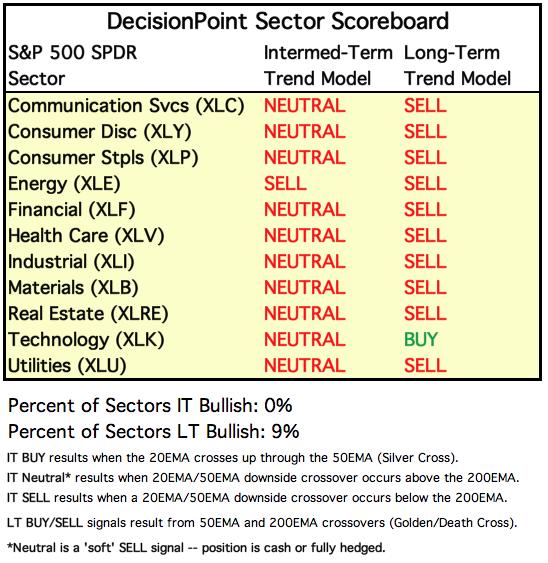
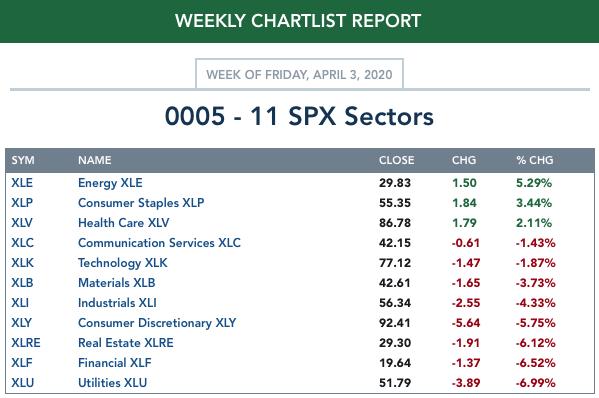
SECTORS
Each S&P 500 Index component stock is assigned to one, and only one, of 11 major sectors. This is a snapshot of the Intermediate-Term (Silver Cross) and Long-Term (Golden Cross) Trend Model signal status for those sectors.
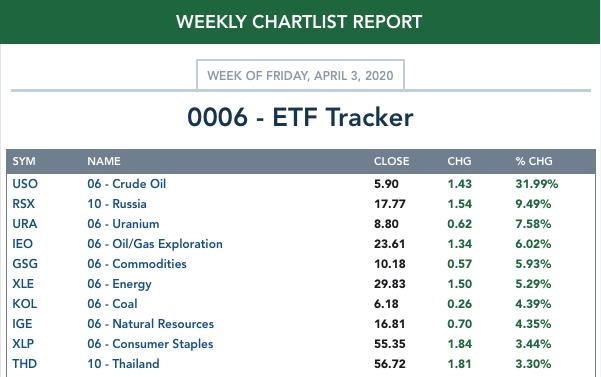
ETF TRACKER: This is a list of about 100 ETFs intended to track a wide range of U.S. market indexes, sectors, global indexes, interest rates, currencies, and commodities. StockCharts.com subscribers can acquire it in the DecisionPoint Trend and Condition ChartPack.
Top 10 . . .
. . . and bottom 10: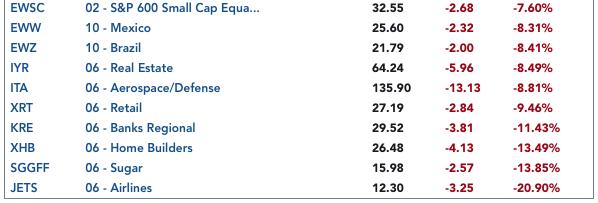
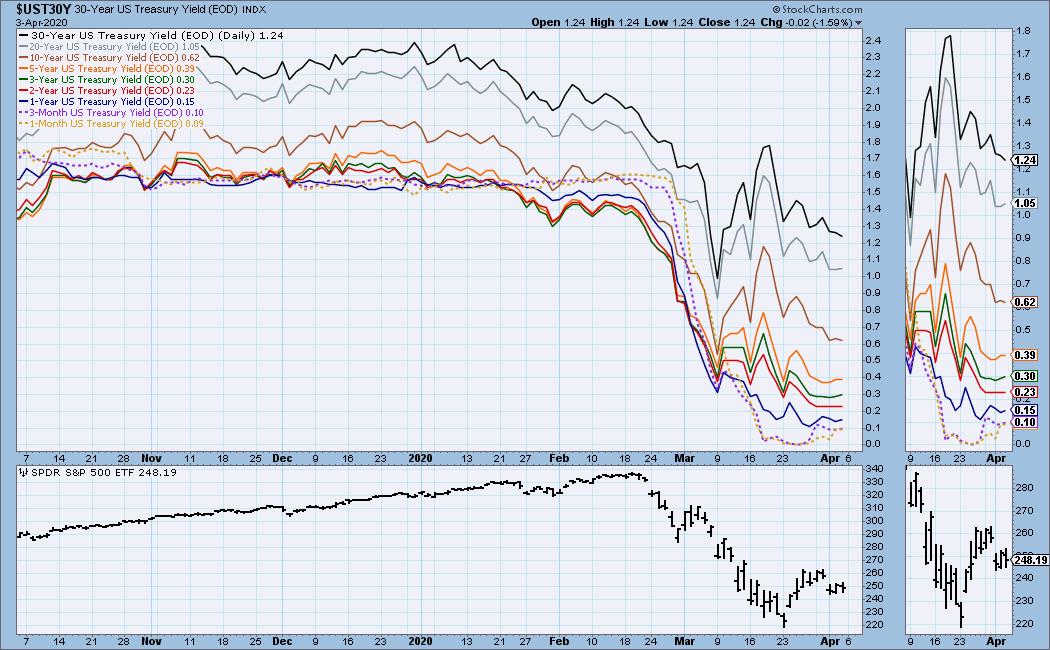
INTEREST RATES
This chart is included so we can monitor rate inversions. In normal circumstances the longer money is borrowed the higher the interest rate that must be paid. When rates are inverted, the reverse is true.
STOCKS
IT Trend Model: NEUTRAL as of 2/28/2020
LT Trend Model: SELL as of 3/19/2020
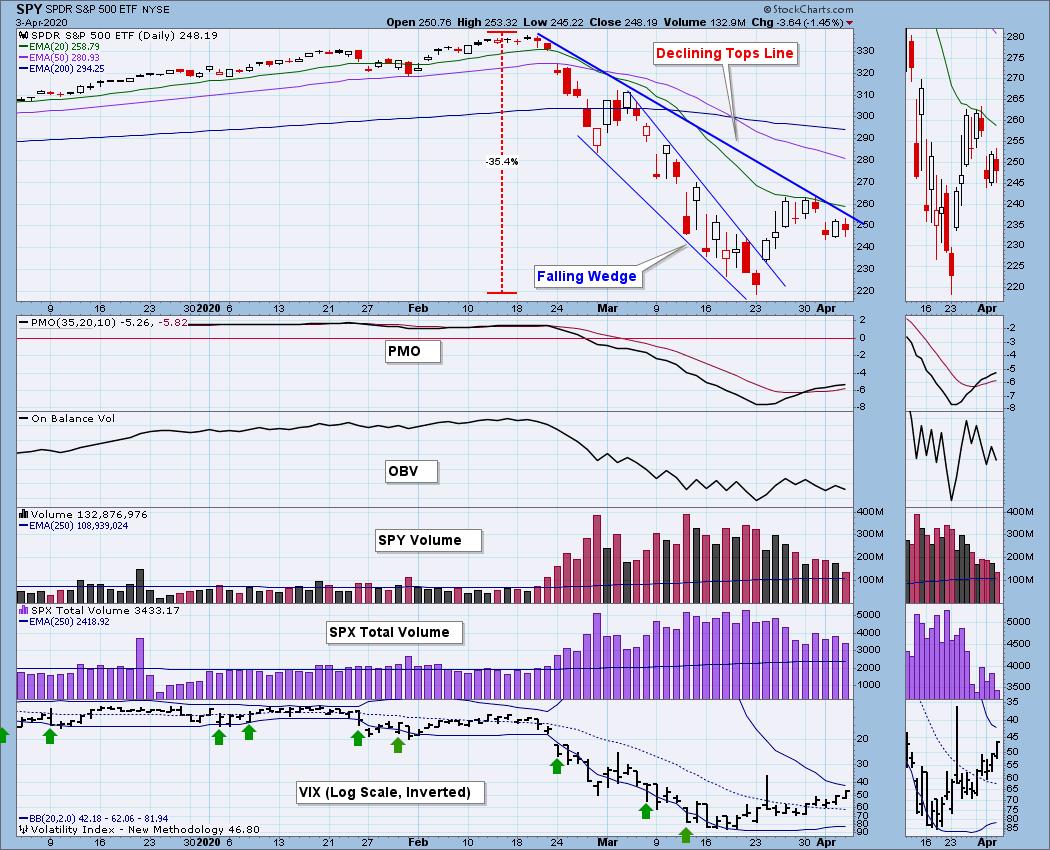
SPY Daily Chart: The declining tops line still dominates the chart, and the VIX is very close to the top Bollinger Band, an oversold sign.
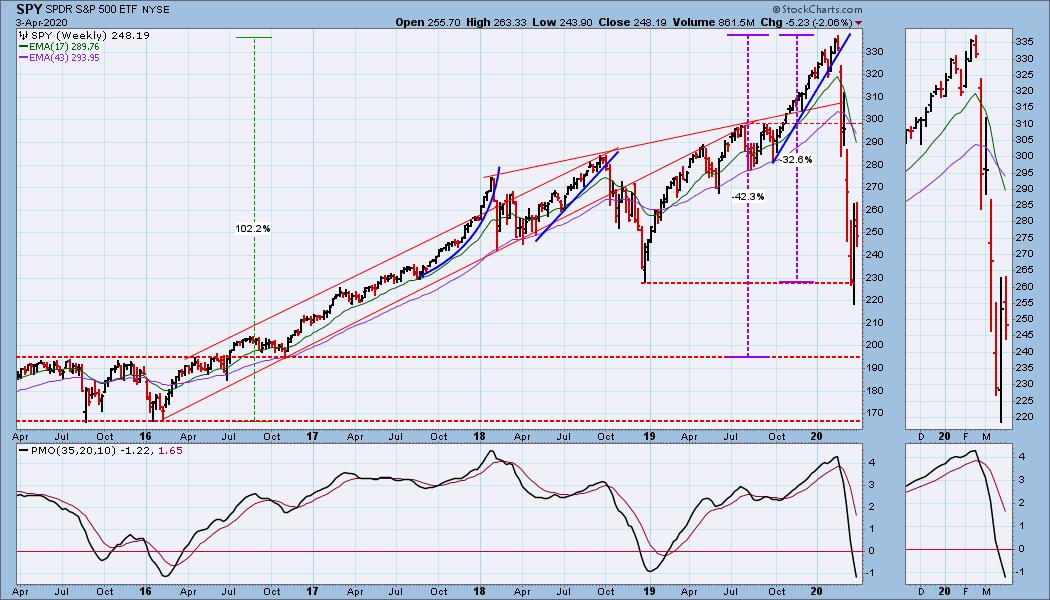
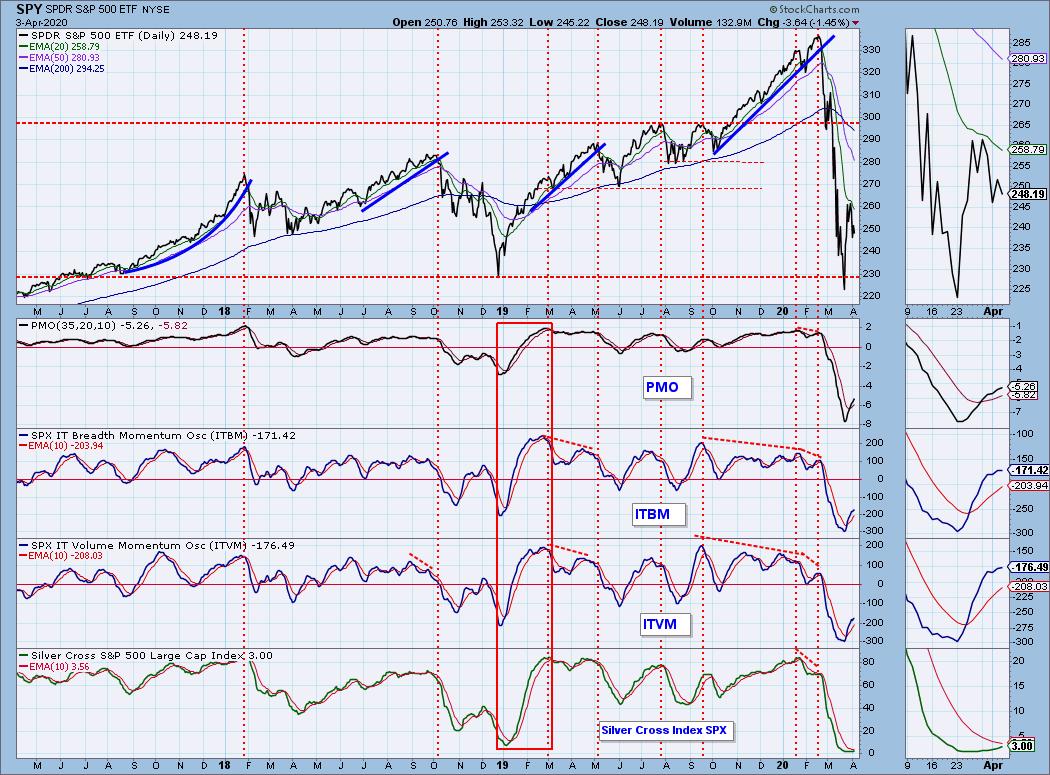
SPY Weekly Chart: The weekly PMO is oversold based upon the history shown on this chart, but I think it is still headed lower.
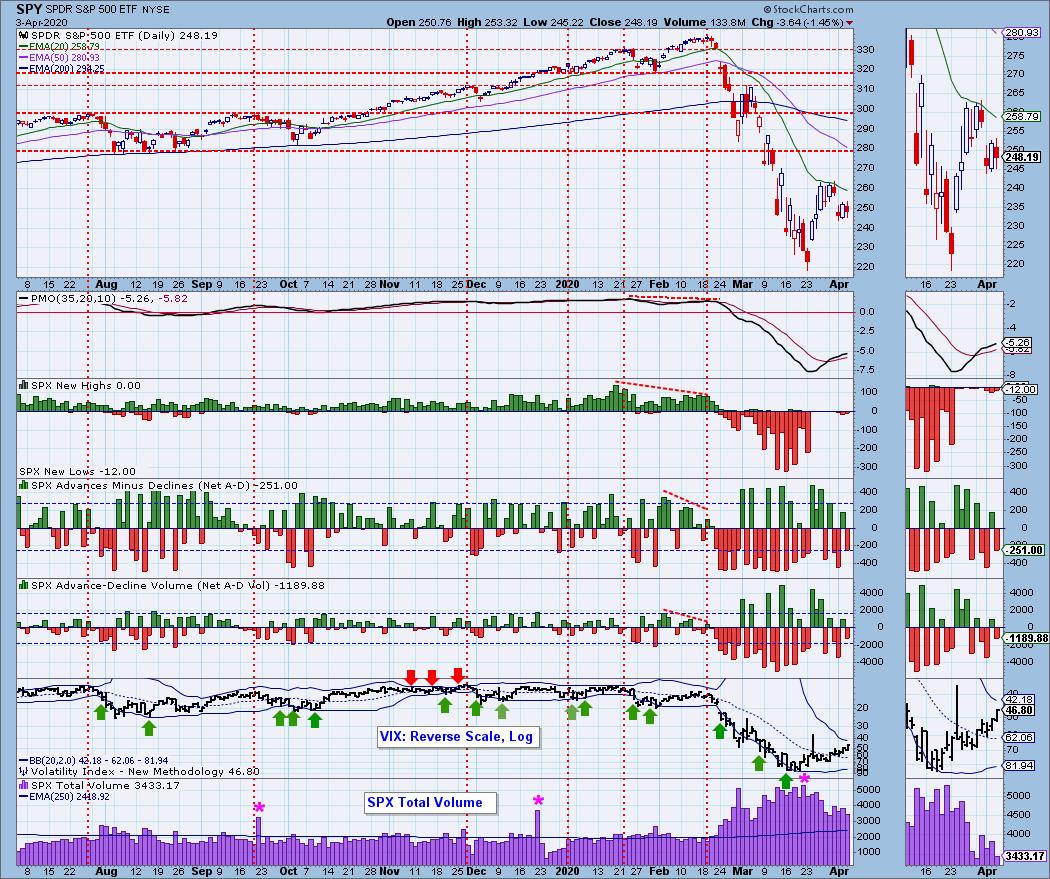
Climactic Market Indicators: Climactic activity on Wednesday proved to be a downside exhaustion climax. SPX Total Volume has contracted somewhat, but it is still extremely high.
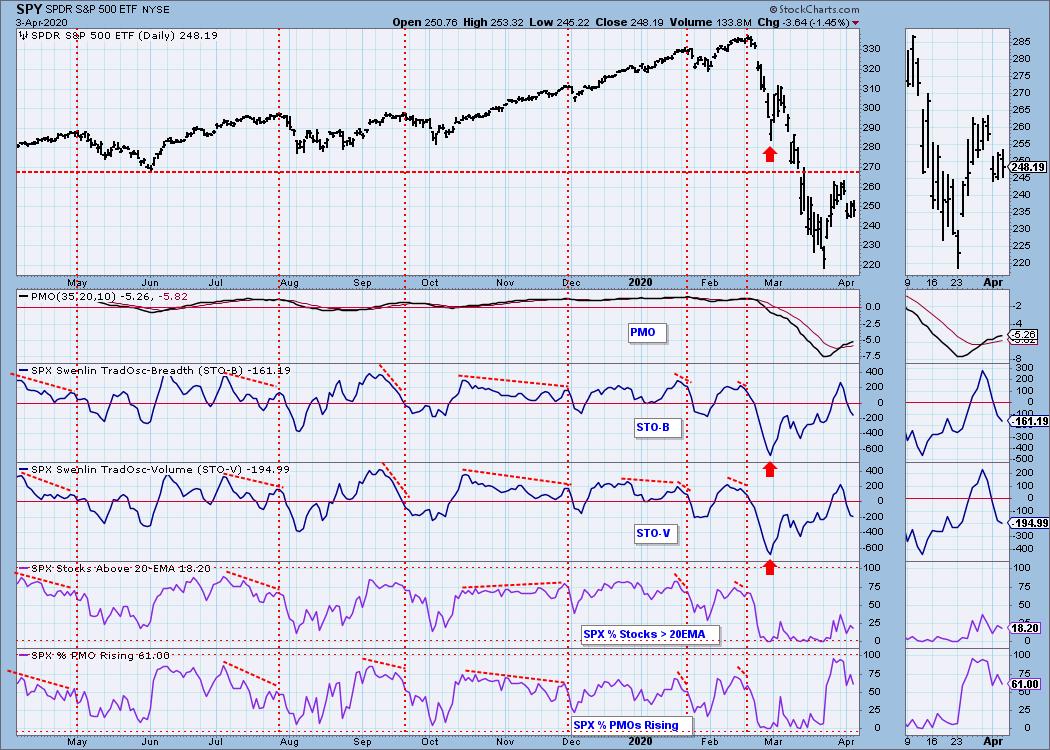
Short-Term Market Indicators: The short-term market trend is NEUTRAL, although this week's pullback could be setting a less accelerated angle of ascent. If Wednesday's lows are taken out, the short-term trend will be down. The condition is OVERSOLD, because the STO-B (breadth) and STO-V (volume) have a normal range from about +400 (ST overbought) to -400 (ST oversold). While, at the end of February they hit lows approaching -700, which is extremely oversold, I don't think that should be the bear market standard for "oversold" -- it's too extreme to expect it to be matched. Notice those extreme readings were not matched when the recent price low was reached. Readings at that point were modestly oversold, and provide a good example of how oversold indicator readings can correct internally, even when price is moving lower.
Intermediate-Term Market Indicators: The intermediate-term market trend is DOWN and the condition is OVERSOLD. The Silver Cross Index remains flat in spite of the market bounce. This is because the 20EMAs of SPX component stocks are still well below their 50EMAs. Just look at the 20/50EMA relationship on this chart (the SPY panel). It's going to take a lot of work to recover from that amount of spread.
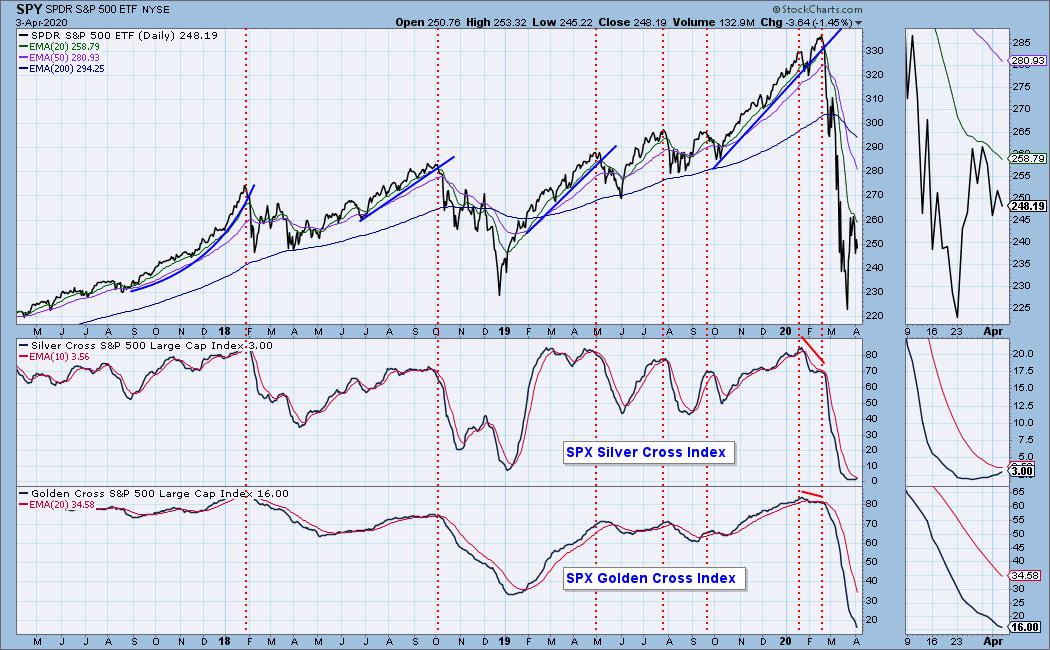
Even though there has been a bounce, these indicators are still very oversold. And the ITBM and ITVM appear to be getting ready to top below the zero line. Very bearish.
CONCLUSION: The trend is DOWN and the market condition is OVERSOLD.
In the beginning of 2019, at the bottom of a short cyclical bear market, there was a remarkable recovery that grew out of very oversold conditions (see boxed area on chart above). Coupled with that technical setup, the Fed cut interest rates, and that triggered a new bull market. Unfortunately, that is not where we are now. Now the market is extremely oversold, but it is broken, and the only thing that is going to fix it is to see a solid turning point on the COVID-19 crisis. That would be nice, but it is probable that there will be less clarity regarding a turning point, and there could be alternating good and bad news, which continues to churn the economy and the market for months.
That does not rule out what I mentioned at the beginning of this report, a possible rally of around +50% in size. To kick it off, there would have to be very positive news regarding the crisis that could carry for several weeks. The problem is that the enormous debt we're piling up is going to be deadly. The cause of the 1929 Crash, in my opinion, was permitting the ten percent margin, meaning stock could be purchased with 90% debt. And ask any plumber, it rolled downhill from there. So, a giant rally, while highly unlikely, is not out of the question. You may be inclined to play it, but don't fall in love.
To clarify the technical issues, the market is short- and intermediate-term oversold, not a bad setup for an important bottom; however, we're in a bear market, and Bear Market Rules say that oversold conditions are extremely dangerous, especially with IT indicators about to top.
Have you subscribed the DecisionPoint Diamonds yet? DP does the work for you by providing handpicked stocks/ETFs from exclusive DP scans! Add it with a discount! Contact support@decisionpoint.com for more information!
DOLLAR (UUP)
IT Trend Model: BUY as of 3/13/2020
LT Trend Model: BUY as of 5/25/2018
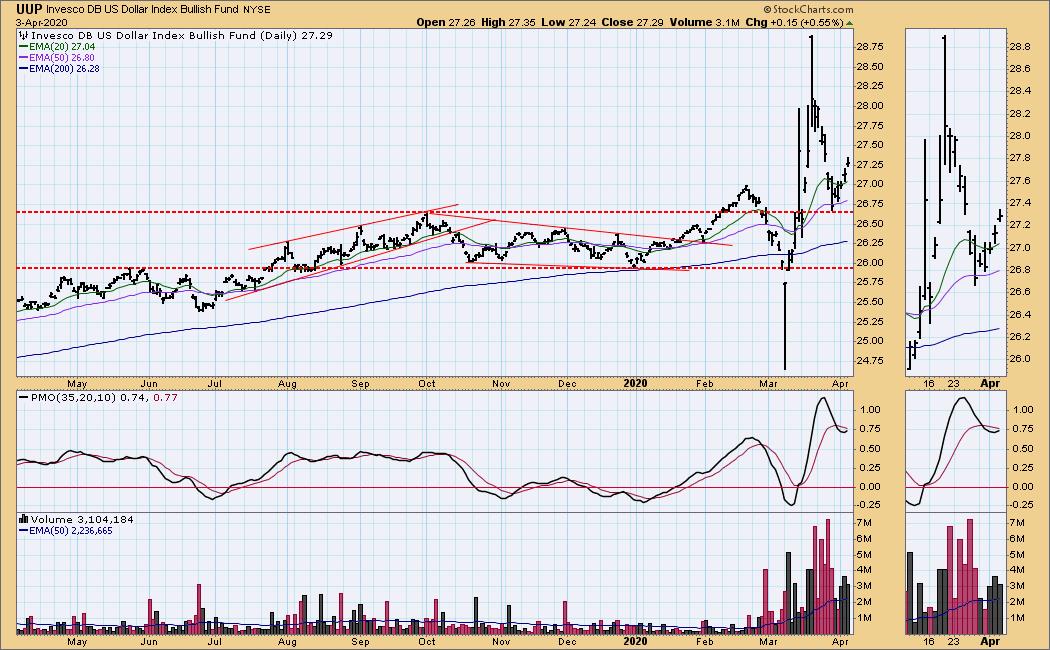
UUP Daily Chart: The radical movement in the last month has made it difficult to interpret this chart, but I would have to say is nets out positively. The administration's rescue package could weigh negatively, but the whole world is under pressure, so stay tuned.
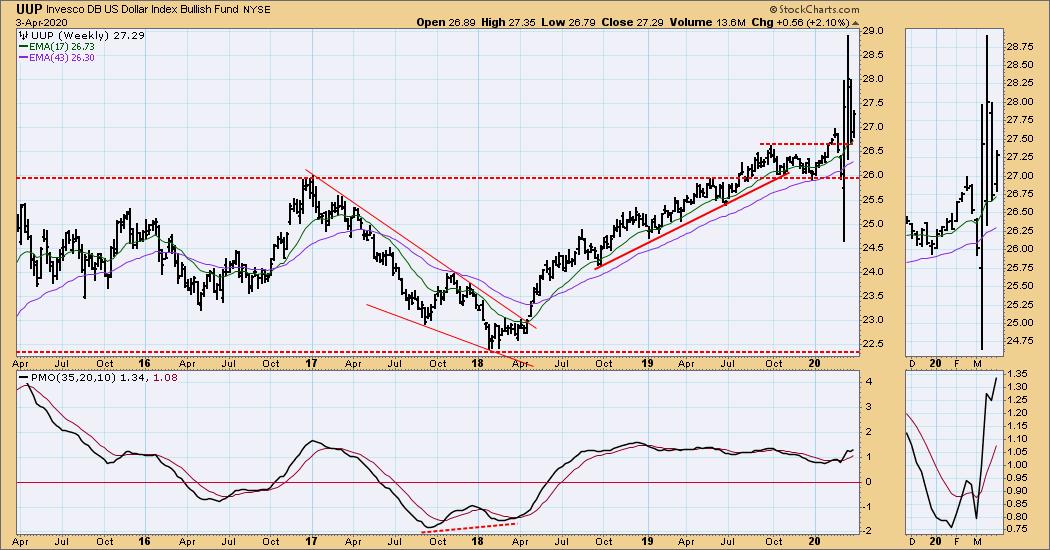
UUP Weekly Chart: Nothing to add in this time frame.
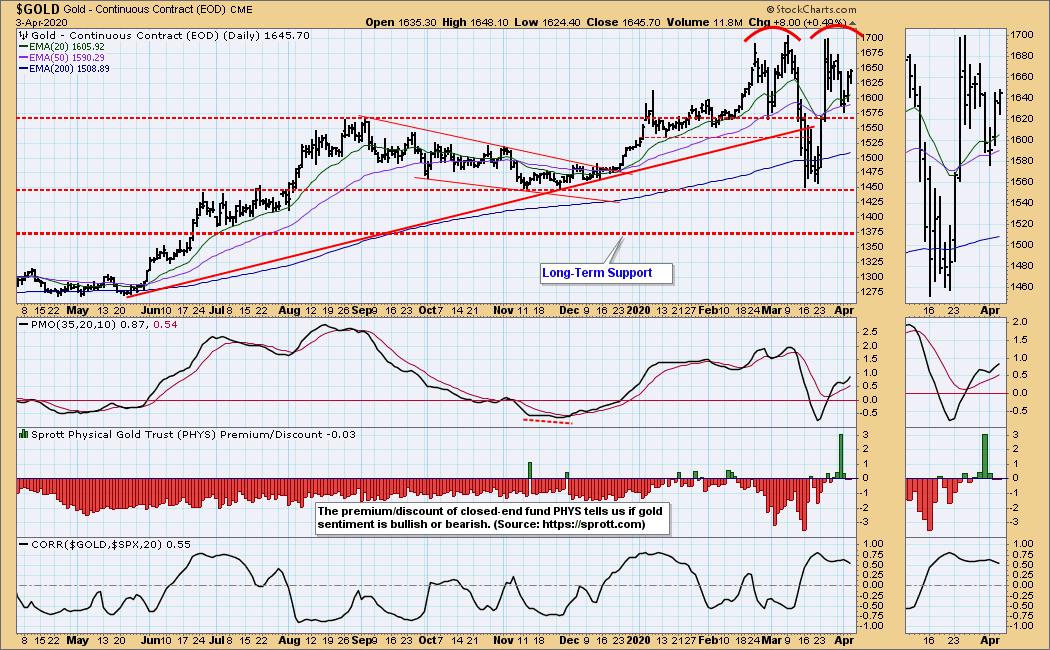
GOLD
IT Trend Model: BUY as of 12/26/2019
LT Trend Model: BUY as of 1/8/2019
GOLD Daily Chart: I should have noticed the double top last week, and it is still a factor. Gold is currently positively correlated with stocks, meaning the are moving together. That's not a plus for gold. The green bars on the sentiment panel suggest some interest in gold is stirring.
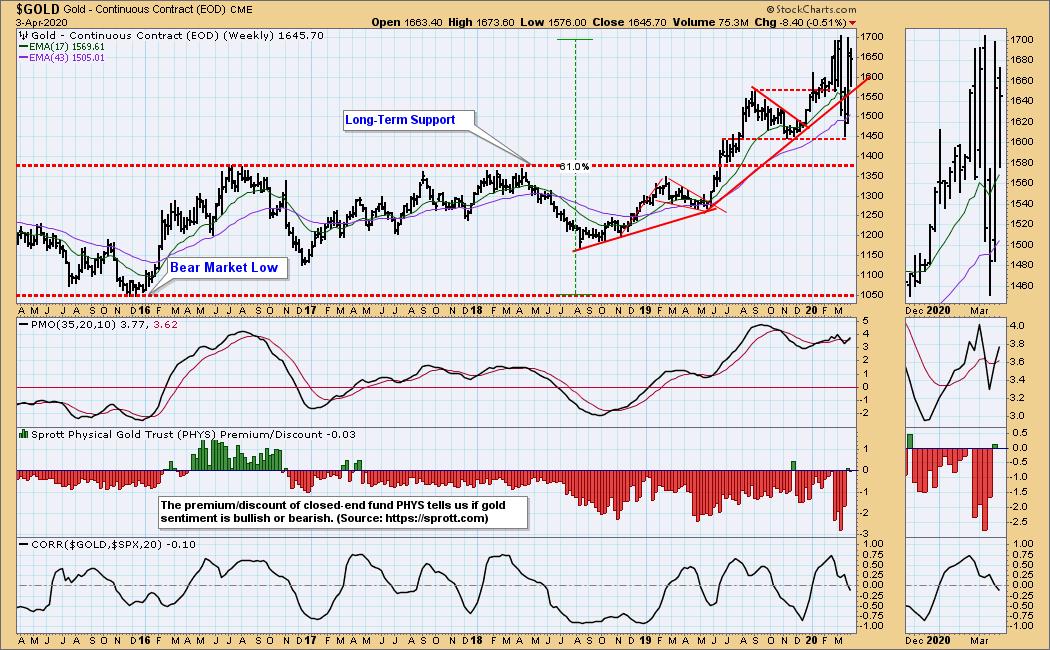
GOLD Weekly Chart: Since February I notice the same volatility in gold that we see in stocks. The rising trend line has been recaptured, and the weekly PMO is rising.
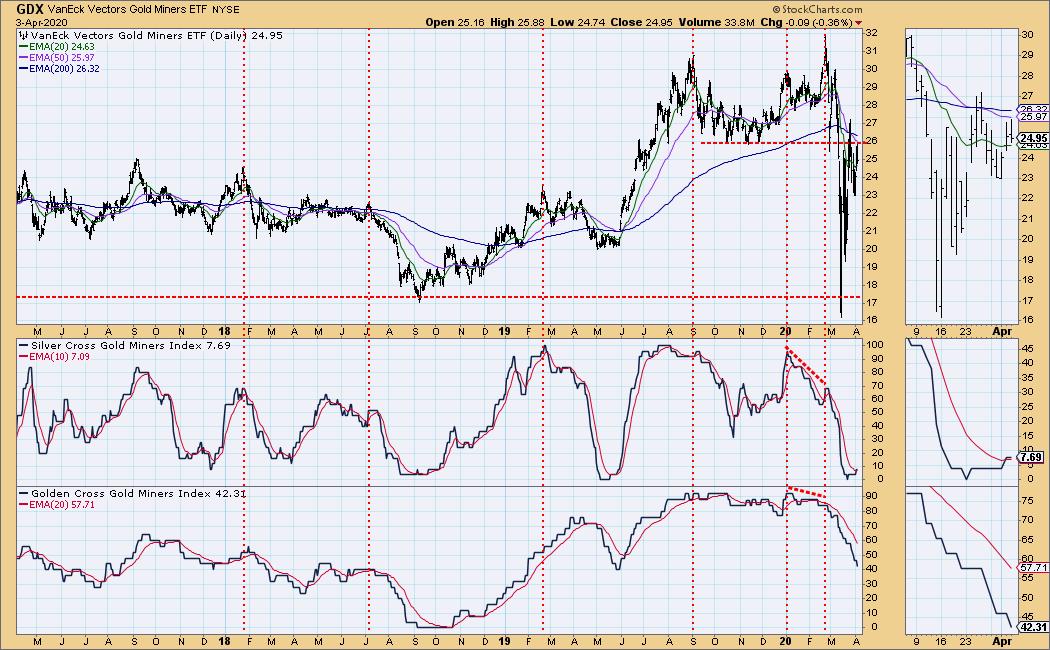
GOLD MINERS Golden and Silver Cross Indexes: The Silver Cross Index is showing some life, and the Golden Cross Index at 42% says that this sector isn't nearly as washed out as S&P 500 stocks.
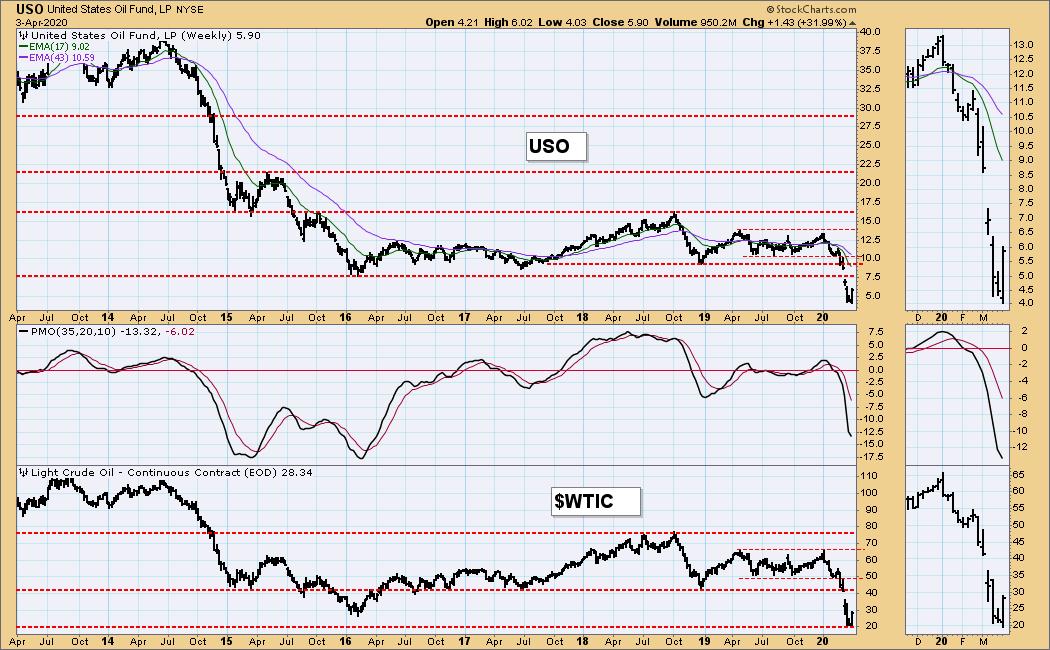
CRUDE OIL (USO)
IT Trend Model: NEUTRAL as of 1/27/2020
LT Trend Model: SELL as of 2/3/2020
USO Daily Chart: This week from low to high USO rallied almost 50%, thanks to hope that Russia and Saudi Arabia will be cutting back production. Let's see if hope turns to reality.
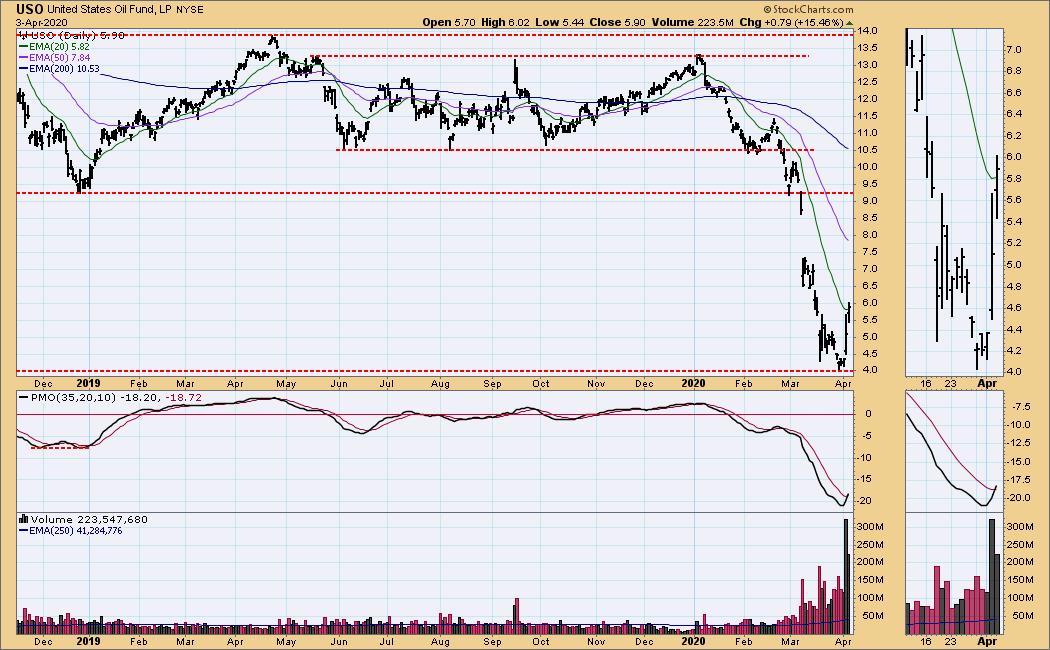
USO Weekly Chart: This week WTIC found support at $20.
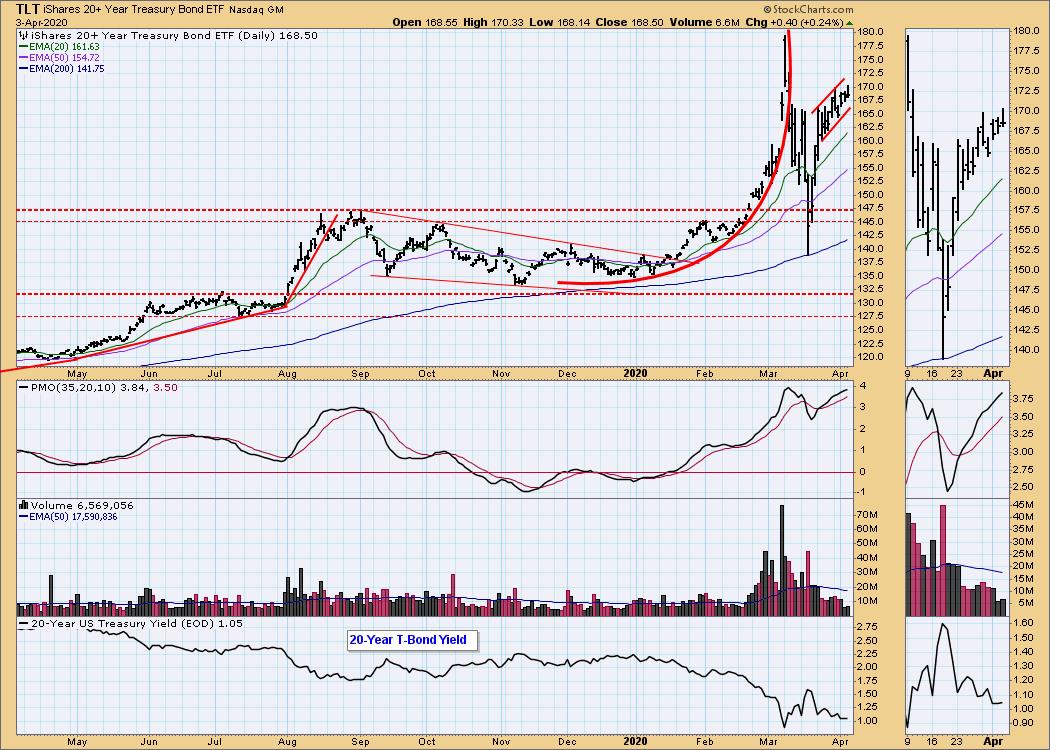
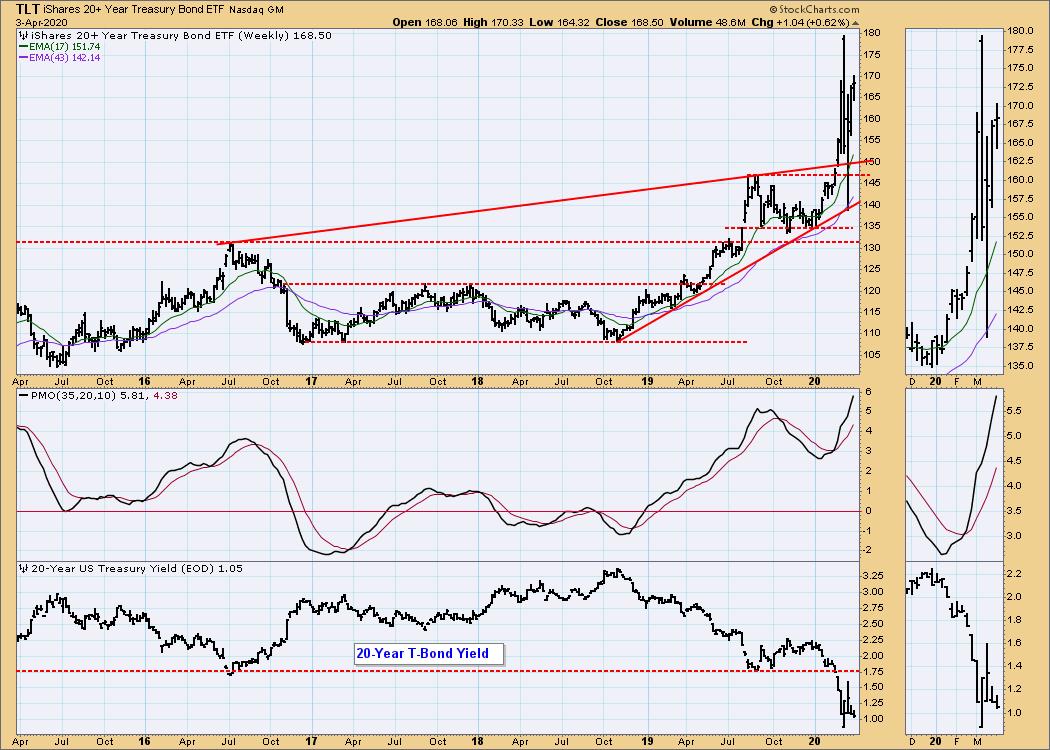
BONDS (TLT)
IT Trend Model: BUY as of 1/22/2020
LT Trend Model: BUY as of 1/2/2019
TLT Daily Chart: The rising flag formation is not particularly bullish, compared to a flag the consolidates downward; nevertheless, it continues to extend. In this case I think it will break downward, much like a rising wedge.
TLT Weekly Chart: The weekly PMO is very overbought, but it is still moving up strongly.
Technical Analysis is a windsock, not a crystal ball.
Happy Charting! - Carl
NOTE: The signal status reported herein is based upon mechanical trading model signals, specifically, the DecisionPoint Trend Model. They define the implied bias of the price index based upon moving average relationships, but they do not necessarily call for a specific action. They are information flags that should prompt chart review. Further, they do not call for continuous buying or selling during the life of the signal. For example, a BUY signal will probably (but not necessarily) return the best results if action is taken soon after the signal is generated. Additional opportunities for buying may be found as price zigzags higher, but the trader must look for optimum entry points. Conversely, exit points to preserve gains (or minimize losses) may be evident before the model mechanically closes the signal.
Helpful DecisionPoint Links:
DecisionPoint Alert Chart List
DecisionPoint Golden Cross/Silver Cross Index Chart List
DecisionPoint Sector Chart List
Price Momentum Oscillator (PMO)
Swenlin Trading Oscillators (STO-B and STO-V)