
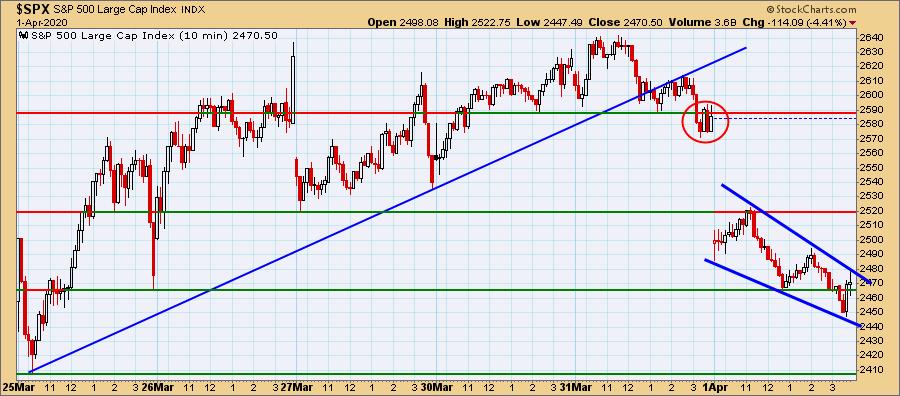
After setting up a steady rising trend for the past four and half days on the 10-minute bar chart, a break down began. You'll notice we actually had some 'warning' based on the trading at the end of yesterday when the rising trend was broken, followed by a break below support at 2590. Now we do have a very short-term bullish descending wedge. Our confidence level on it resolving upward is low given the bear market rules we are following right now.
Free LIVE Trading Room Open Tomorrow!
Thursday, April 2nd - Join Mary Ellen McGonagle and I as we tap into potential trading opportunities in this highly volatile market. I will be looking at recent "Diamonds" from my DP Diamonds Report for possible entries and exits real-time!
The free trading room will be open 11:00 am Eastern time until 12:00 pm to allow investors across all time zones to have live access.
Our goal is to help educate you during these tricky times with insights that can be used in any environment.
Remember, these are not recommendations to buy or sell. Our objective is to teach you to fish, but you need to apply your own analysis to see if these stocks fit your investment profile. There are no guaranteed winners!
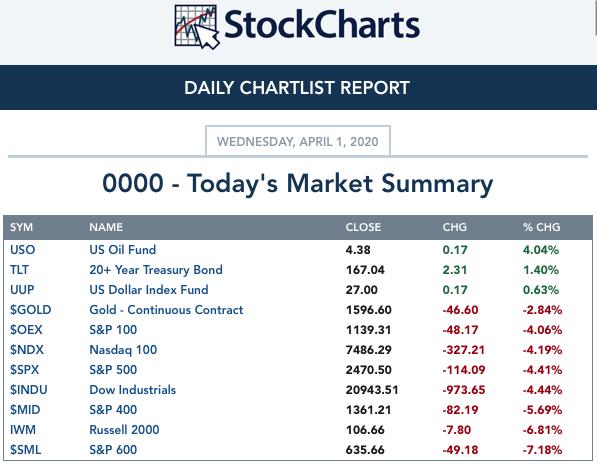
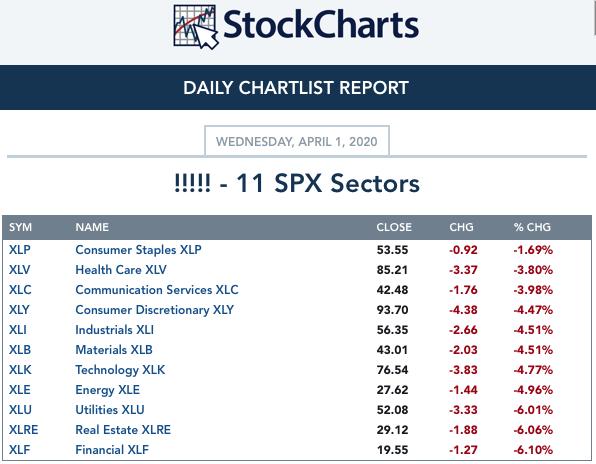
TODAY'S Broad Market Action:
Past WEEK Results: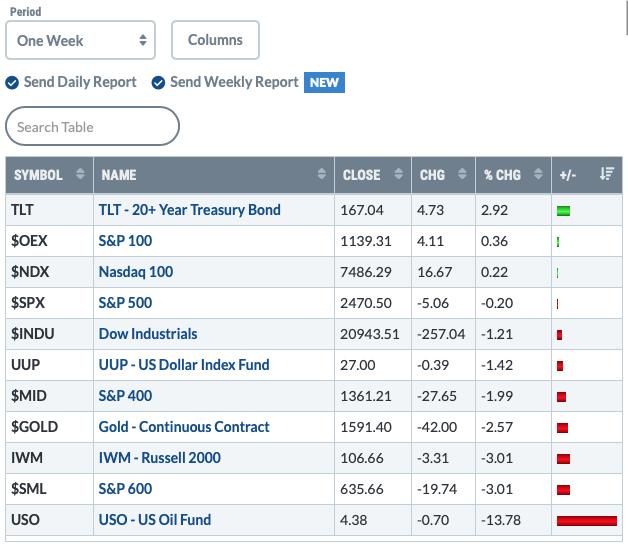
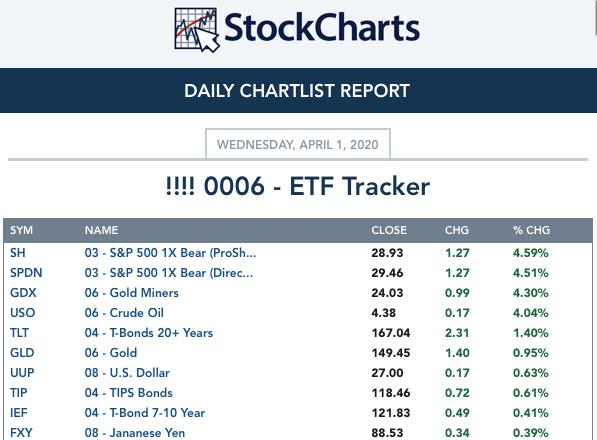
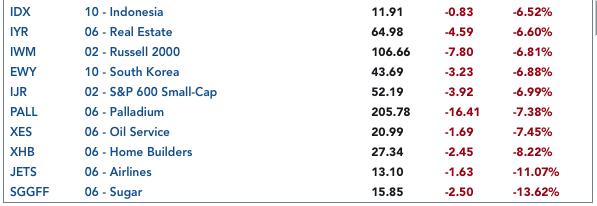
Top 10 from ETF Tracker:
Bottom 10 from ETF Tracker:
On Friday, the DecisionPoint Alert Weekly Wrap presents an assessment of the trend and condition of the stock market (S&P 500), the U.S. Dollar, Gold, Crude Oil, and Bonds. Monday through Thursday the DecisionPoint Alert daily report is abbreviated and covers changes for the day.
Watch the latest episode of DecisionPoint on StockCharts TV's YouTube channel here!
SECTORS
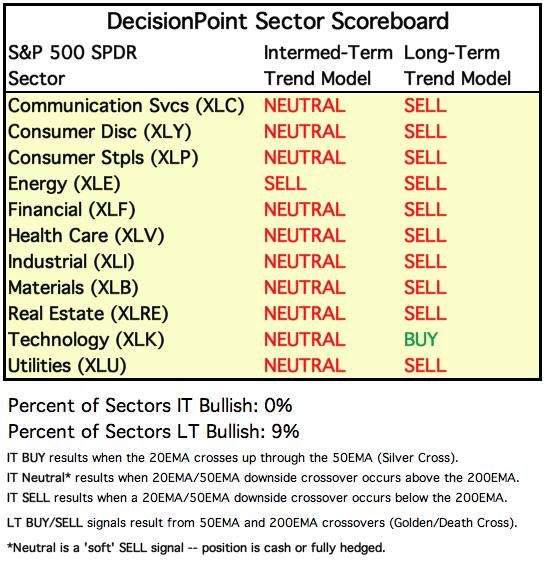
SIGNALS:
Each S&P 500 Index component stock is assigned to one, and only one, of 11 major sectors. This is a snapshot of the Intermediate-Term (Silver Cross) and Long-Term (Golden Cross) Trend Model signal status for those sectors.
TODAY'S RESULTS:
One WEEK Results: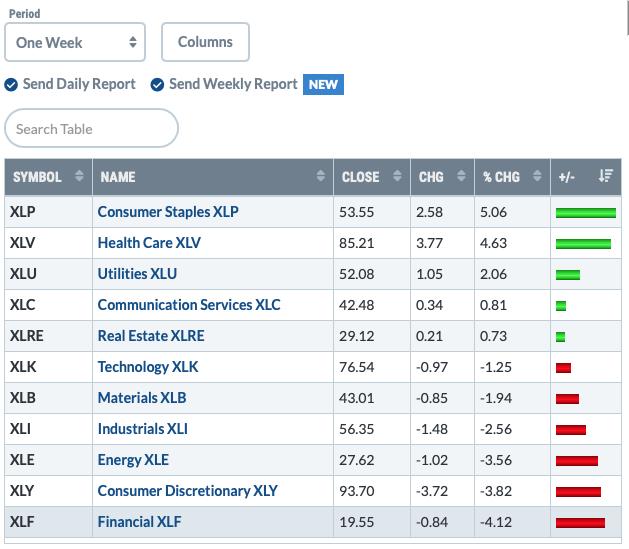
STOCKS
IT Trend Model: NEUTRAL as of 2/28/2020
LT Trend Model: SELL as of 3/19/2020
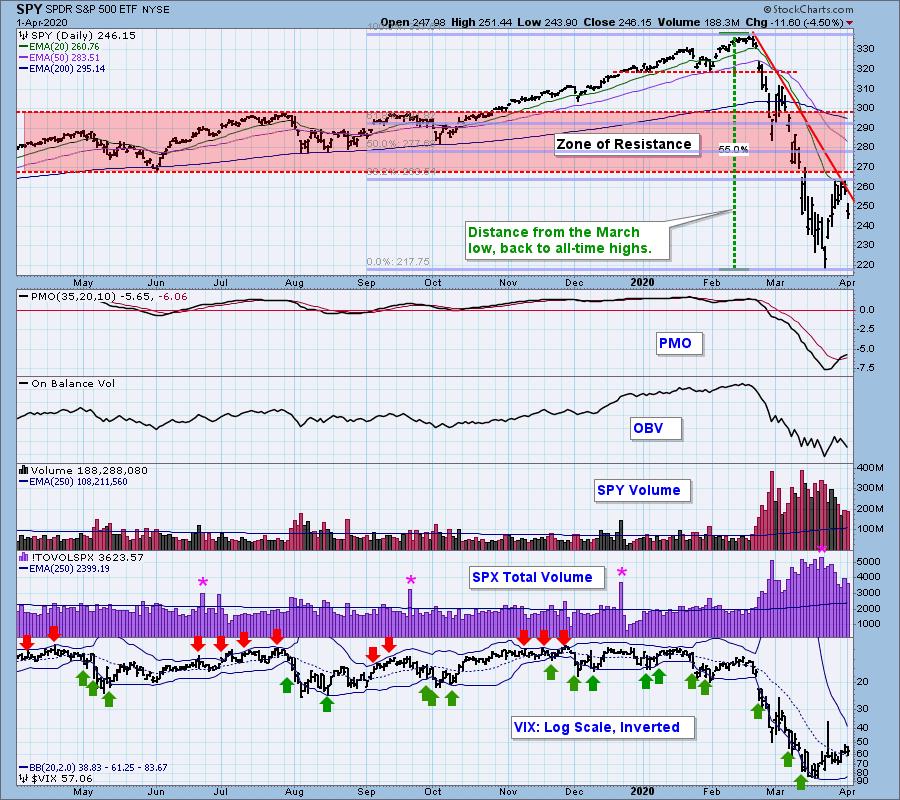
SPY Daily Chart: Overhead resistance proved too much for the market. After reaching a strong 'zone of resistance', the 20-EMA and the Fibonacci Retracement line, price gapped down. Volume was lower, but still well-above the annual average. The Bollinger Bands on the VIX are beginning to contract. That means that readings will be hitting the top Band soon. That is an overbought condition in a bear market. We will want to watch this carefully.
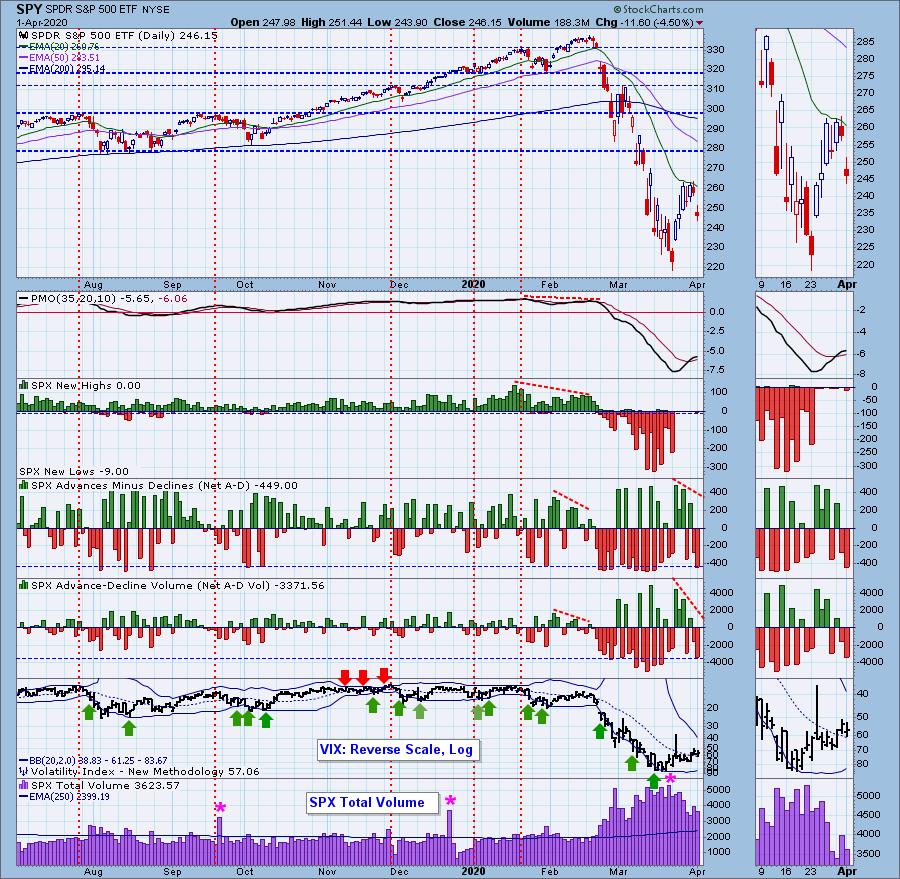
Climactic Market Indicators: Seeing very negative climactic readings on breadth after a short-term rally suggests a selling initiation.
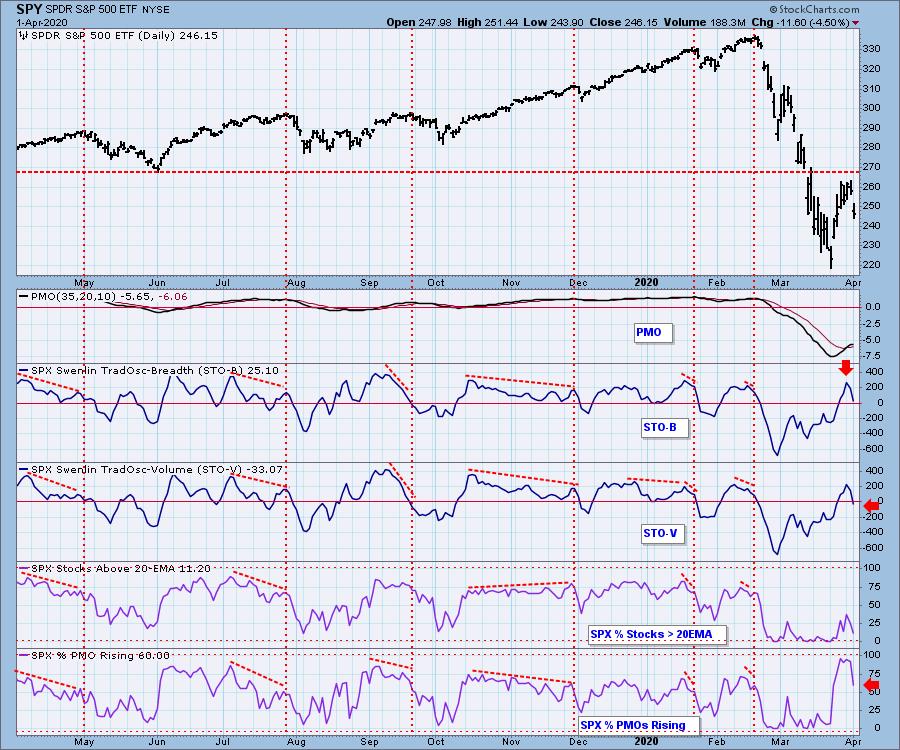
Short-Term Market Indicators: The ST trend is UP and the market condition is NEUTRAL based upon the Swenlin Trading Oscillator (STO) readings. They only ticked lower yesterday, today they fell. Readings are now back in neutral territory. We saw a major contraction on %PMO rising which tells us today's decline yanked PMOs downward on about 1/3 of the components given yesterday's reading of 93% PMOs rising.
Intermediate-Term Market Indicators: The Silver Cross Index (% of SPX stocks 20EMA > 50EMA) actually rose from 2.2 to 2.4. Nothing to write home about as they say. The Golden Cross Index (percent of SPX stocks 50EMA > 200EMA) is still declining but decelerating as it approaches zero. I believe it is a good sign to see deceleration on the GCI, but we need it to actually bottom.
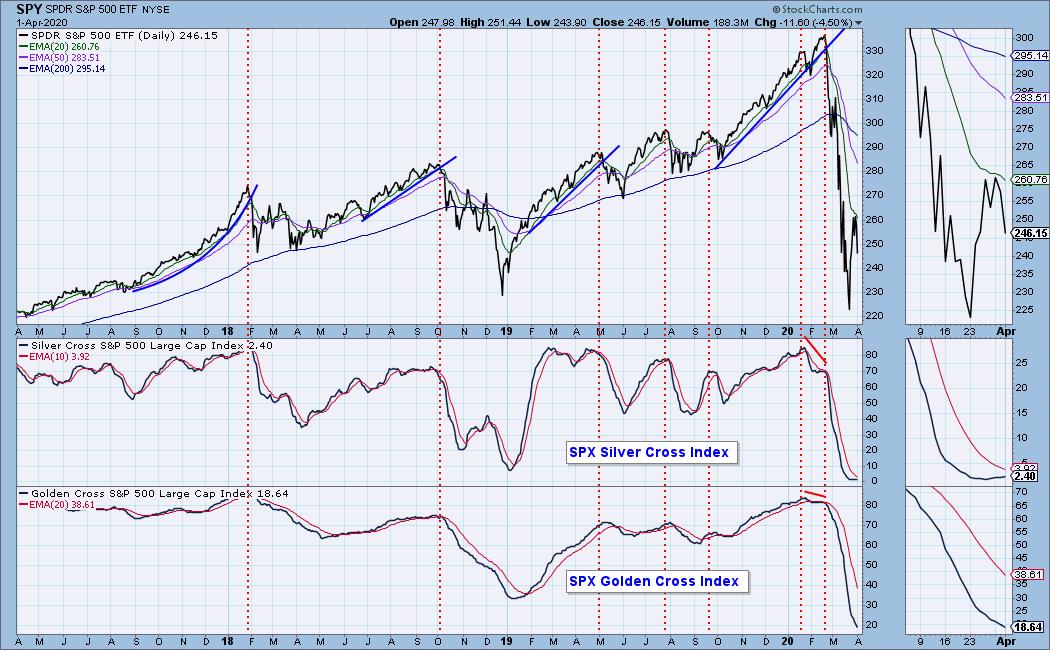
The IT trend is DOWN and the market condition is VERY OVERSOLD based upon all of the readings on the indicators below. Remember yesterday I said that if this truly is a market bottom, we need to see the same kind of 'thrust' from these indicators that we saw at the end of the 2018 correction/bear market. Today we already are seeing deceleration. Not a good sign.
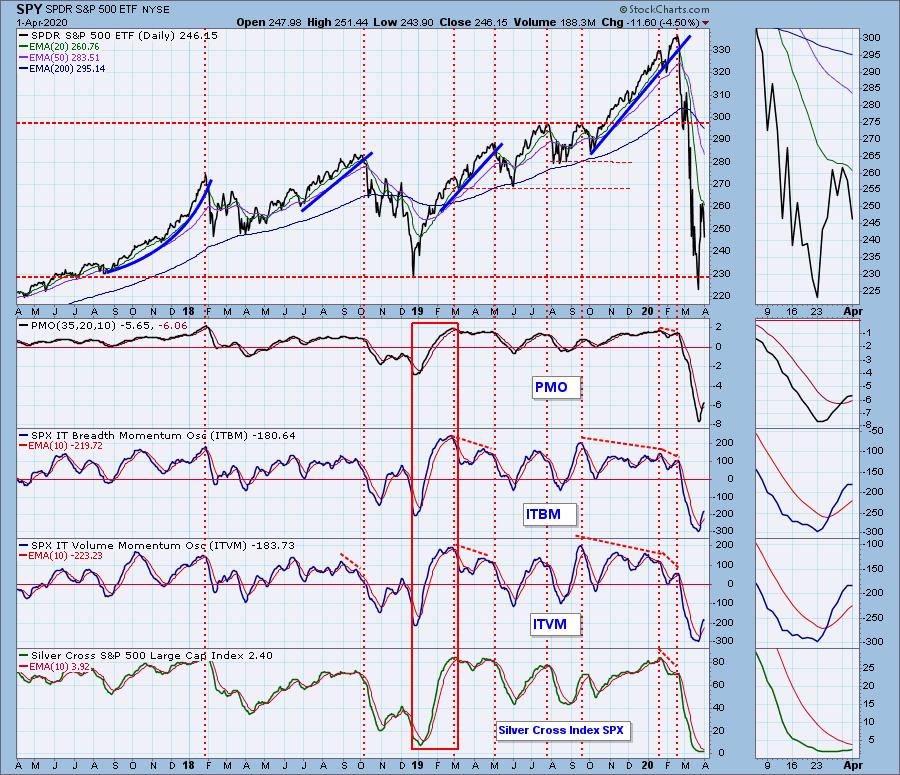
CONCLUSION: The ST is UP and IT trend is DOWN. Market condition based on ST indicators is OVERBOUGHT and based on IT indicators is OVERSOLD. The market has failed at an important test of resistance. With short-term indicators in Neutral and falling, I am looking for a continuation of today's decline and a likely test of the current bear market low.
(Not a Diamonds subscriber? Add it to your DP Alert subscription and get a discount! Contact support@decisionpoint.com for your limited time coupon code!)
DOLLAR (UUP)
IT Trend Model: NEUTRAL as of 3/9/2020
LT Trend Model: BUY as of 5/25/2018
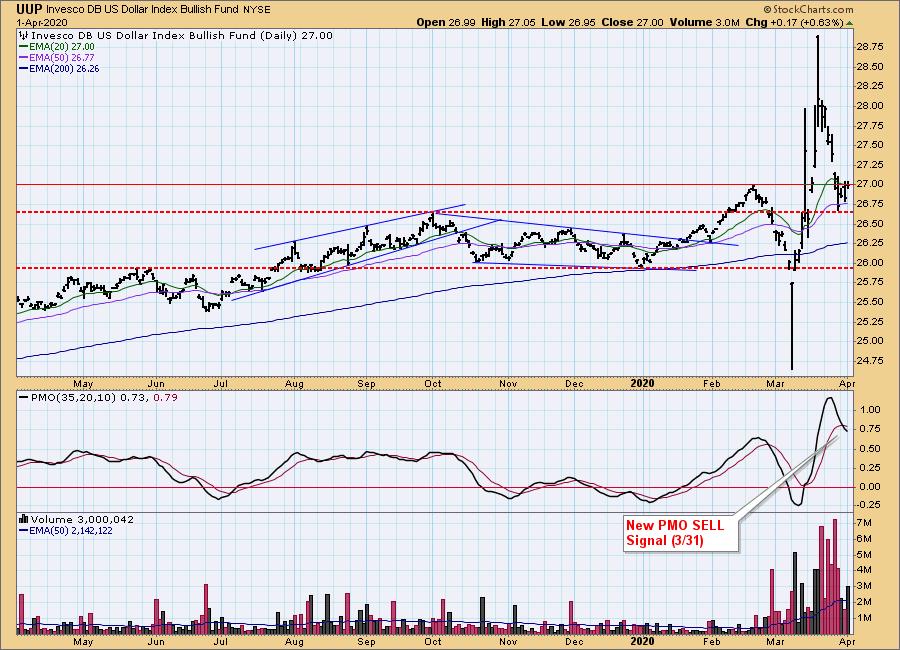
UUP Daily Chart: The Dollar rose today and closed right on resistance at $27.00. Given the SELL signal, I am looking for the Dollar to move lower.
GOLD
IT Trend Model: BUY as of 12/26/2019
LT Trend Model: BUY as of 1/8/2019
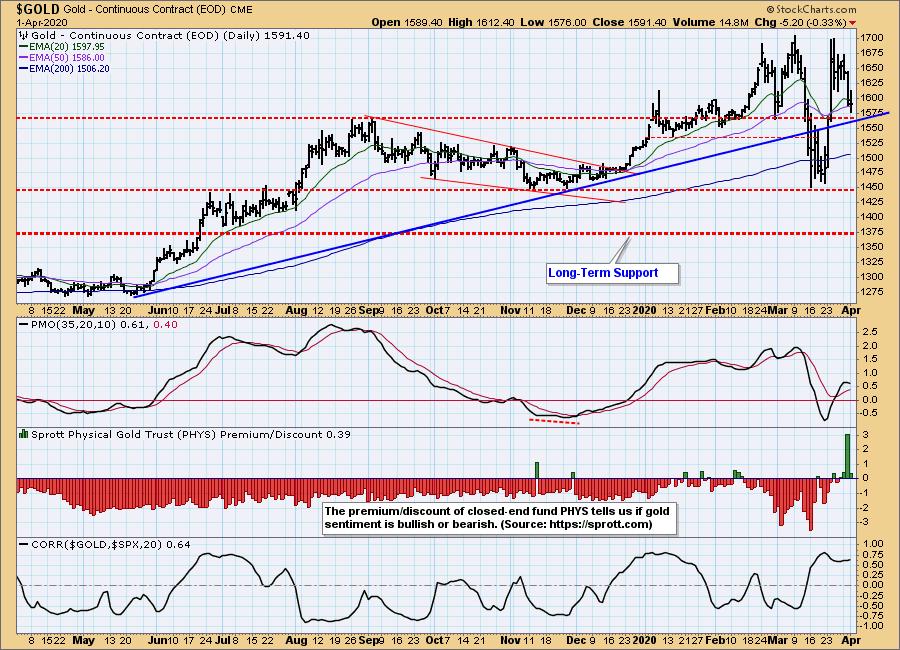
GOLD Daily Chart: A likely drop in the Dollar will give Gold some strength. We are reaching very important near-term support along the September top and the rising bottoms trendline. The PMO has turned down which doesn't inspire confidence.
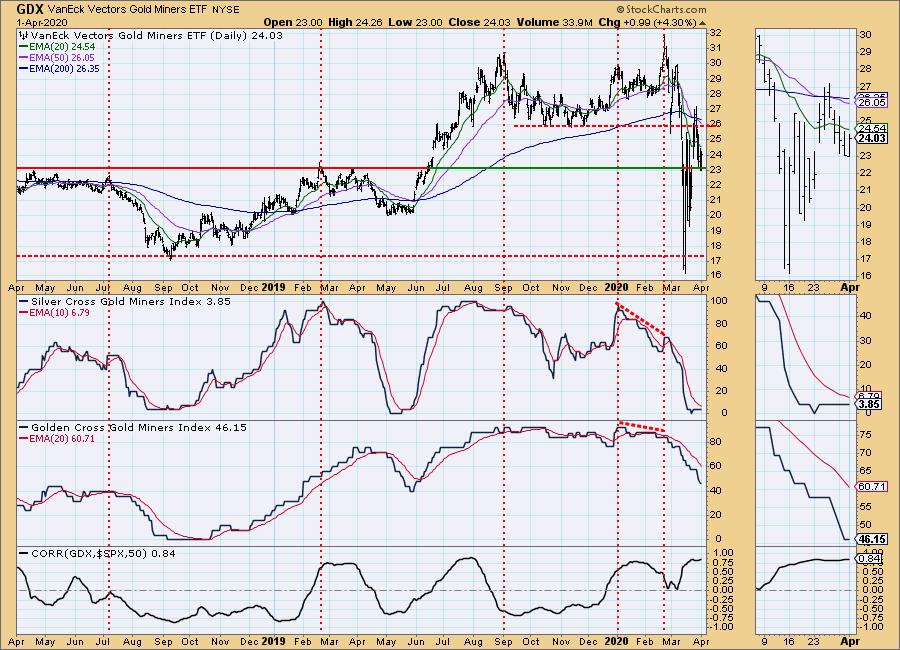
GOLD MINERS Golden and Silver Cross Indexes: Interestingly, Gold Miners had a fantastic day which frankly surprised me on a down day for the market. Lately Gold Miners have been tracking closely to the market based on the correlation I included below. This could be a sign of strength, although I wouldn't want to trade on that given the high positive correlation to a SPX bear market.
CRUDE OIL (USO)
IT Trend Model: Neutral as of 1/27/2020
LT Trend Model: SELL as of 2/3/2020
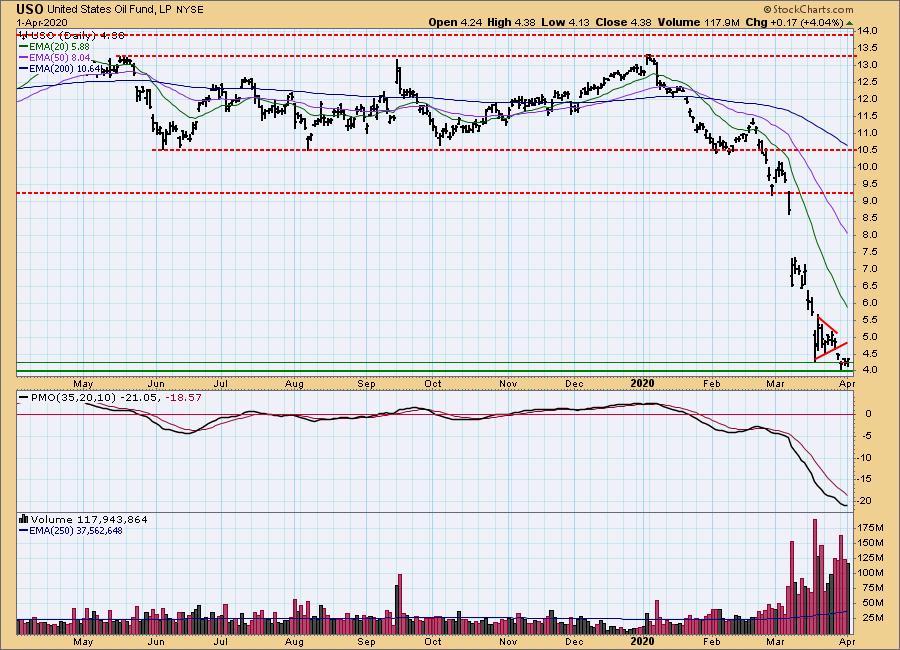
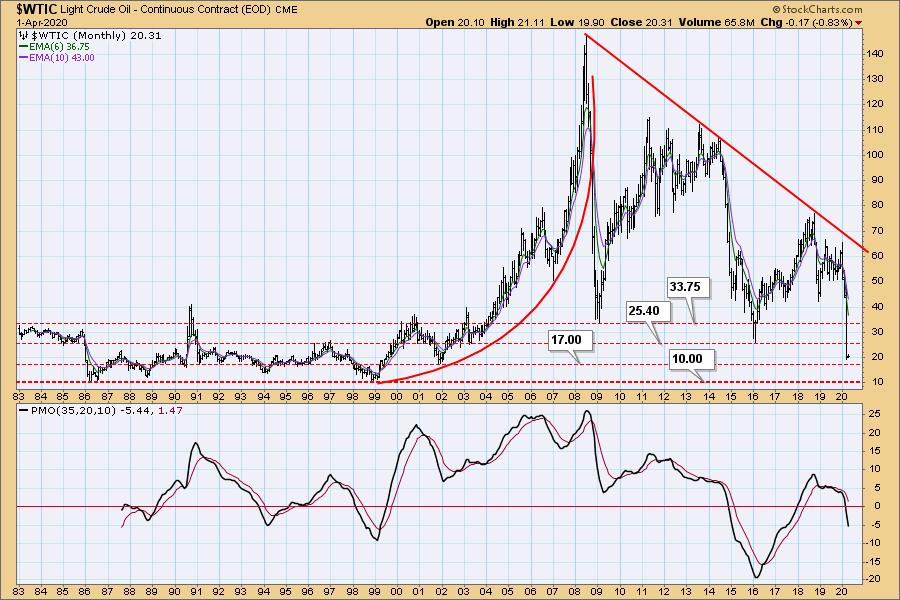
USO Daily Chart: Well, $4.00 seems to be the support level now for USO. It really is breathtaking when you look at the decline of the last three months. The PMO is decelerating, but we saw that happen when the symmetrical triangle formed and we can see how that turned out. As far as $WTIC, $20 seems to be the new support level. Yet, we can see that the strongest support line is at $17.
BONDS (TLT)
IT Trend Model: BUY as of 1/22/2020
LT Trend Model: BUY as of 1/2/2019
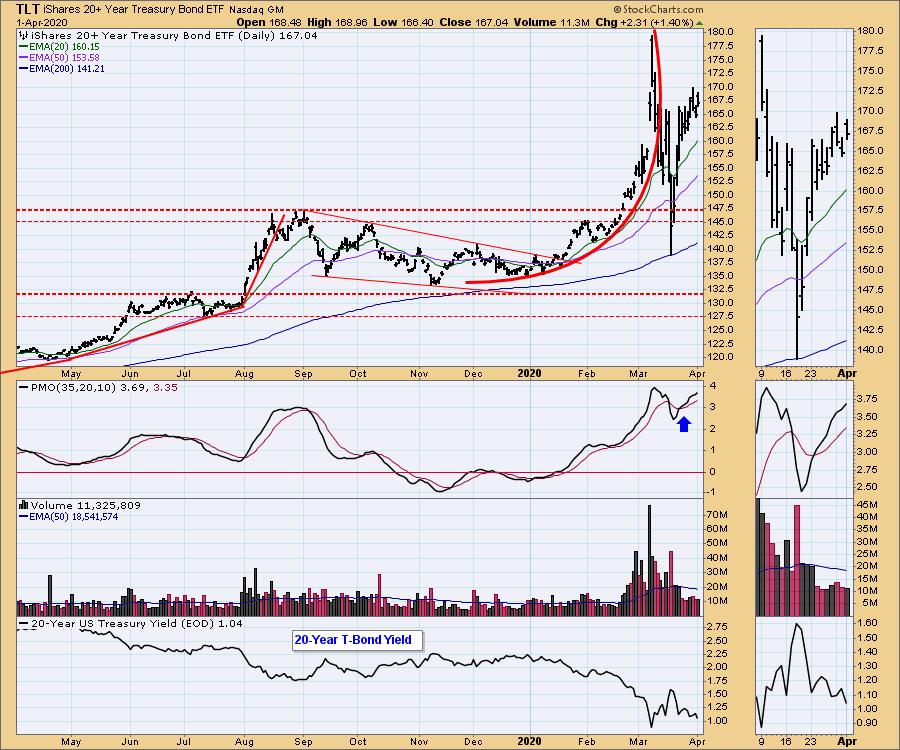
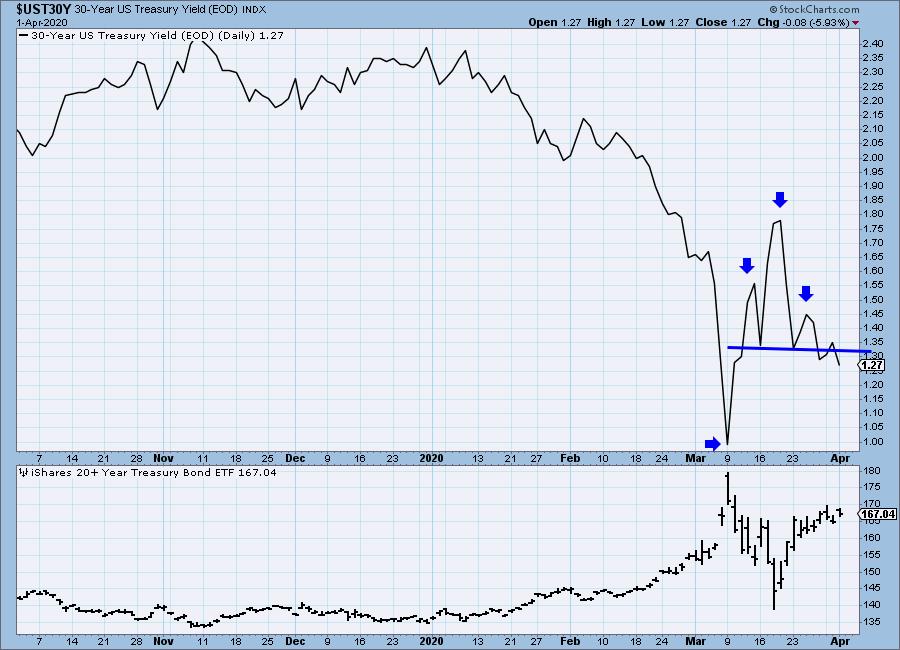
TLT Daily Chart: Although the PMO is very overbought, it is still rising. I suspect it will move to test the all-time high based on the head and shoulders pattern I'm seeing on the 30yr Treasury Yield. The pattern has executed. Lower yields mean higher prices on bonds.
Have you subscribed the DecisionPoint Diamonds yet? DP does the work for you by providing handpicked stocks/ETFs from exclusive DP scans! Add it with a discount! Contact support@decisionpoint.com for more information!
Technical Analysis is a windsock, not a crystal ball.
Happy Charting! - Erin
Email: erin@decisionpoint.com
The May Money Show has been tentatively moved to August. We don't have the dates yet. Erin Swenlin will still be presenting at the The MoneyShow Las Vegas August 2020! You'll have an opportunity to meet Erin and discuss the latest DecisionPoint news and Diamond Scans. Claim your FREE pass here! You can watch online with this pass too!! There will be an online conference in May, stay tuned for details.
NOTE: The signal status reported herein is based upon mechanical trading model signals, specifically, the DecisionPoint Trend Model. They define the implied bias of the price index based upon moving average relationships, but they do not necessarily call for a specific action. They are information flags that should prompt chart review. Further, they do not call for continuous buying or selling during the life of the signal. For example, a BUY signal will probably (but not necessarily) return the best results if action is taken soon after the signal is generated. Additional opportunities for buying may be found as price zigzags higher, but the trader must look for optimum entry points. Conversely, exit points to preserve gains (or minimize losses) may be evident before the model mechanically closes the signal.
Helpful DecisionPoint Links (Can Be Found on DecisionPoint.com Links Page):
DecisionPoint Shared ChartList and DecisionPoint Chart Gallery
Price Momentum Oscillator (PMO)
Swenlin Trading Oscillators (STO-B and STO-V)
