
Oil was certainly the big news. I had a friend ask me, "I heard that Oil prices have gone negative! What's that mean?!" As I told her, I'm not an expert...but, my understanding in a nutshell, is that the price of a barrel of Oil is now so low that producers are losing money every time they fill a barrel. A perfect storm brewed before the bear market got started with Russia and the Saudis butting heads regarding production and pricing. This ahem "contest" set up a large supply in Oil that demand wasn't prepared to digest. Then the virus hit and airlines were grounded, people were grounded, etc. causing demand to plummet to lows we never could've imagined. So here we are with more Oil than we can store or refine, facing an historic loss in demand.
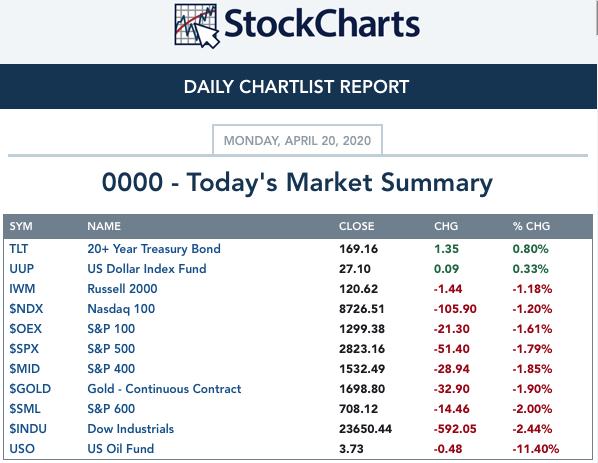
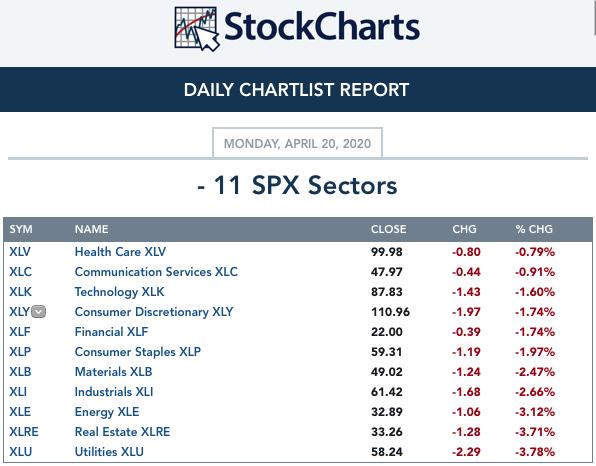
TODAY'S Broad Market Action:
Past WEEK Results: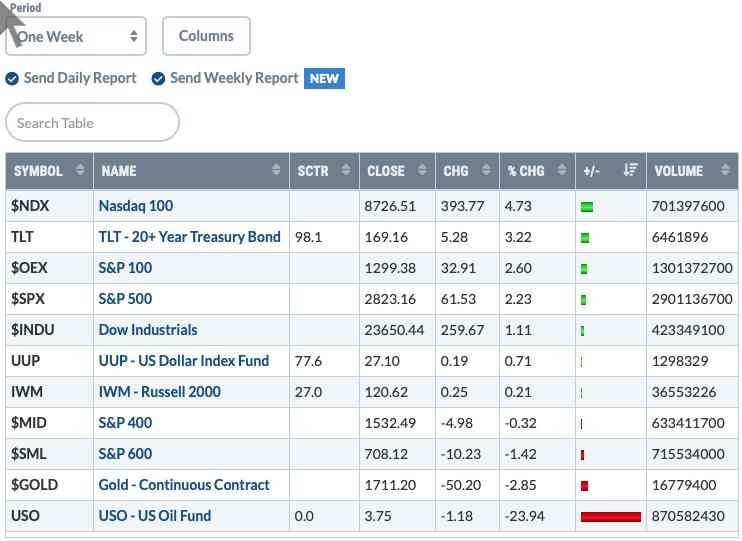
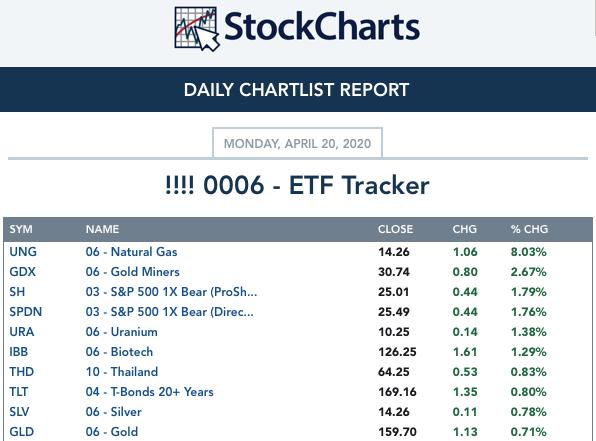
Top 10 from ETF Tracker:
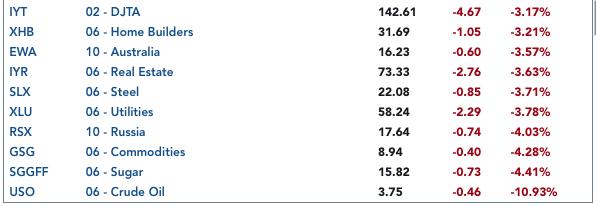
Bottom 10 from ETF Tracker:
On Friday, the DecisionPoint Alert Weekly Wrap presents an assessment of the trend and condition of the stock market (S&P 500), the U.S. Dollar, Gold, Crude Oil, and Bonds. Monday through Thursday the DecisionPoint Alert daily report is abbreviated and covers changes for the day.
Watch the latest episode of DecisionPoint on StockCharts TV's YouTube channel here!
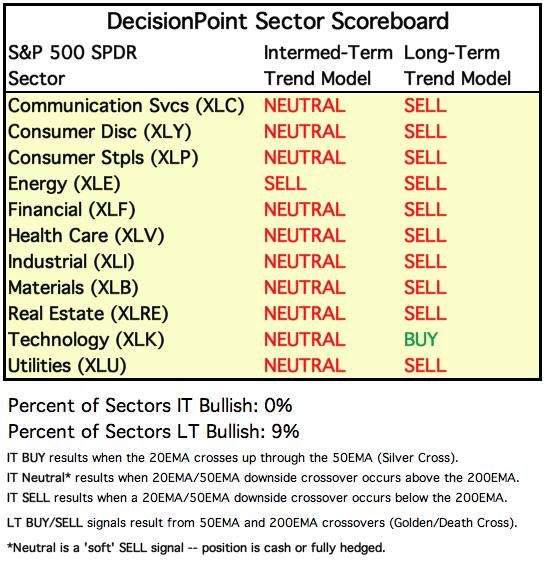
SECTORS
SIGNALS:
Each S&P 500 Index component stock is assigned to one, and only one, of 11 major sectors. This is a snapshot of the Intermediate-Term (Silver Cross) and Long-Term (Golden Cross) Trend Model signal status for those sectors.
TODAY'S RESULTS:
One WEEK Results: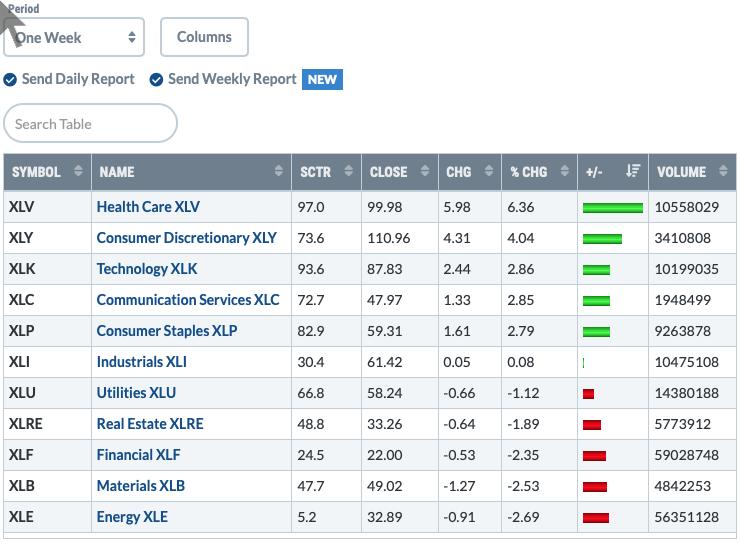
STOCKS
IT Trend Model: NEUTRAL as of 2/28/2020
LT Trend Model: SELL as of 3/19/2020
SPY Daily Chart: The market pulled back today, staying within the bearish rising wedge. I don't like that the market closed near the low today, but it is sitting on the 50-EMA which could provide support. The wedge pattern in a bear market environment is very dangerous. The good news is that the PMO seems undeterred in its rise and will be reaching positive territory soon. That's territory the PMO hasn't seen since the beginning of the virus crash. On a decline, it is somewhat encouraging to see lower volume. This is the first time since before the bear market panic that the SPY volume has been underneath its 250-EMA.
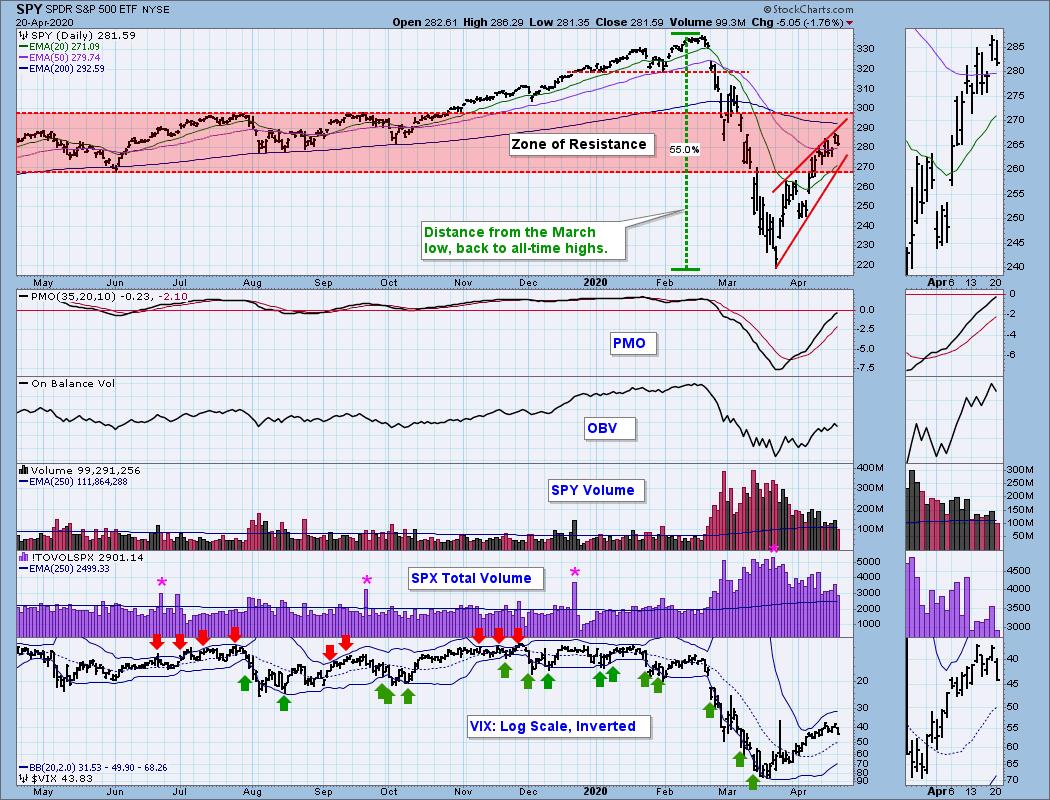
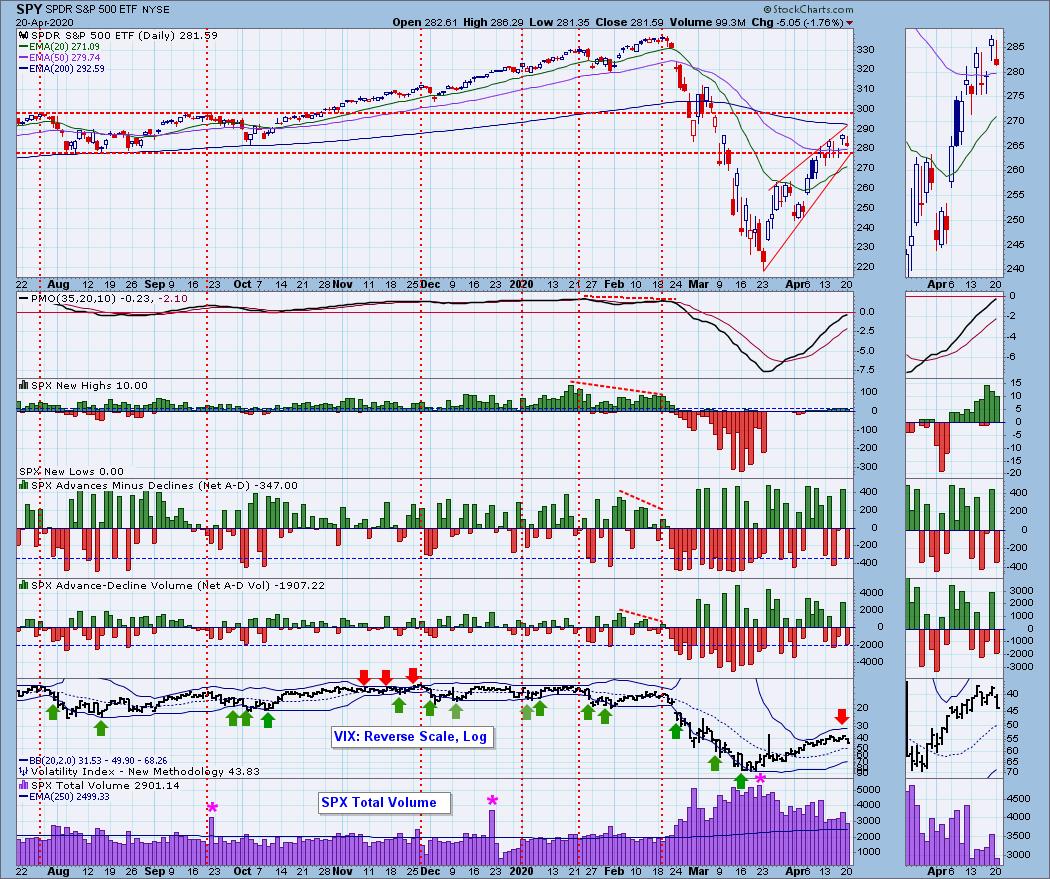
Climactic Market Indicators: Readings were somewhat climactic to the downside, but nothing that I can decipher one way or the other. The VIX is finally beginning to trend lower. That typically isn't good for the market in the short term.
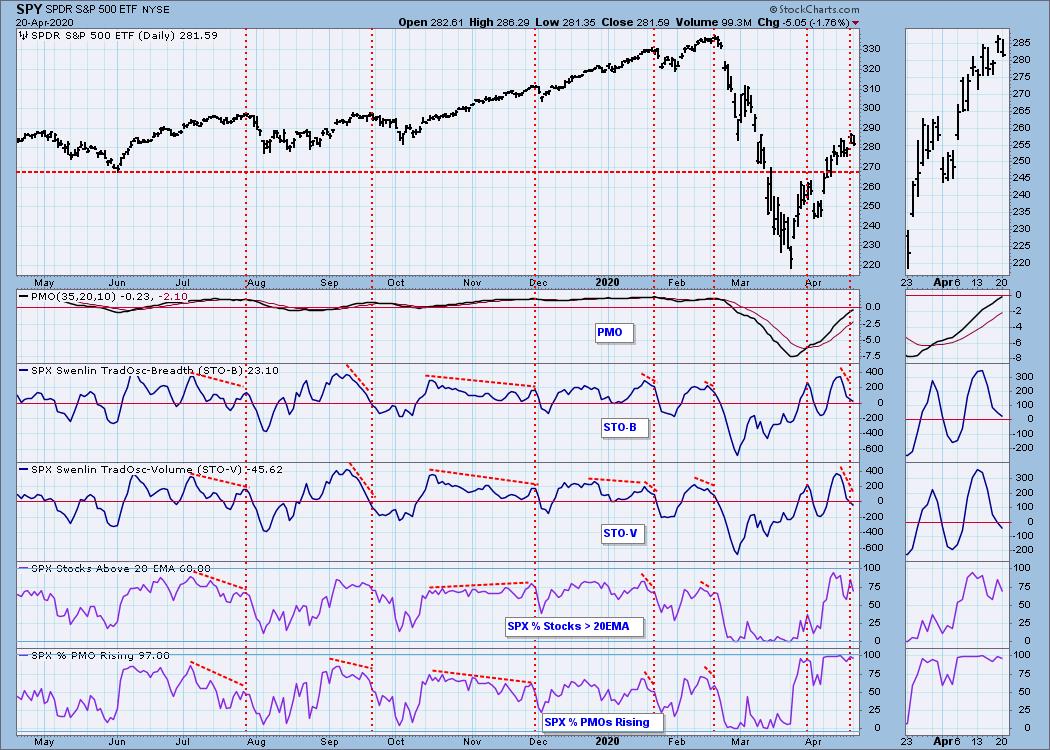
Short-Term Market Indicators: The ST trend is UP and the market condition is NEUTRAL based upon the Swenlin Trading Oscillator (STO) readings. I was pleasantly surprised to see the Swenlin Trading Oscillators decelerating on a market decline. We still have very overbought readings on %stocks > 20-EMA and %pmo rising.
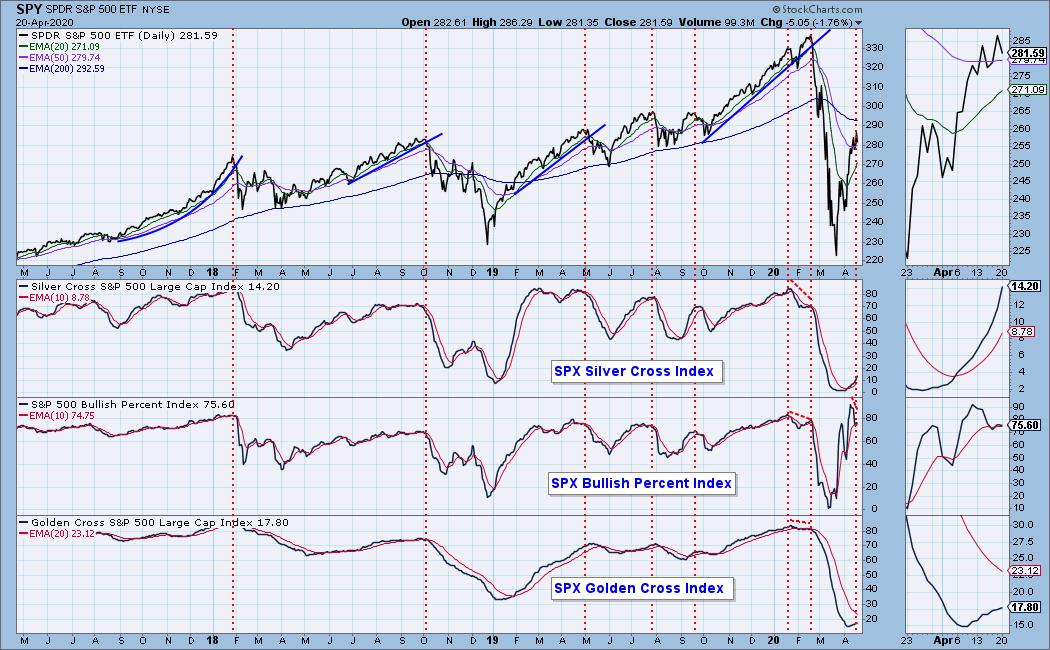
Intermediate-Term Market Indicators: The Silver Cross Index (% of SPX stocks 20EMA > 50EMA) and the Golden Cross Index (percent of SPX stocks 50EMA > 200EMA) are both rising. The BPI has begun to twitch with indecision which isn't helpful. I do like the recovery of both the SCI and GCI.
These indicators are rising nicely and both the ITBM and ITVM are in positive territory.
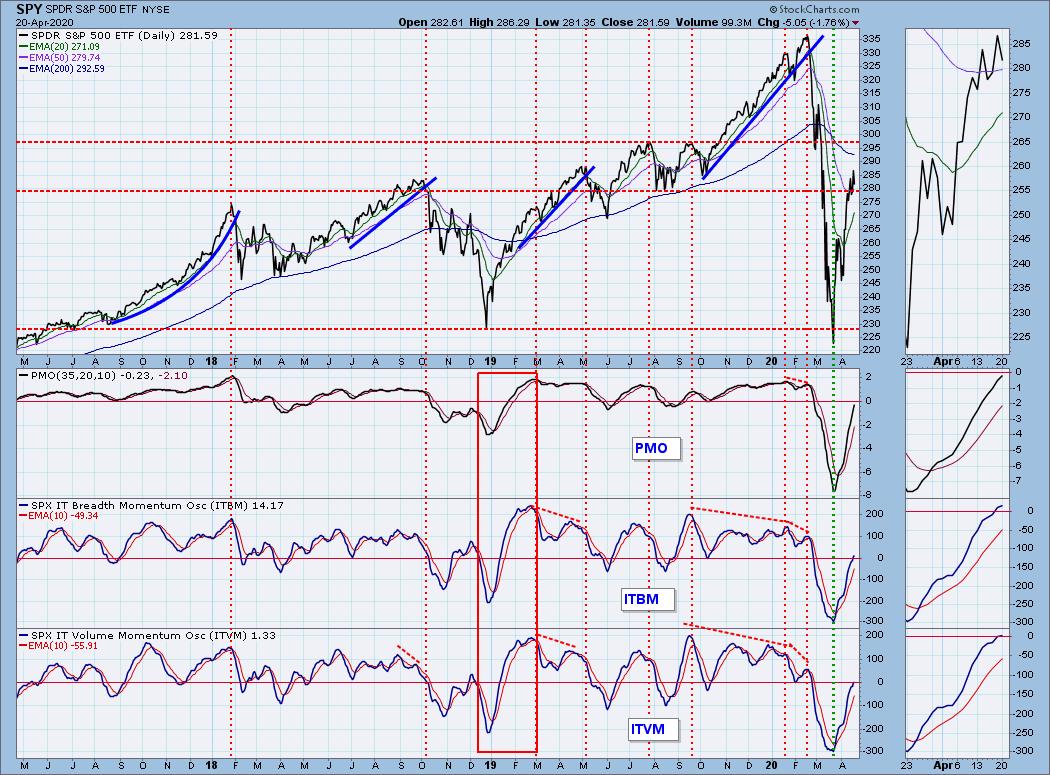
CONCLUSION: The ST is UP and IT trend is also UP. Market condition based on ST indicators and IT indicators is NEUTRAL. Neutral conditions on indicators isn't that helpful. In the short term, I'm cautious given the VIX readings rising and the STOs still declining. Intermediate term overall are positive and the STOs are decelerating so any decline we catch in the short-term shouldn't be devastating.
(Not a Diamonds subscriber? Add it to your DP Alert subscription and get a discount! Contact support@decisionpoint.com for your limited time coupon code!)
DOLLAR (UUP)
IT Trend Model: BUY as of 3/12/2020
LT Trend Model: BUY as of 5/25/2018
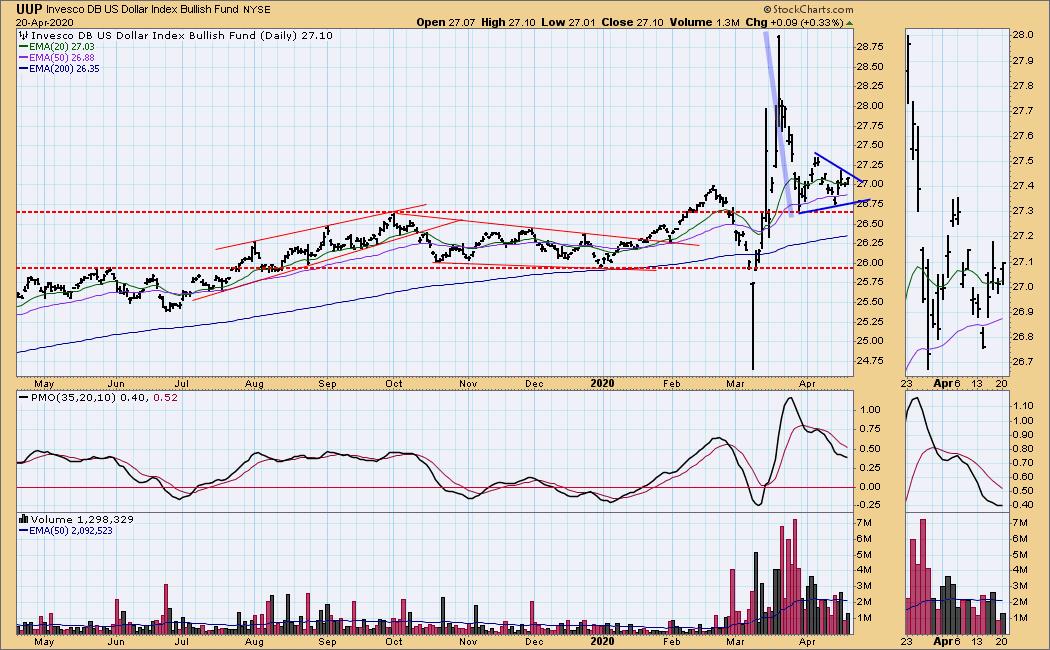
UUP Daily Chart: I see a bearish reverse flag and pennant. The PMO is trying to turn up, but overall it is in decline. I would expect to see the pennant resolve downward.
GOLD
IT Trend Model: BUY as of 12/26/2019
LT Trend Model: BUY as of 1/8/2019
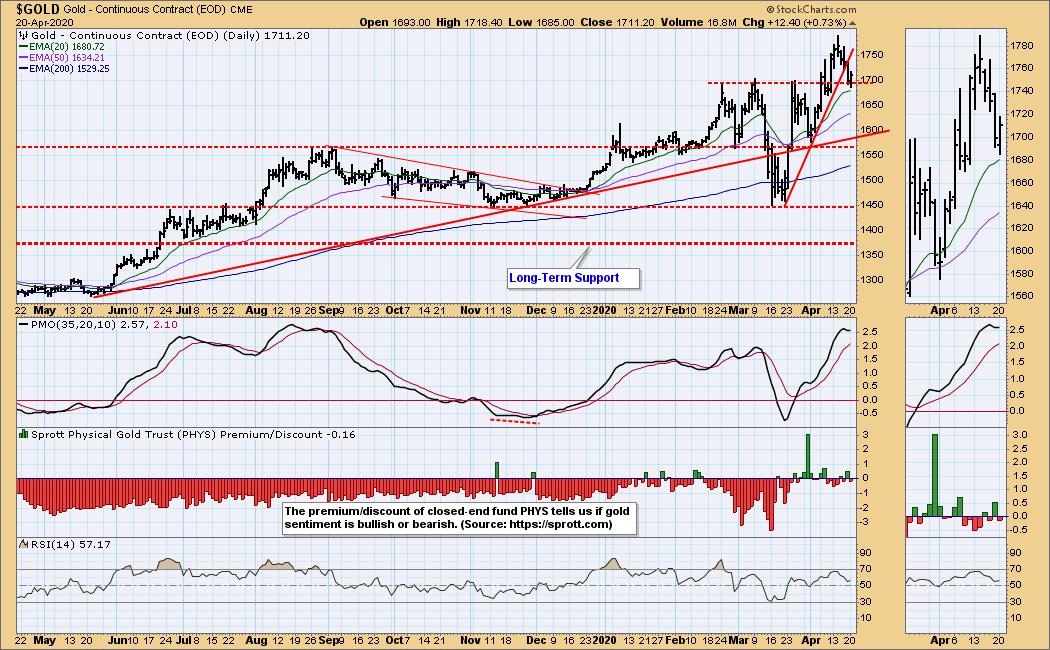
GOLD Daily Chart: Gold pulled back to 1700 and found support. Today it was up 0.73%. The PMO stopped in its tracks and is trying to turn back up in overbought territory. I'm cautiously optimistic that Gold will hold 1700.
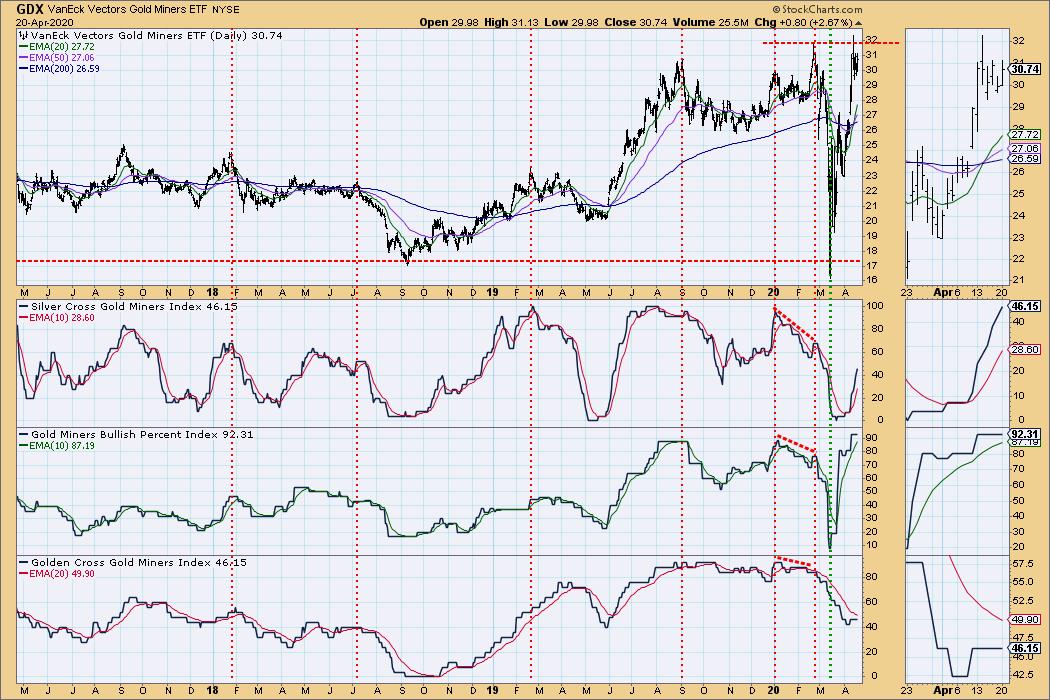
GOLD MINERS Golden and Silver Cross Indexes: Gold Miners are continuing to digest a massive rally. The improvement on the Silver Cross Index is good, but I keep waiting for the Gold Cross Index to put in a bottom. It's close. In the thumbnail, you can see a flag formation, so I'm looking for an upside breakout.
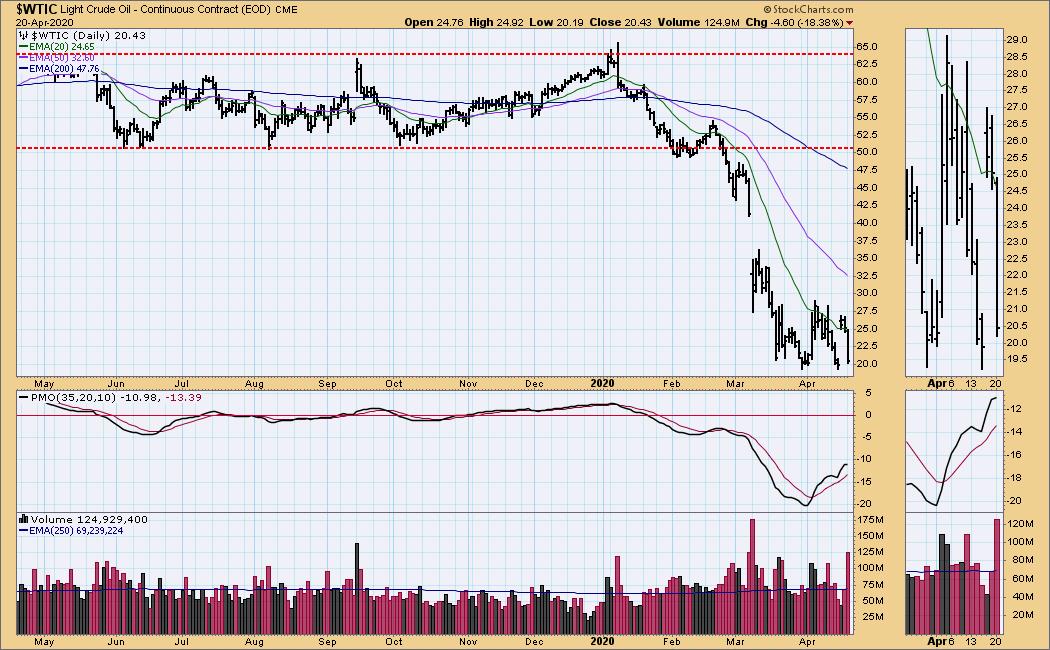
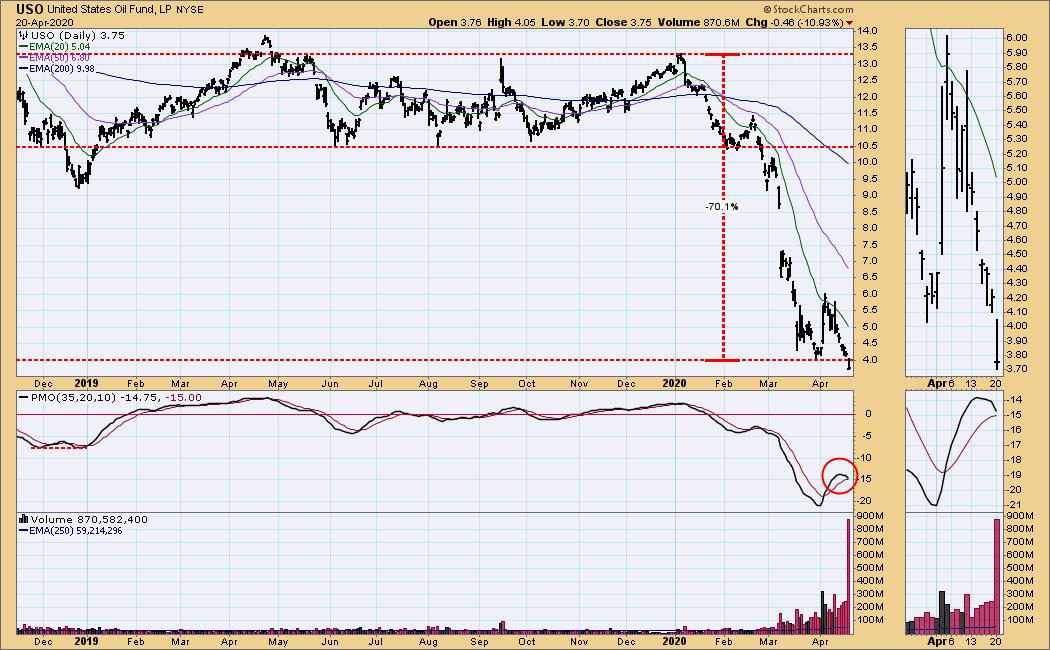
CRUDE OIL (USO)
IT Trend Model: Neutral as of 1/27/2020
LT Trend Model: SELL as of 2/3/2020
USO Daily Chart: I put my fingers too close to the flame on USO and was quickly burned as the early April rally faltered. I've not been back since and I won't be. We are at all-time lows on USO. The PMO is very negative and closing in on a crossover SELL signal. Volume on today's decline was massive. This could be a capitulation phase, but I don't see any relief ahead until demand begins to grow again.
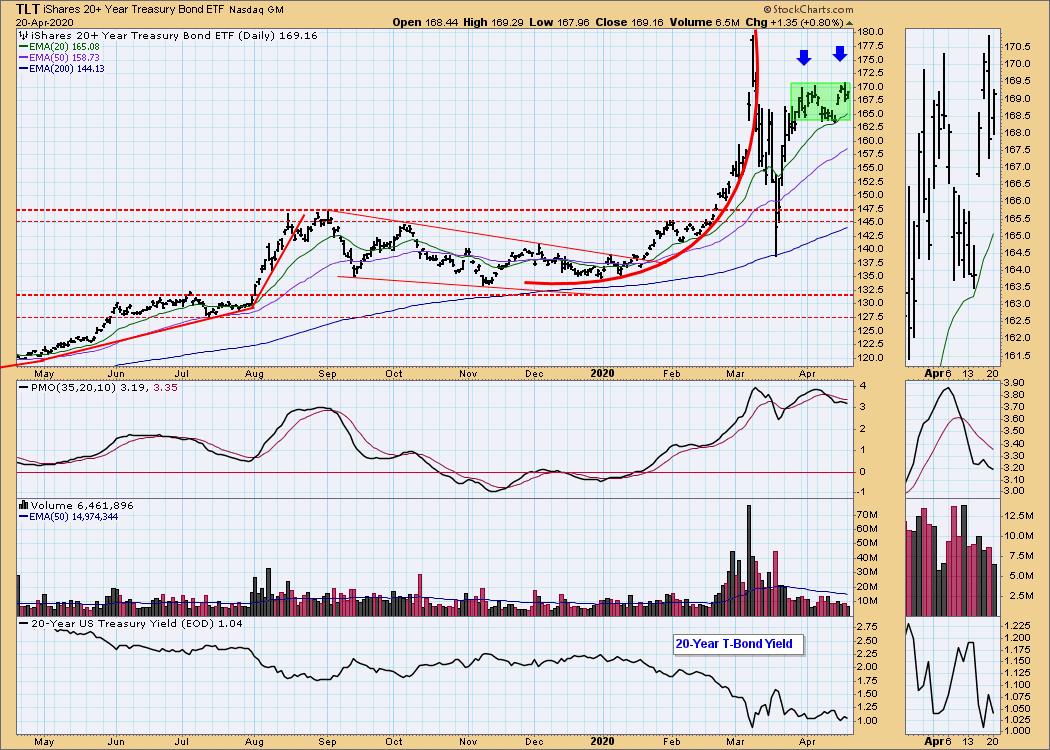
BONDS (TLT)
IT Trend Model: BUY as of 1/22/2020
LT Trend Model: BUY as of 1/2/2019
TLT Daily Chart: The PMO is moving lower after topping below its signal line. I find tops below the signal line to be especially bearish. We may be seeing a bearish double-top forming.
Have you subscribed the DecisionPoint Diamonds yet? DP does the work for you by providing handpicked stocks/ETFs from exclusive DP scans! Add it with a discount! Contact support@decisionpoint.com for more information!
Technical Analysis is a windsock, not a crystal ball.
Happy Charting! - Erin
Email: erin@decisionpoint.com

Erin Swenlin will be presenting at the The MoneyShow Las Vegas August 16 - 20 at Bally's/Paris Resort! You'll have an opportunity to meet Erin and discuss the latest DecisionPoint news and Diamond Scans. Claim your FREE pass here! You can watch online with this pass too!! There will be online events held in May and when I have more information I'll let you know.
NOTE: The signal status reported herein is based upon mechanical trading model signals, specifically, the DecisionPoint Trend Model. They define the implied bias of the price index based upon moving average relationships, but they do not necessarily call for a specific action. They are information flags that should prompt chart review. Further, they do not call for continuous buying or selling during the life of the signal. For example, a BUY signal will probably (but not necessarily) return the best results if action is taken soon after the signal is generated. Additional opportunities for buying may be found as price zigzags higher, but the trader must look for optimum entry points. Conversely, exit points to preserve gains (or minimize losses) may be evident before the model mechanically closes the signal.
Helpful DecisionPoint Links (Can Be Found on DecisionPoint.com Links Page):
DecisionPoint Shared ChartList and DecisionPoint Chart Gallery
Price Momentum Oscillator (PMO)
Swenlin Trading Oscillators (STO-B and STO-V)