
I received an email today from a confused reader. He was finding that the DP Alert was contradicting itself between the signals, conditions and commentary. I thought it might be a good time to explain the format of the DPA. DecisionPoint has mechanical DP Trend Model signals that are drawn from 20/50/200-EMA crossovers. Those are given at the top of each section. In the indicator sections, I will list what the ST or IT trend currently is (UP or DOWN). This is based on rising bottoms and declining tops within each timeframe. Then we list the "condition" of the market as overbought, neutral or oversold. The condition is determined by the location of the various indicators in those timeframes. Many times they may appear to 'disagree' with each other. It is simply informational. My commentary follows and that may not jibe with the mechanical indicators or signals. These signals and indicators are not very useful on their own. The commentary is where the rich content is (if I do say so myself!). It will put all of the signals, indicators and trend/condition into perspective.
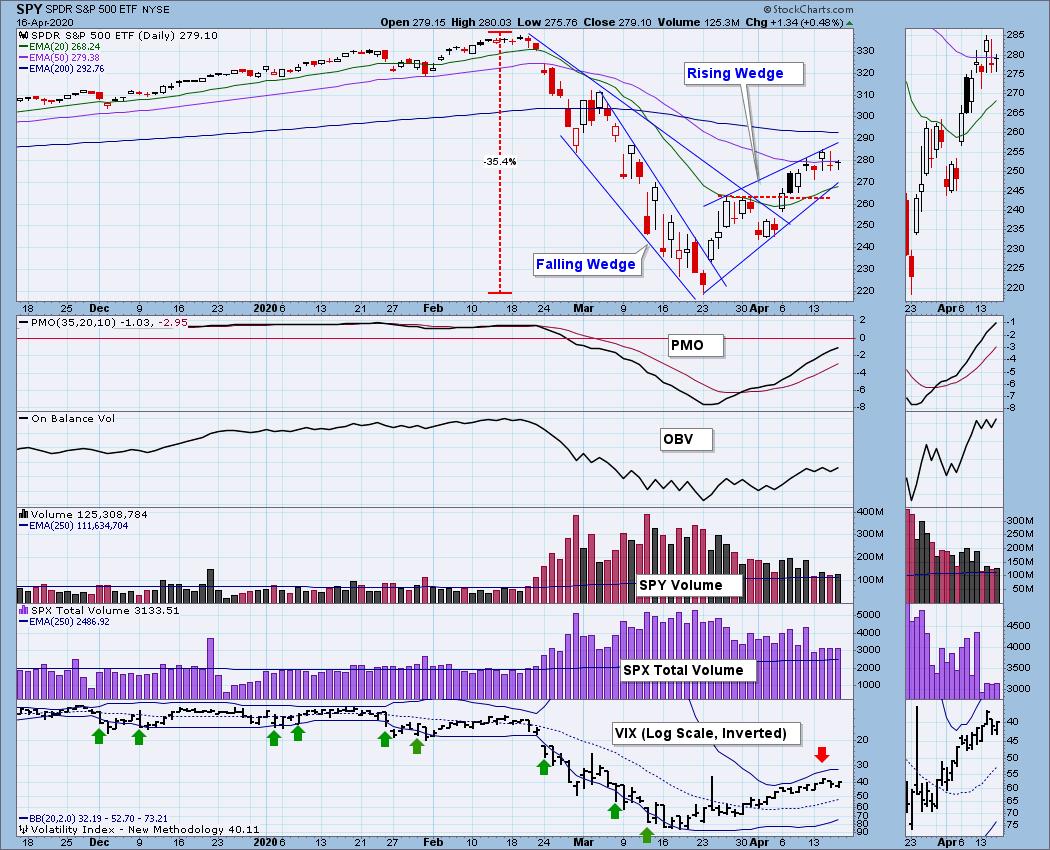
Carl texted me and let me know that Dow Futures are up. As of this publishing/writing, the Nasdaq and S&P 500 futures are up around 2.5% apparently on news of reopening parts of the economy. I hadn't reviewed the indicators yet, but I wasn't surprised to see the Swenlin Trading Oscillators giving us signals once again. I don't like to analyze based on the news, but I'd say with the current environment I will. I have been looking for a pullback and technically I still think it is a valid conclusion based on the rising wedge.
Tomorrow is options expiration. Typically you can settle in for a high volume but low volatility trading day as you cruise into the weekend. Given what futures are doing and the news that might be propelling it, we could see more price movement than usual.
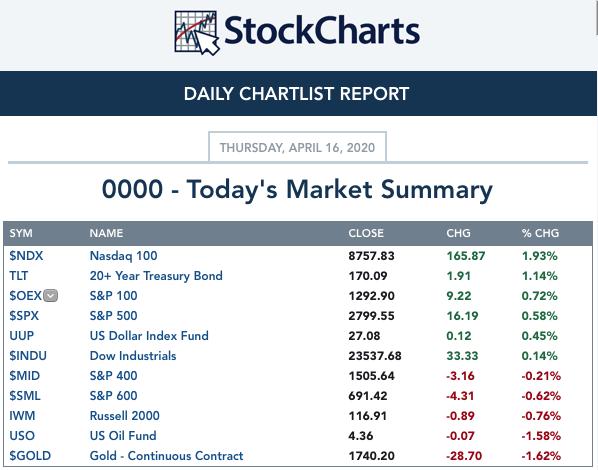
TODAY'S Broad Market Action:
Past WEEK Results: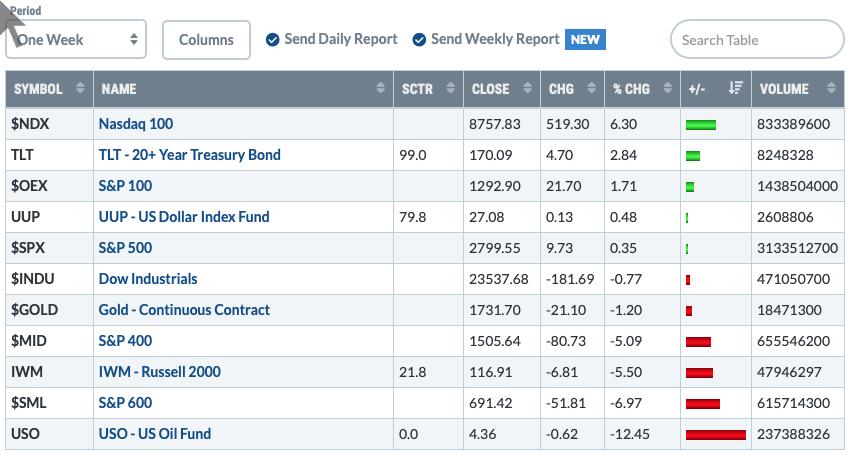
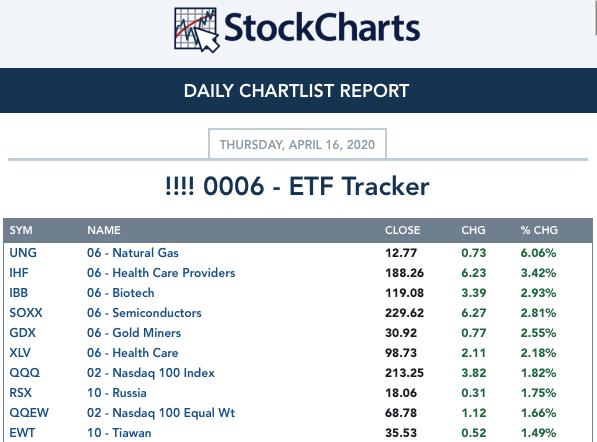
Top 10 from ETF Tracker:
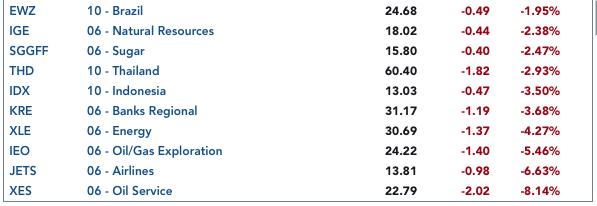
Bottom 10 from ETF Tracker:
On Friday, the DecisionPoint Alert Weekly Wrap presents an assessment of the trend and condition of the stock market (S&P 500), the U.S. Dollar, Gold, Crude Oil, and Bonds. Monday through Thursday the DecisionPoint Alert daily report is abbreviated and covers changes for the day.
Watch the latest episode of DecisionPoint on StockCharts TV's YouTube channel here!
SECTORS
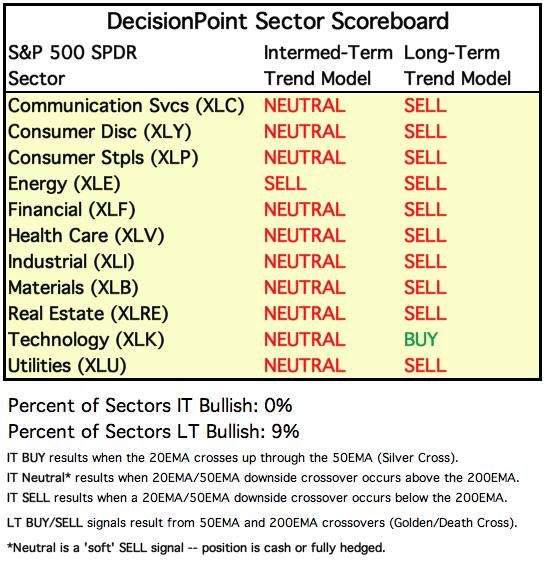
SIGNALS:
Each S&P 500 Index component stock is assigned to one, and only one, of 11 major sectors. This is a snapshot of the Intermediate-Term (Silver Cross) and Long-Term (Golden Cross) Trend Model signal status for those sectors.
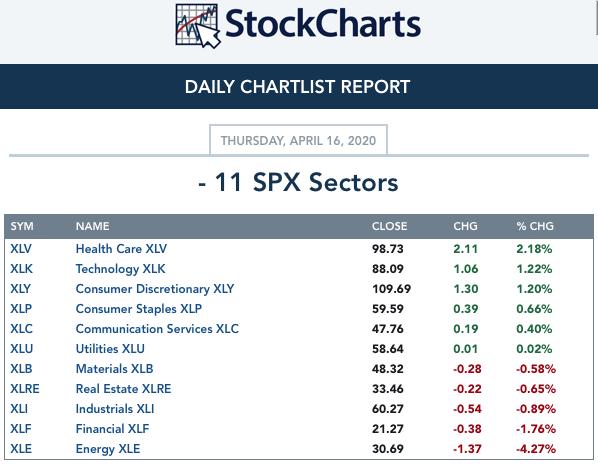
TODAY'S RESULTS:
One WEEK Results: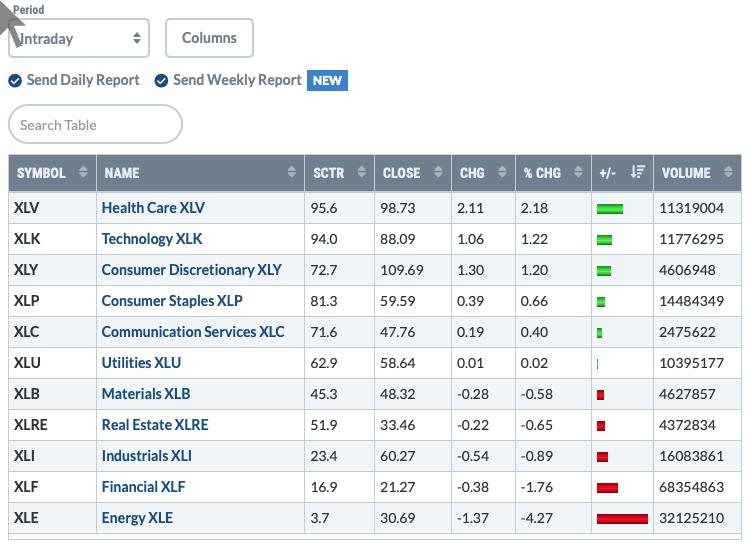
It is interesting to note that defensive sectors are in the lead. Technology is becoming a defensive sector in this new coronavirus world and online retail is pulling the Consumer Discretionary sector higher.
STOCKS
IT Trend Model: NEUTRAL as of 2/28/2020
LT Trend Model: SELL as of 3/19/2020
SPY Daily Chart: The PMO is rising nicely and volume was about the same as we've seen. Nothing climactic. The VIX has topped on the inverse scale and that generally is bearish.
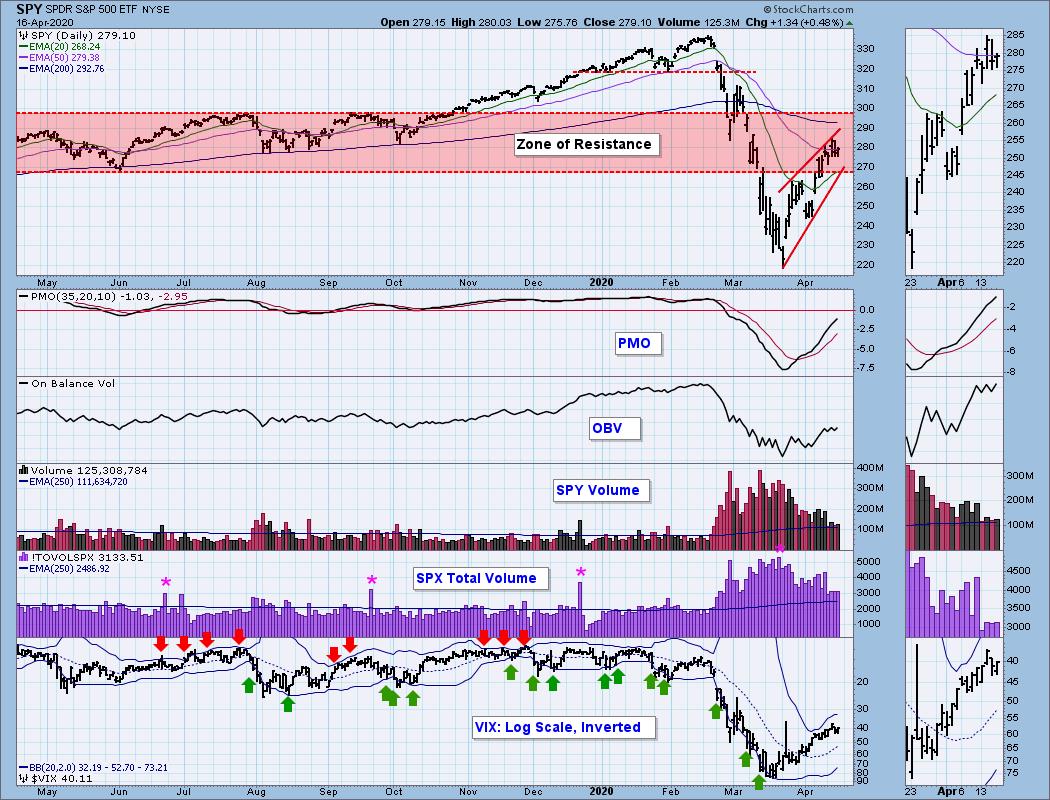
Climactic Market Indicators: No climactic readings, so not much to say. I do notice what looks like a hammer candlestick today and that generally is a one-day signal for an upside move the next day.
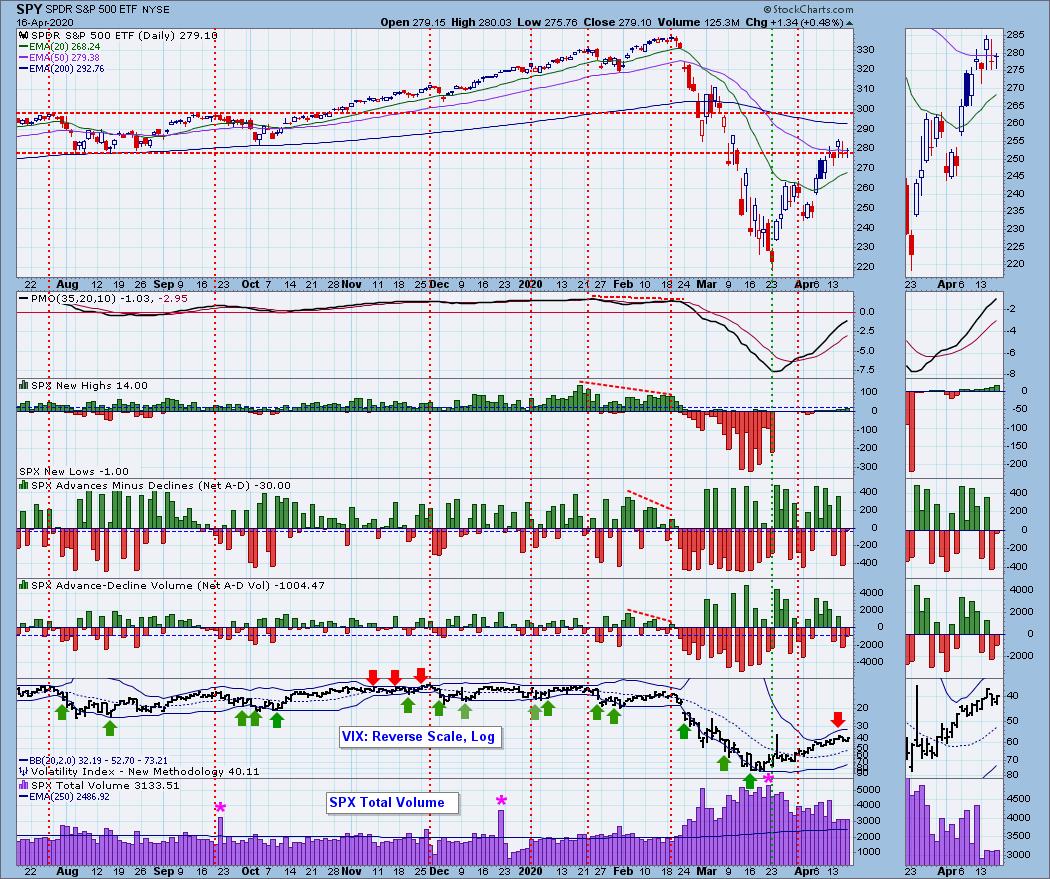
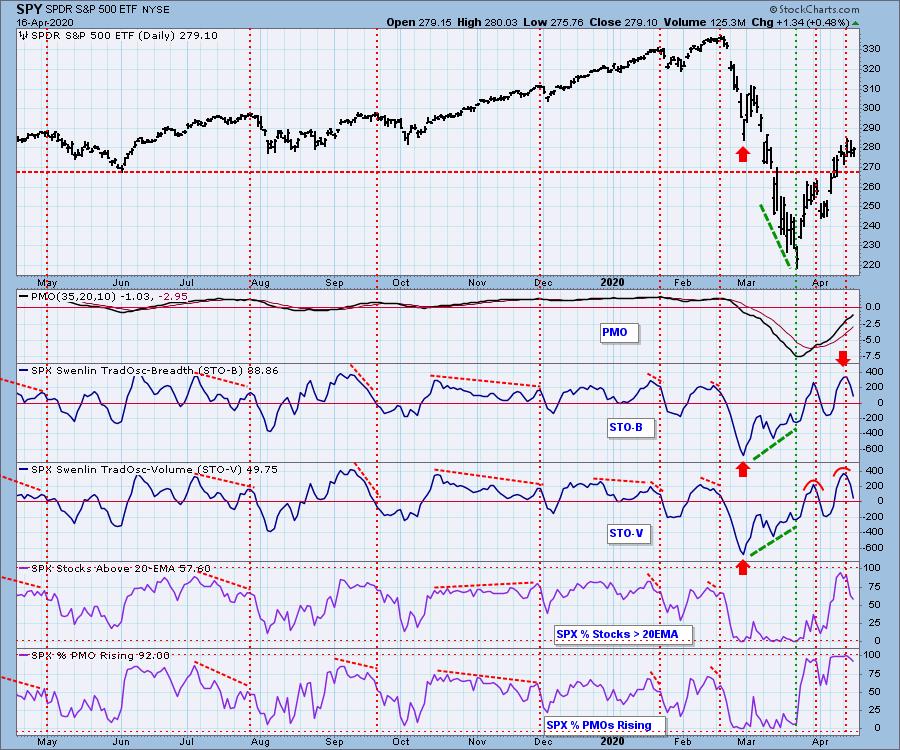
Short-Term Market Indicators: The ST trend is UP and the market condition is NEUTRAL based upon the Swenlin Trading Oscillator (STO) readings. Wow, these indicators dove lower today, completely leaving overbought territory. I find this to be positive as those conditions have been relieved. Rising tops on this indicator prevented a negative divergence with price. I am still thinking we might see a retest of 270 after the initial news of reopening of economy blows over. There are bigger more sinister underlying issues that will weigh very heavy on the economy and the market.
Intermediate-Term Market Indicators: The Silver Cross Index (% of SPX stocks 20EMA > 50EMA) and the Golden Cross Index (percent of SPX stocks 50EMA > 200EMA) are both rising. The BPI had a negative crossover today. Last time it didn't amount to much as far as follow-on price movement. The divergences are more powerful and I'm not seeing any right now.
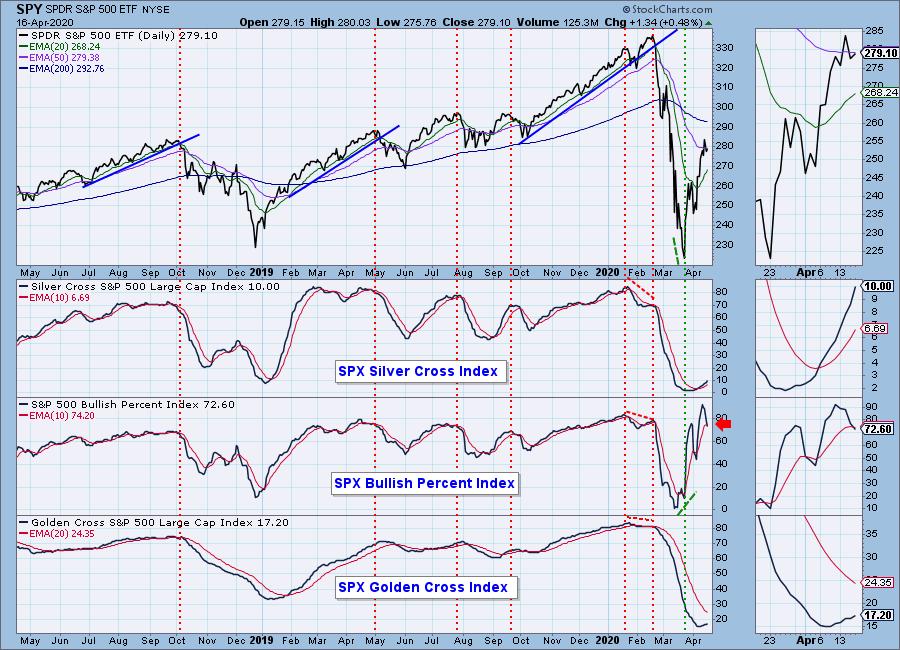
These indicators in all honesty look every bit as good as they did coming out of the 2018 bear market. I am still not satisfied that we won't go back down and test this bear market low, but these indicators tell me it won't likely happen in the intermediate term.
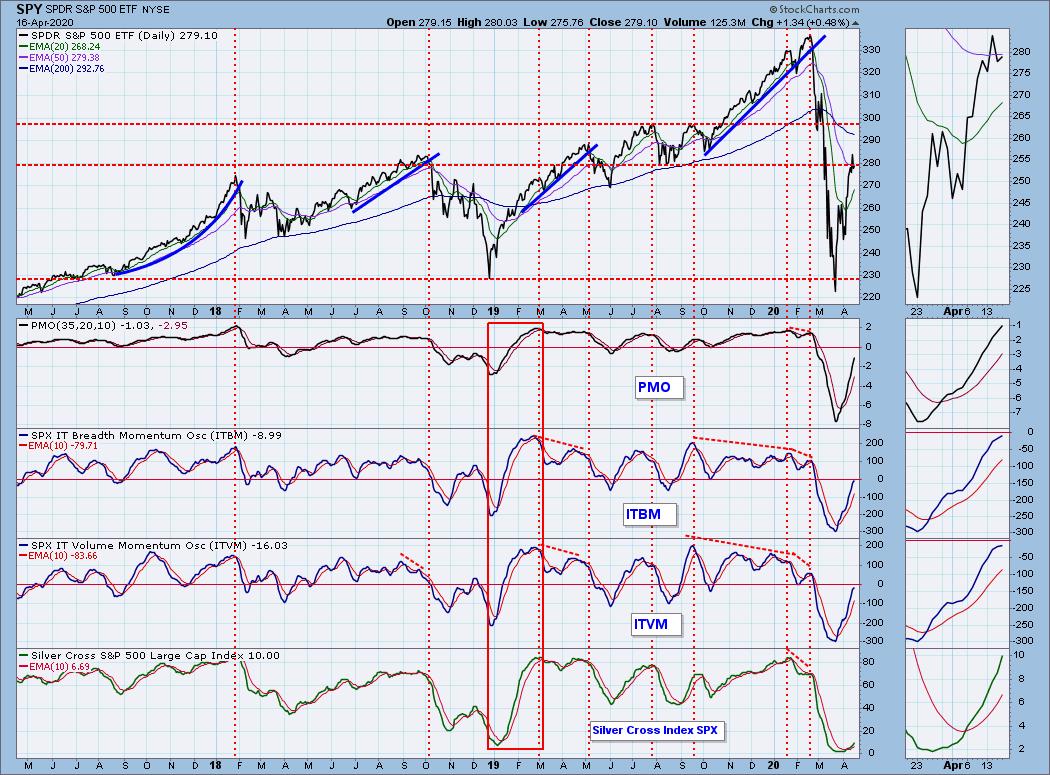
CONCLUSION: The ST is UP and IT trend is also UP. Market condition based on ST indicators and IT indicators is NEUTRAL. The Swenlin Trading Oscillators have moved quickly into neutral territory, clearing overbought conditions on a rally. I see that as constructive decompression. I don't generally base my opinion on news or futures, but I'm making an exception tonight. Even if we have a pullback, I know I'm holding into it but managing each of my positions carefully as I proceed.
(Not a Diamonds subscriber? Add it to your DP Alert subscription and get a discount! Contact support@decisionpoint.com for your limited time coupon code!)
DOLLAR (UUP)
IT Trend Model: BUY as of 3/12/2020
LT Trend Model: BUY as of 5/25/2018
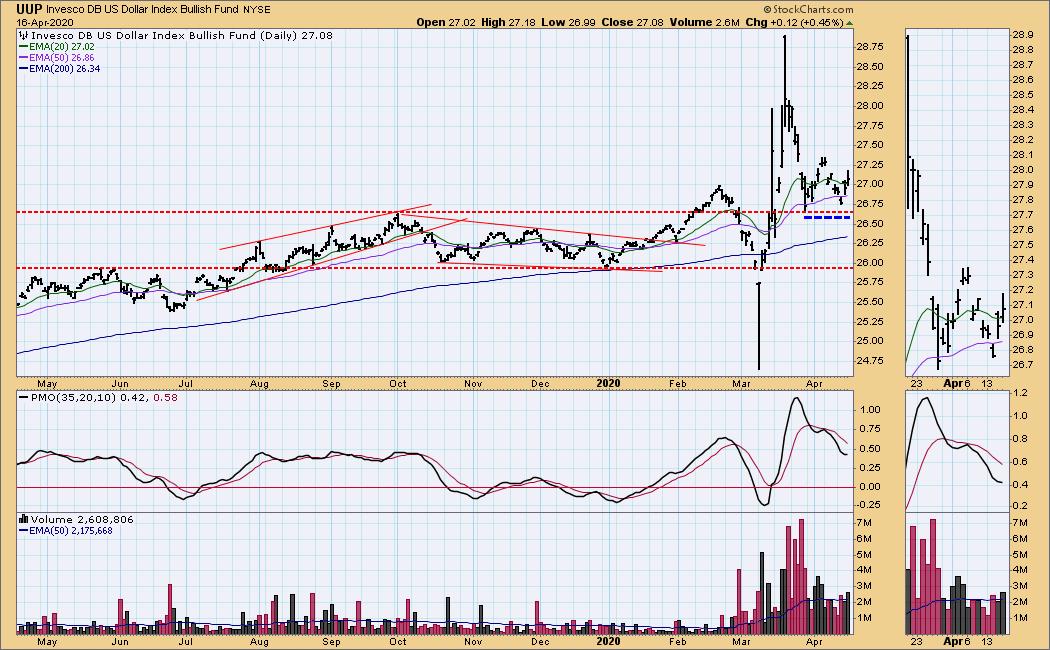
UUP Daily Chart: Looks like a bullish double-bottom now on the Dollar. The PMO is decelerating and wants to rise. Higher prices seem likely.
GOLD
IT Trend Model: BUY as of 12/26/2019
LT Trend Model: BUY as of 1/8/2019
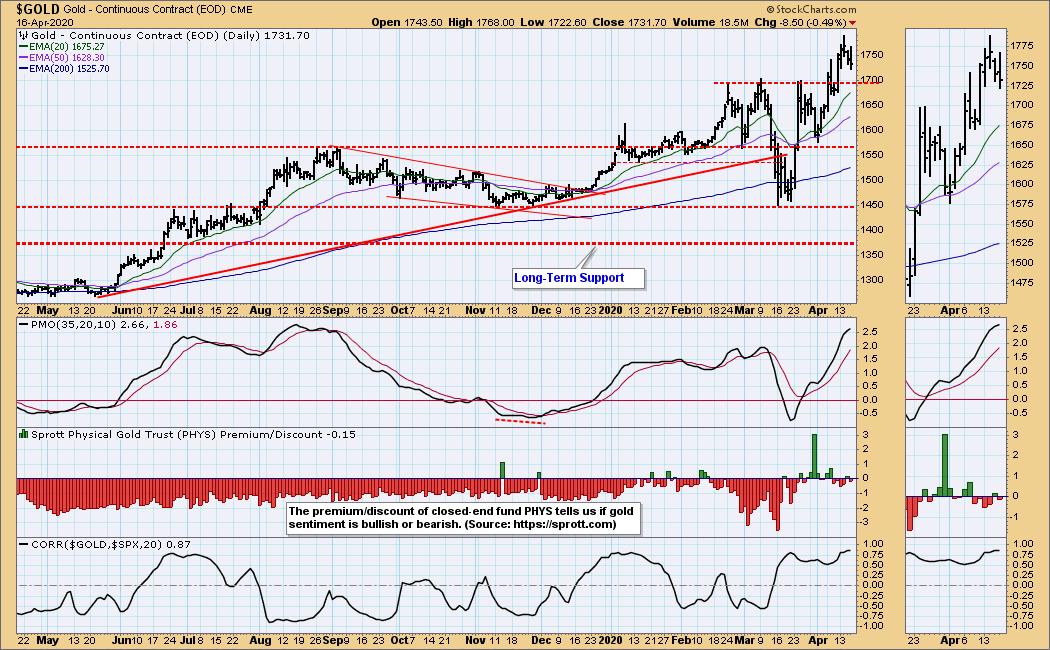
GOLD Daily Chart: The PMO on Gold is beginning to decelerate in overbought territory. If the Dollar begins to rise short-term as its chart implies, that will put downside pressure on Gold. I don't see the bottom falling out. 1700 or the 20-EMA will be the likely areas of support.
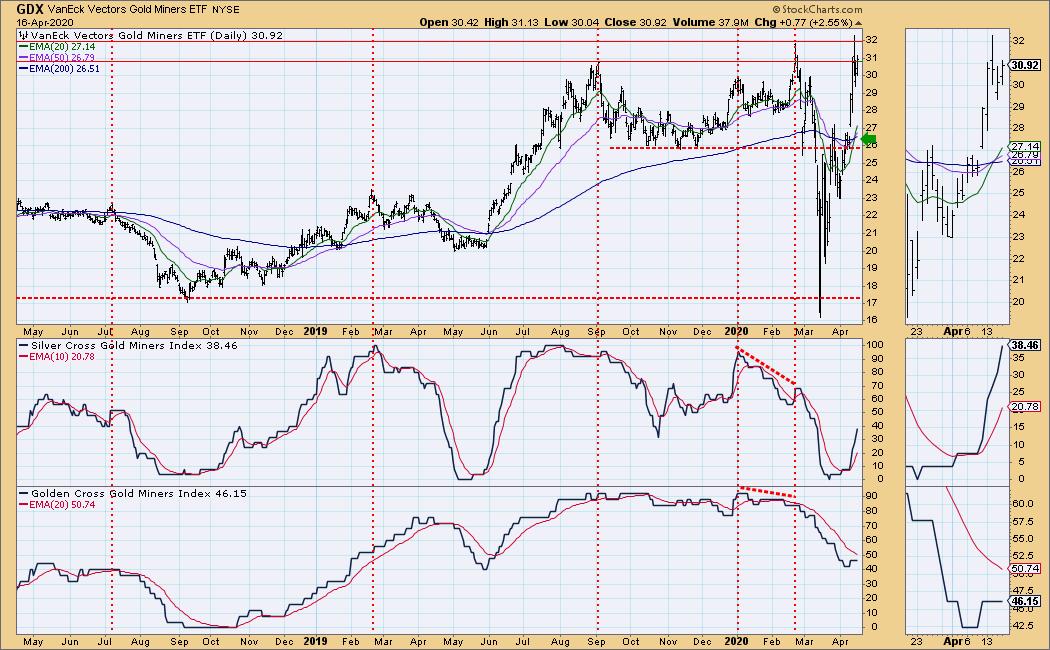
GOLD MINERS Golden and Silver Cross Indexes: Gold Miners are digesting the massive rally. They have just triggered Silver and Golden Crosses which gives them an IT Trend Model BUY signal and LT Trend Model BUY signal. We could be looking at a bull flag.
CRUDE OIL (USO)
IT Trend Model: Neutral as of 1/27/2020
LT Trend Model: SELL as of 2/3/2020
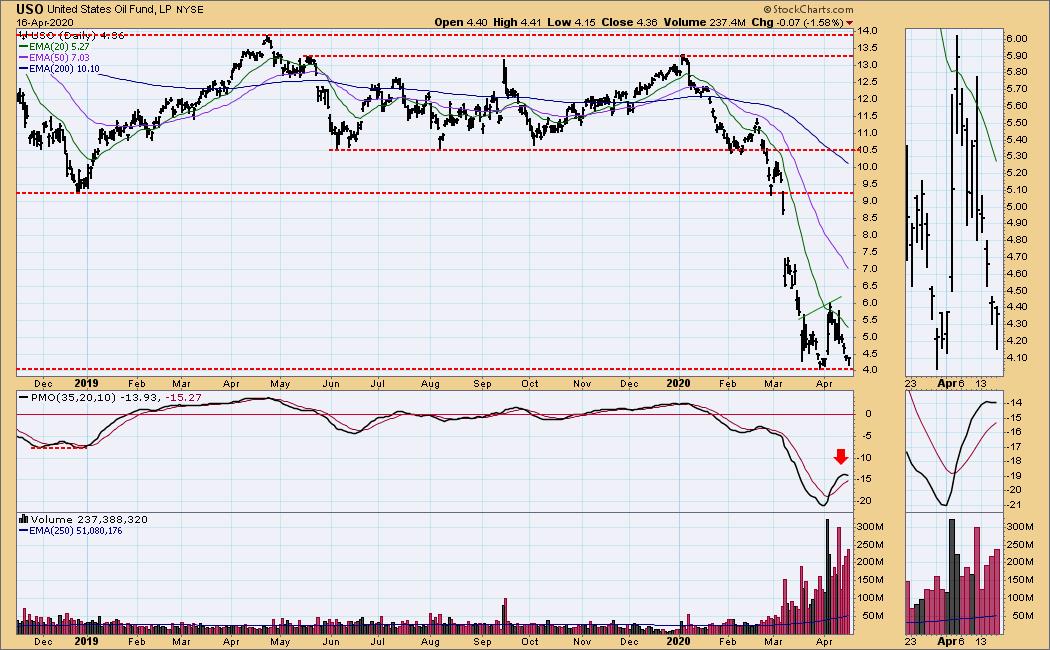
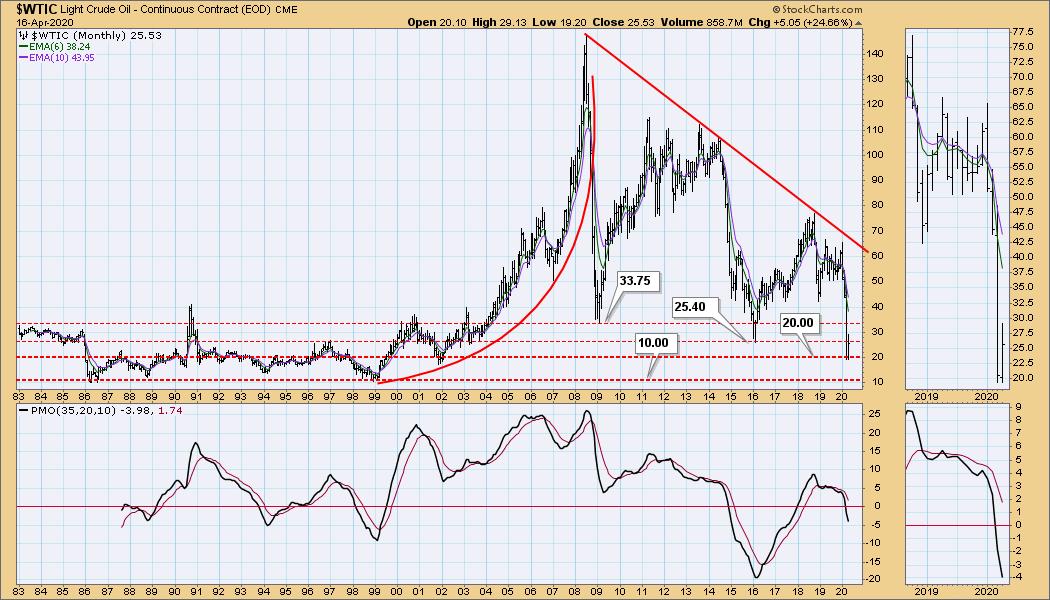
USO Daily Chart: Price is now beginning to flirt with the $4 support area. I previously had been eyeing USO for another shot at an entry, but the news regarding Oil and Gas is extraordinarily negative right now between low demand a supply gluts. I wouldn't mess with it right now. The PMO is turning over well below the zero line and that isn't good either.
BONDS (TLT)
IT Trend Model: BUY as of 1/22/2020
LT Trend Model: BUY as of 1/2/2019
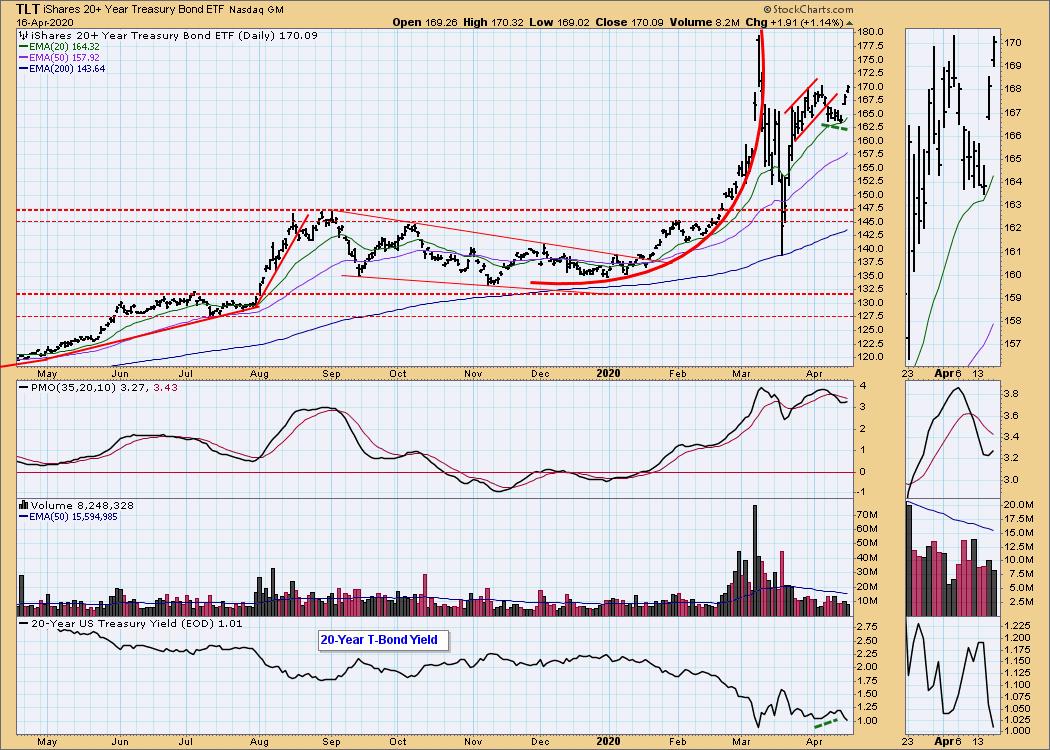
TLT Daily Chart: The PMO has now turned back up on the two gap up days. Overhead resistance is now coming along the earlier April top. The PMO is very overbought so that short-term resistance may hold tight.
Have you subscribed the DecisionPoint Diamonds yet? DP does the work for you by providing handpicked stocks/ETFs from exclusive DP scans! Add it with a discount! Contact support@decisionpoint.com for more information!
Technical Analysis is a windsock, not a crystal ball.
Happy Charting! - Erin
Email: erin@decisionpoint.com
Erin Swenlin will be presenting at the The MoneyShow Las Vegas August 16 - 20 at Bally's/Paris Resort! You'll have an opportunity to meet Erin and discuss the latest DecisionPoint news and Diamond Scans. Claim your FREE pass here! You can watch online with this pass too!! There will be online events held in May and when I have more information I'll let you know.
NOTE: The signal status reported herein is based upon mechanical trading model signals, specifically, the DecisionPoint Trend Model. They define the implied bias of the price index based upon moving average relationships, but they do not necessarily call for a specific action. They are information flags that should prompt chart review. Further, they do not call for continuous buying or selling during the life of the signal. For example, a BUY signal will probably (but not necessarily) return the best results if action is taken soon after the signal is generated. Additional opportunities for buying may be found as price zigzags higher, but the trader must look for optimum entry points. Conversely, exit points to preserve gains (or minimize losses) may be evident before the model mechanically closes the signal.
Helpful DecisionPoint Links (Can Be Found on DecisionPoint.com Links Page):
DecisionPoint Shared ChartList and DecisionPoint Chart Gallery
Price Momentum Oscillator (PMO)
Swenlin Trading Oscillators (STO-B and STO-V)
