
From the all-time highs in February to the bear market lows (so far) on Monday the market (SPY) has fallen -35%. Since that low, the market rallied +20% in four days, so only another +15% before we make up all the losses, right? Err, no. We need a total rally of +55% from the low before we get back all the losses, because the arithmetic is different going up -- the distance is the same, but the divisor is smaller. In any case, we're close to a wide zone of resistance, which will surely slow the market down. This zone is not necessarily more difficult to penetrate, it's just that there is a lot of congestion on the left side of the chart.
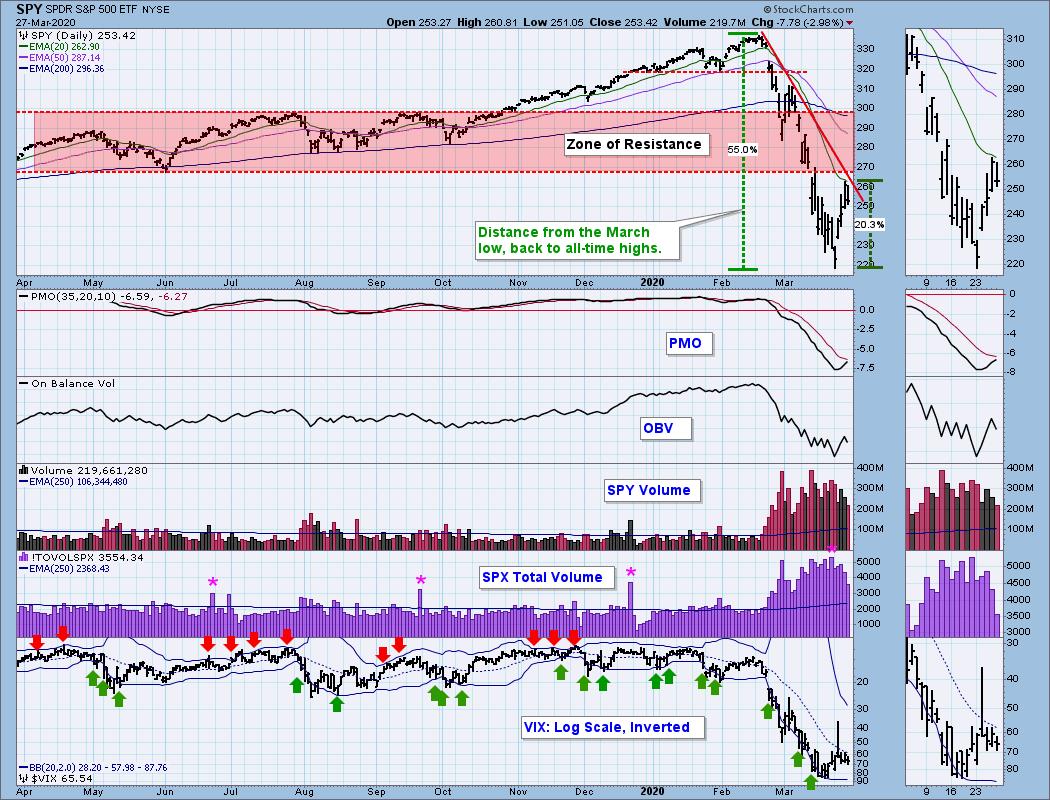
If the recent advance were measured +20% from close to close, it would technically be a new bull market, but I doubt that I'll be thinking bull market, even if the rally continues beyond +20%. I'm a "glass half empty" kind of guy in the best of times, and in these times I'll be reminding everyone that the water remaining in the glass is evaporating!
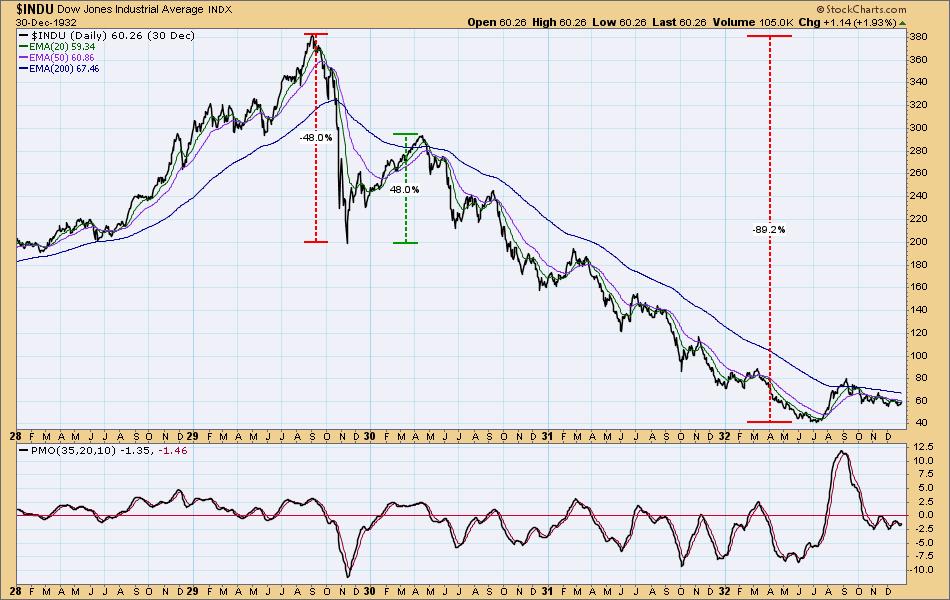
I have heard comments comparing the current bear market to the 1929-1932 Bear Market, and in terms of magnitude I think this is not out of the question. So that you will have a frame of reference, I am including a chart of those interesting times. It is notable that the first leg down (-48%) took only about 10 weeks. Also notable was the five-month +48% rally that came next. Only about 90 years has passed, and human nature will not have evolved in any significant way since then. As they say, history doesn't repeat, but it rhymes.
The DecisionPoint Alert Weekly Wrap presents an end-of-week assessment of the trend and condition of the Stock Market, the U.S. Dollar, Gold, Crude Oil, and Bonds. The DecisionPoint Alert daily report (Monday through Thursday) is abbreviated and gives updates on the Weekly Wrap assessments.
Watch the latest episode of DecisionPoint on StockCharts TV's YouTube channel here!
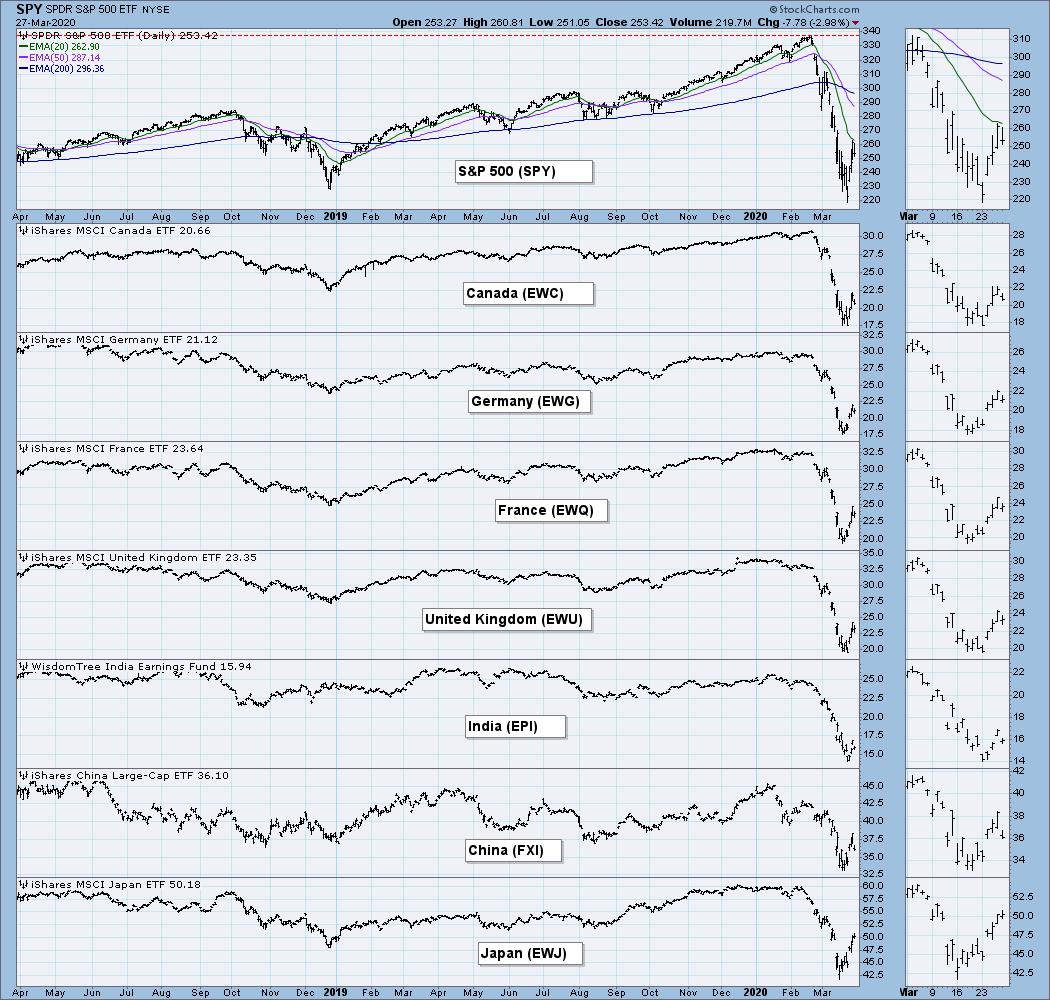
GLOBAL MARKETS
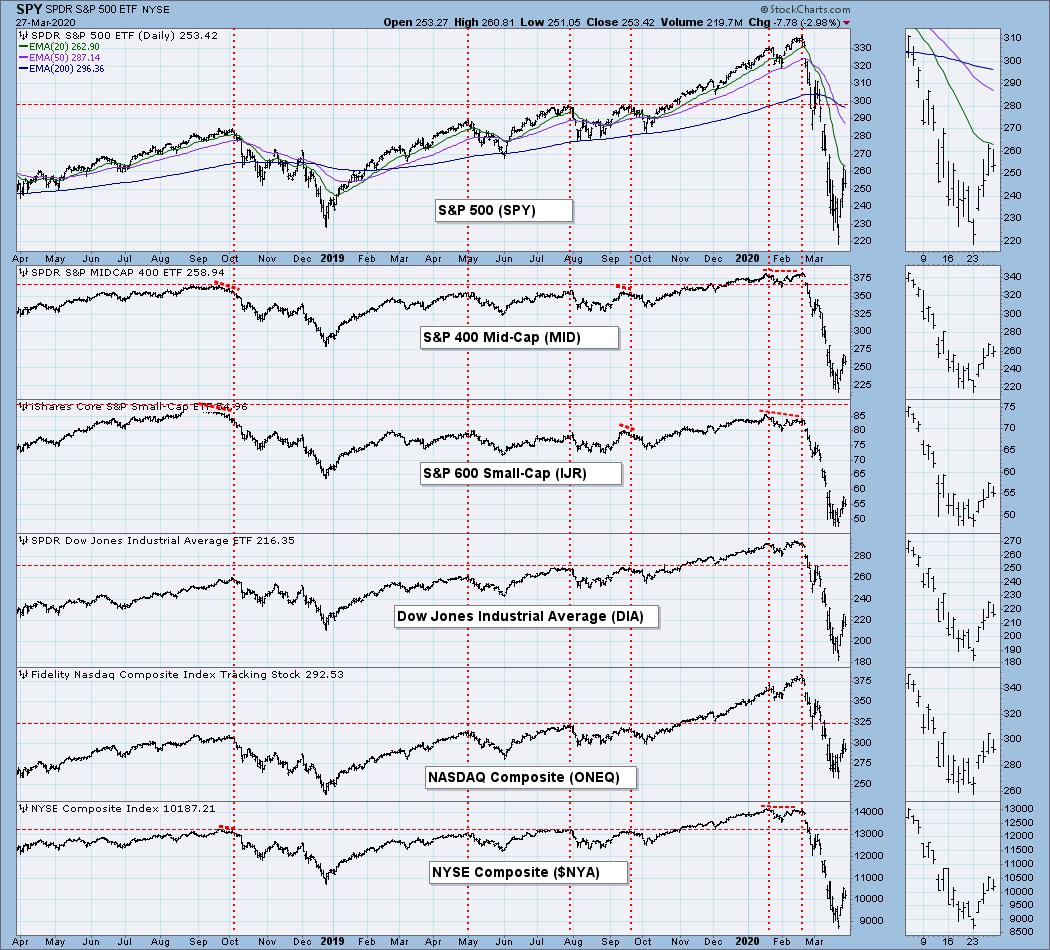
BROAD MARKET INDEXES
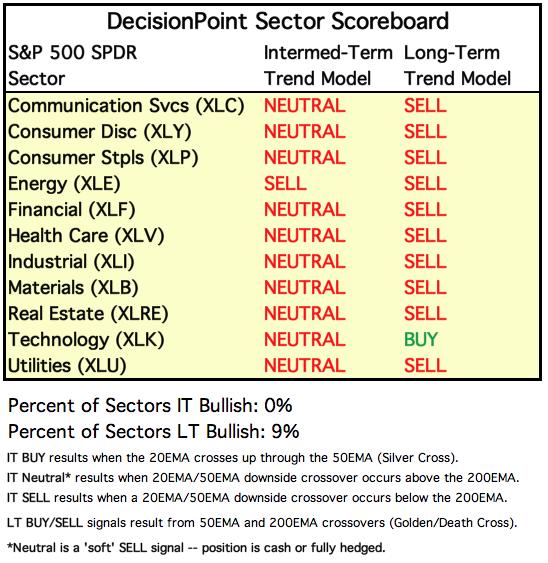
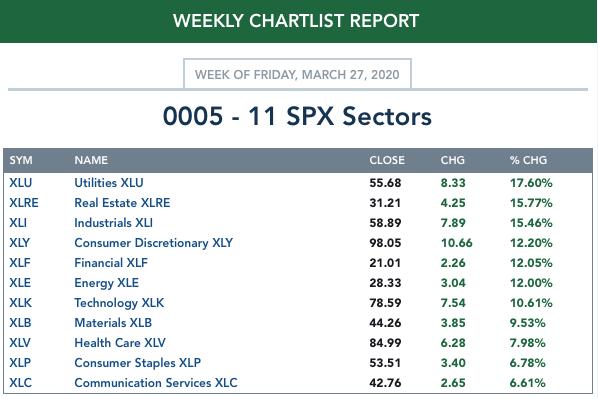
SECTORS
Each S&P 500 Index component stock is assigned to one, and only one, of 11 major sectors. This is a snapshot of the Intermediate-Term (Silver Cross) and Long-Term (Golden Cross) Trend Model signal status for those sectors.
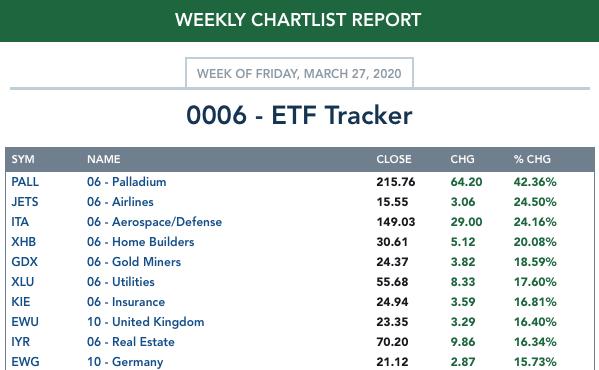
ETF TRACKER: This is a list of about 100 ETFs intended to track a wide range of U.S. market indexes, sectors, global indexes, interest rates, currencies, and commodities. StockCharts.com subscribers can acquire it in the DecisionPoint Trend and Condition ChartPack.
Top 10 . . .
. . . and bottom 10: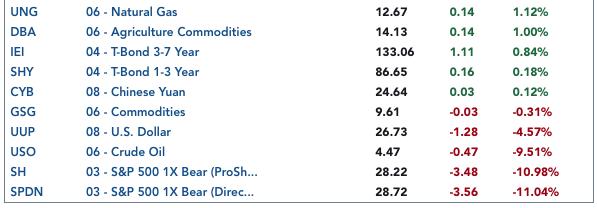
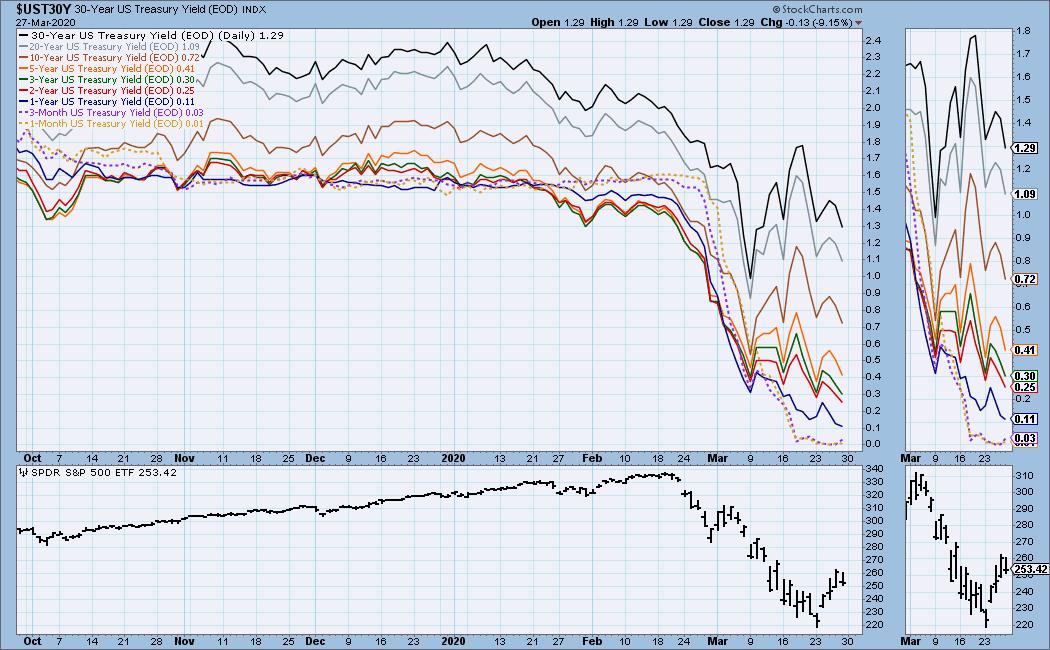
INTEREST RATES
This chart is included so we can monitor rate inversions. In normal circumstances the longer money is borrowed the higher the interest rate that must be paid. When rates are inverted, the reverse is true.
STOCKS
IT Trend Model: NEUTRAL as of 2/28/2020
LT Trend Model: SELL as of 3/19/2020
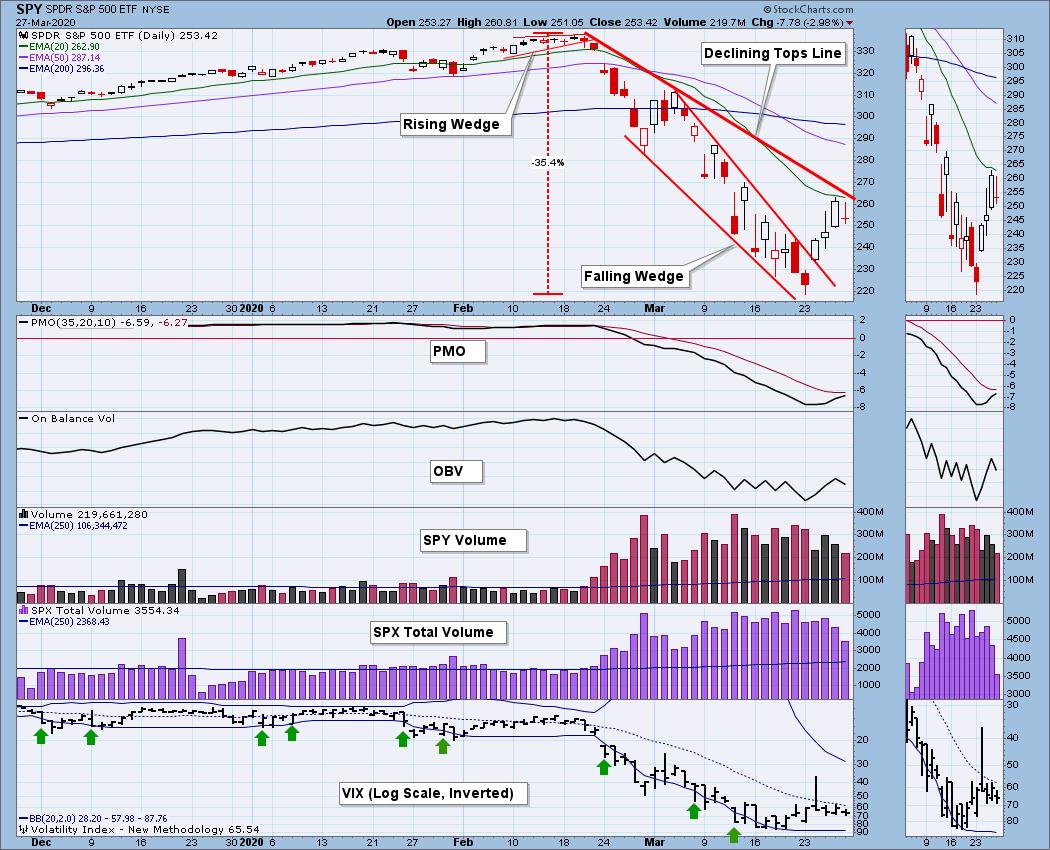
SPY Daily Chart: This is an interesting chart. If I look at price action since the February 19 top, it looks, well, normal, that is until I look at the price action prior to the top. I remember at the time that was normal, now it has been squeezed into insignificance by the unbelievably wild swings of the last five weeks. Note the tiny (bearish) rising wedge that preceded the top -- it really was significant at the time. The chart in my lead comments shows horizontal resistance coming into play at about 268, and this resistance is seconded by the declining tops line on this chart. The daily PMO is decelerating, and it could top below the signal line, which is bearish. Total SPX Volume contracted quite a bit on Friday's decline, which is encouraging.
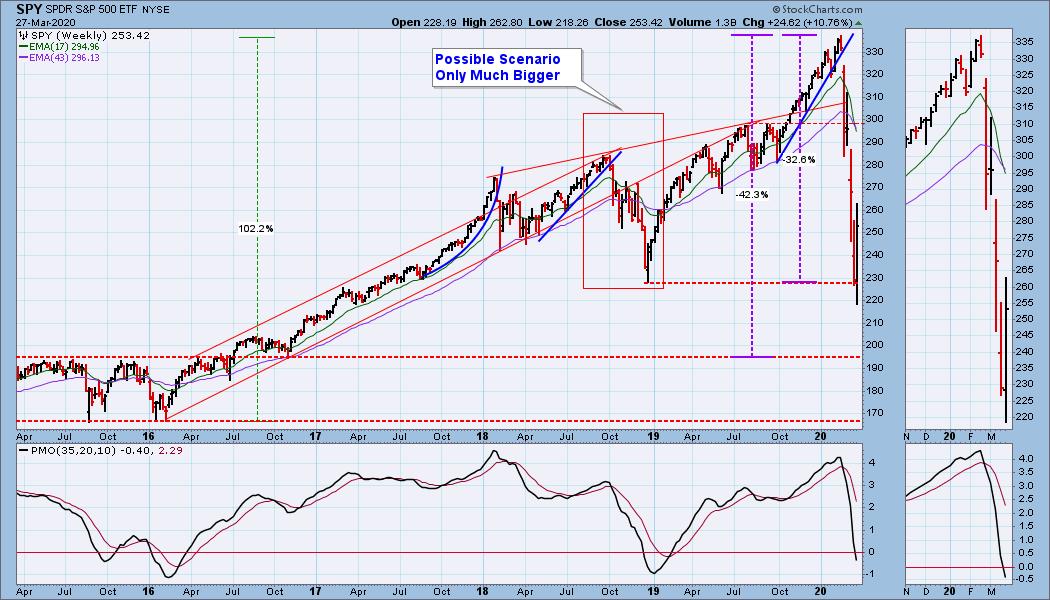
SPY Weekly Chart: I have drawn a box around the price action at the end of 2018. I'm still speculating that we'll see price working through something like that, only on a much grander scale -- sideways for several weeks with a low around SPY 165 -- but it's just one possibility that fits where we are so far.
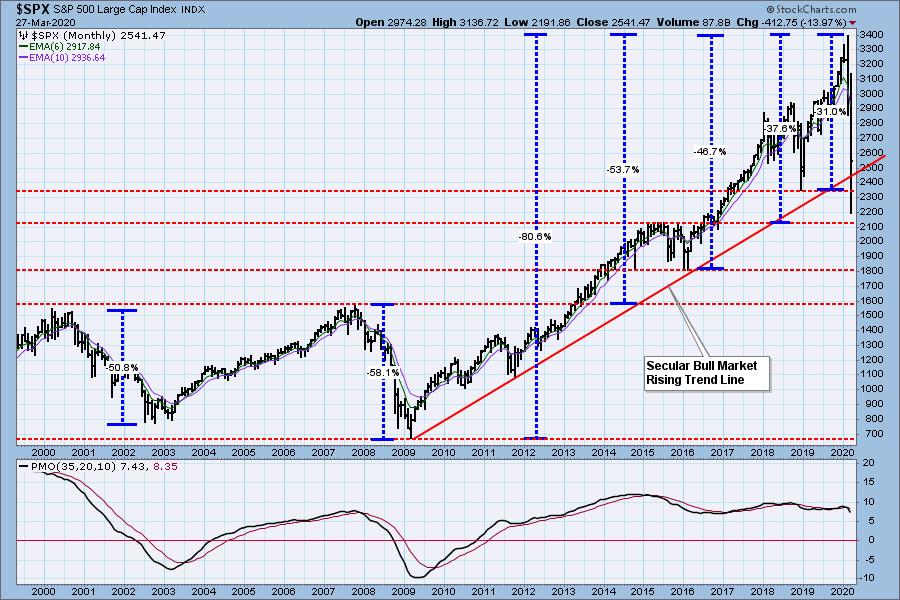
S&P 500 Monthly Chart: There are two trading days left before the end of the month, so I will include monthly charts in this issue. This month price broke down through the secular bull market rising trend line, as well as the horizontal support line drawn across the 2018 low. I thought that announced the end of the secular bull, but price bounced back up above both of those lines, so the situation is somewhat ambiguous at this time.
Climactic Market Indicators: We continued to get climactic readings, in both directions, throughout the week. As such, it wasn't informative.
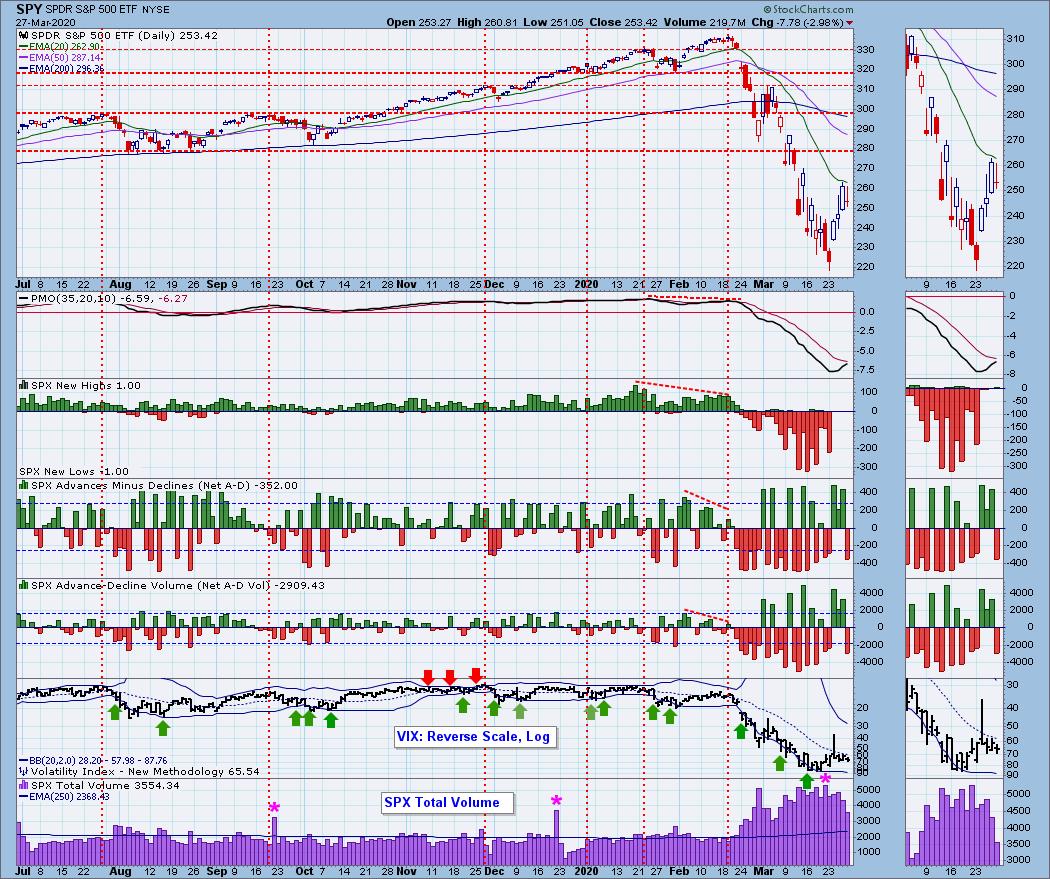
Short-Term Market Indicators: The short-term market trend is UP and the condition is NEUTRAL, although the Percent of PMOs Rising is overbought.
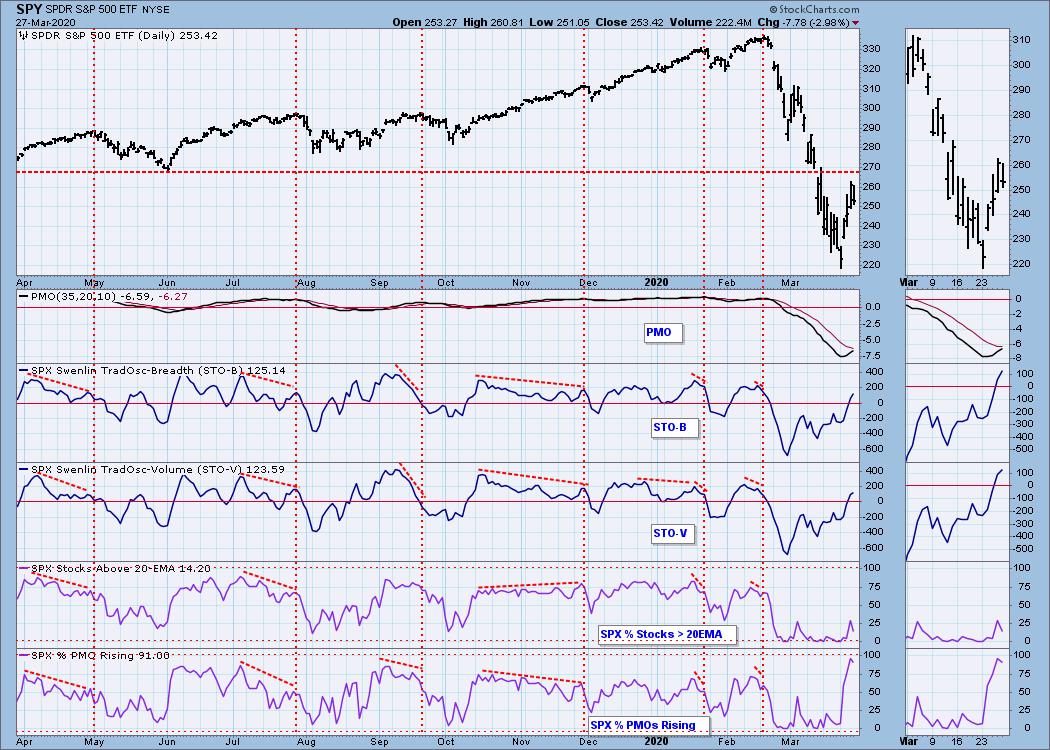
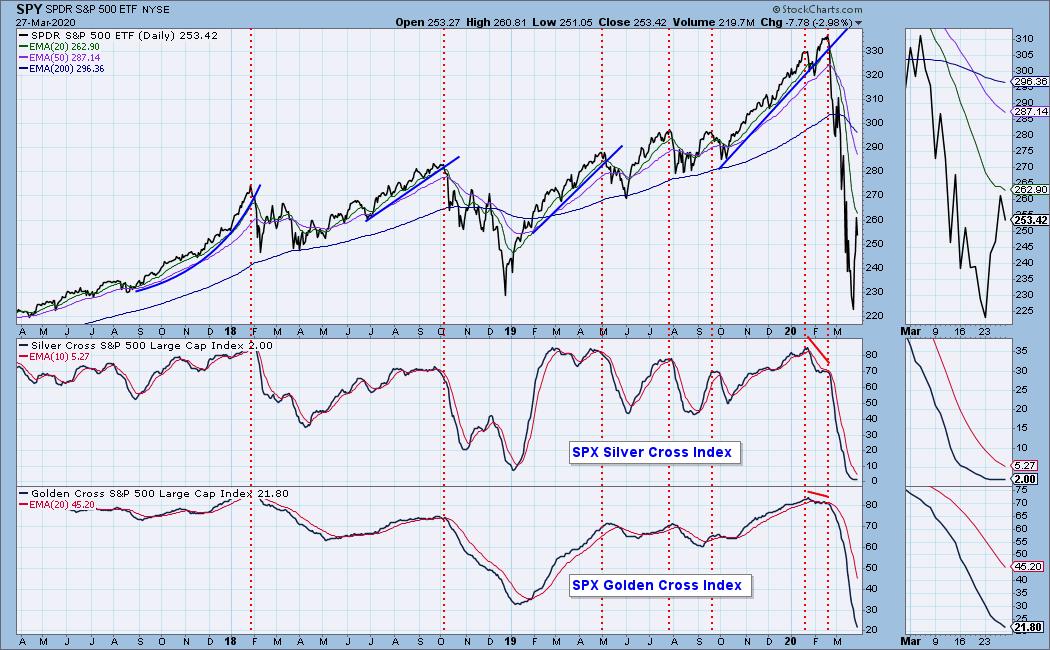
Intermediate-Term Market Indicators: The intermediate-term market trend is DOWN and the condition is OVERSOLD. The Silver Cross Index is at the bottom of its range, but it may not be ready to change directions. SPX component stocks need to experience enough upside to cause 20EMAs to cross up through 50EMAs.
Three of the four indicators have turned up strongly

CONCLUSION: Congress and the administration have just thrown an incomprehensibly huge pile of money at the problems caused and yet to be caused by COVID-19. The hope is that the virus will peak in a few weeks and go away. After that, things will be back to normal in a few months. I hope that is how it works out, but I think we have not begun to imagine the ramifications of what has already happened, and what is yet to come. And that is without having the virus decide it wants to stay around a while longer. Nevertheless, I have a lot of faith in America's potential to rebound, and the power of that cannot be underestimated. And maybe we'll get a break, and the virus will fade away quickly.
We had a strong short-term rally this week. Short-term indicators allow for the rally to continue. Very oversold intermediate-term indicators have turned up, and they tell us the fun has just started. We must, however, be cautious. Overhead resistance will be encountered soon, and we are in a bear market, where an oversold market can collapse beneath our feet. As long as we are getting these huge daily moves, I would not be too sanguine, until things settle down somewhat. Remember, the market needs to rally +55% from this week's lows before it recaptures the February highs. In my opinion, that is a bridge too far, and the bear will continue to be with us.
Have you subscribed the DecisionPoint Diamonds yet? DP does the work for you by providing handpicked stocks/ETFs from exclusive DP scans! Add it with a discount! Contact support@decisionpoint.com for more information!
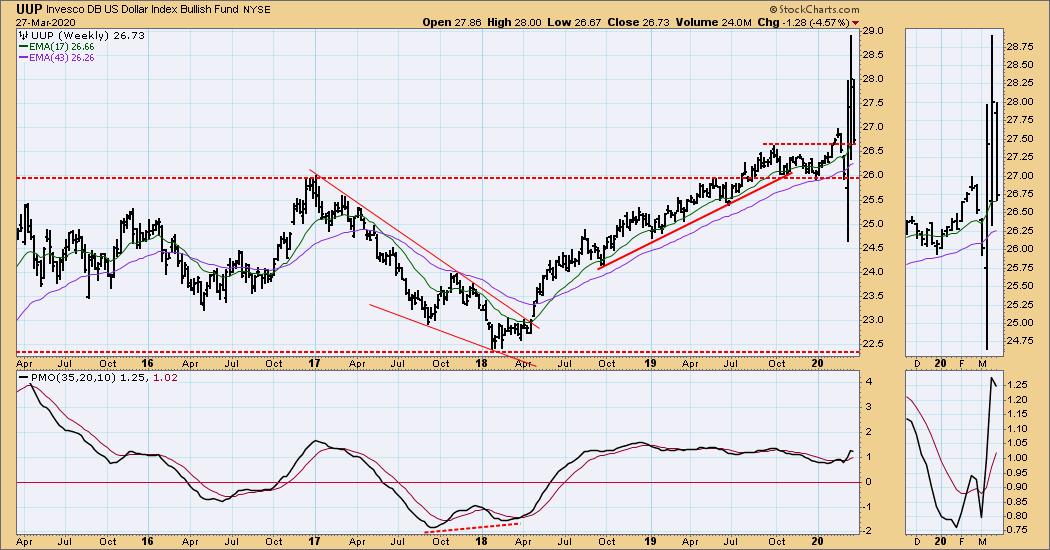
DOLLAR (UUP)
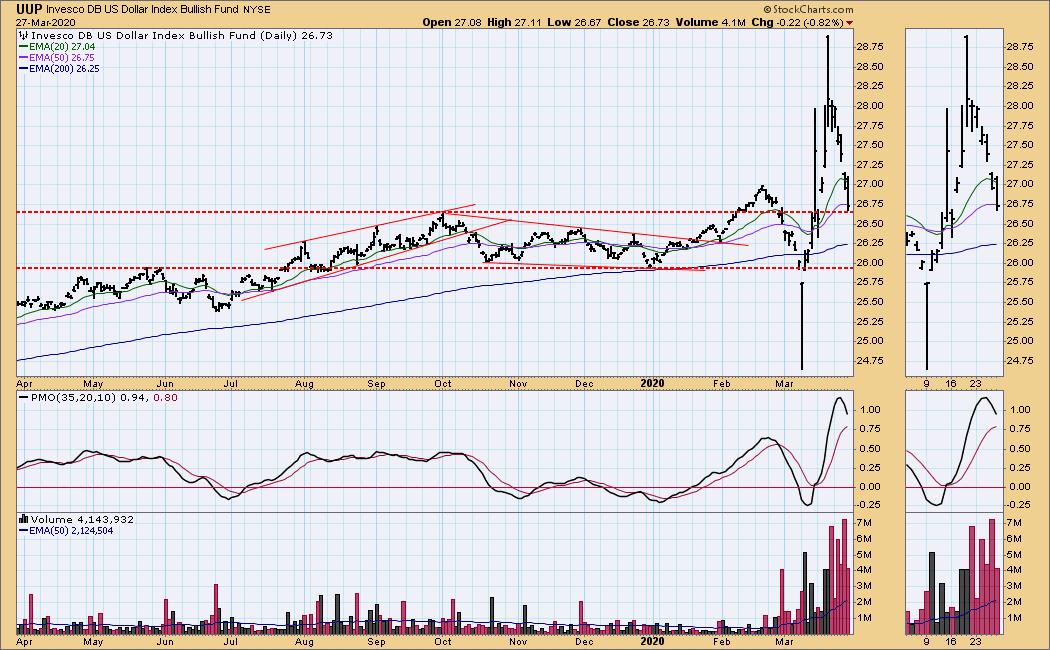
IT Trend Model: BUY as of 3/13/2020
LT Trend Model: BUY as of 5/25/2018
UUP Daily Chart: The dollar has had some wild swings of its own this month, and it needs to settle down before we can make sense of the chart.
UUP Weekly Chart: No help on this chart either.
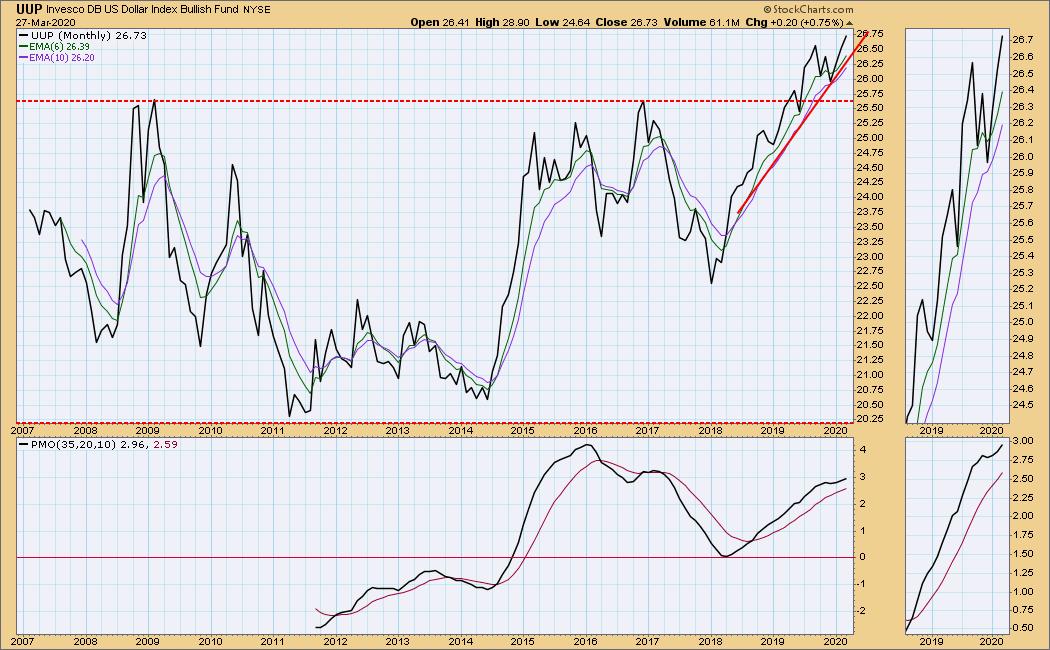
UUP Monthly Chart: In this time frame switching to a line chart actually clarifies the situation and paints a positive picture.
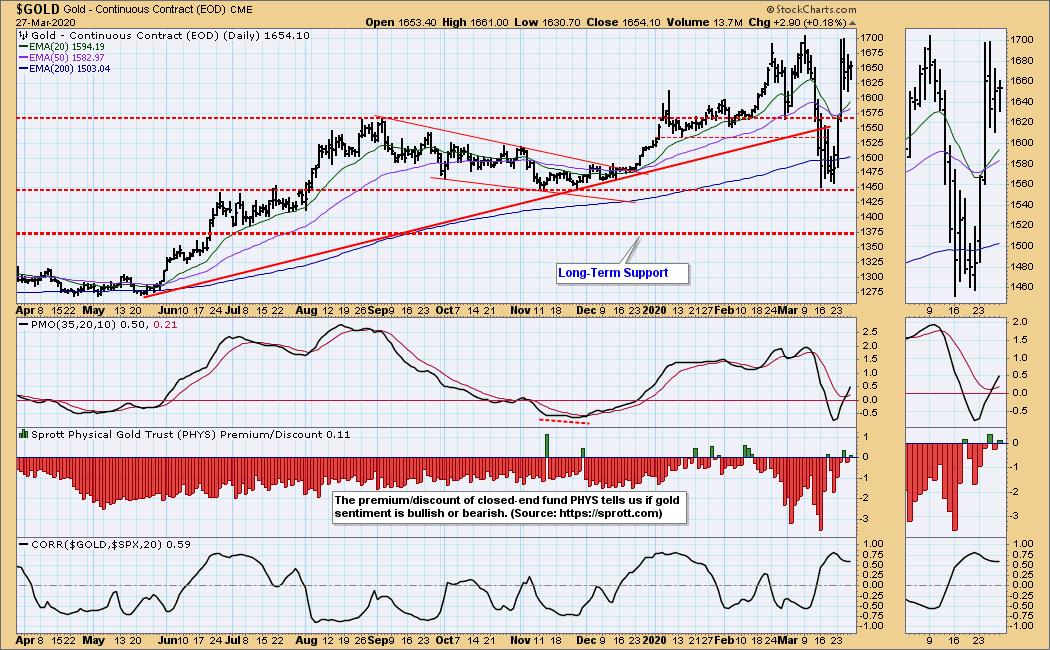
GOLD
IT Trend Model: BUY as of 12/26/2019
LT Trend Model: BUY as of 1/8/2019
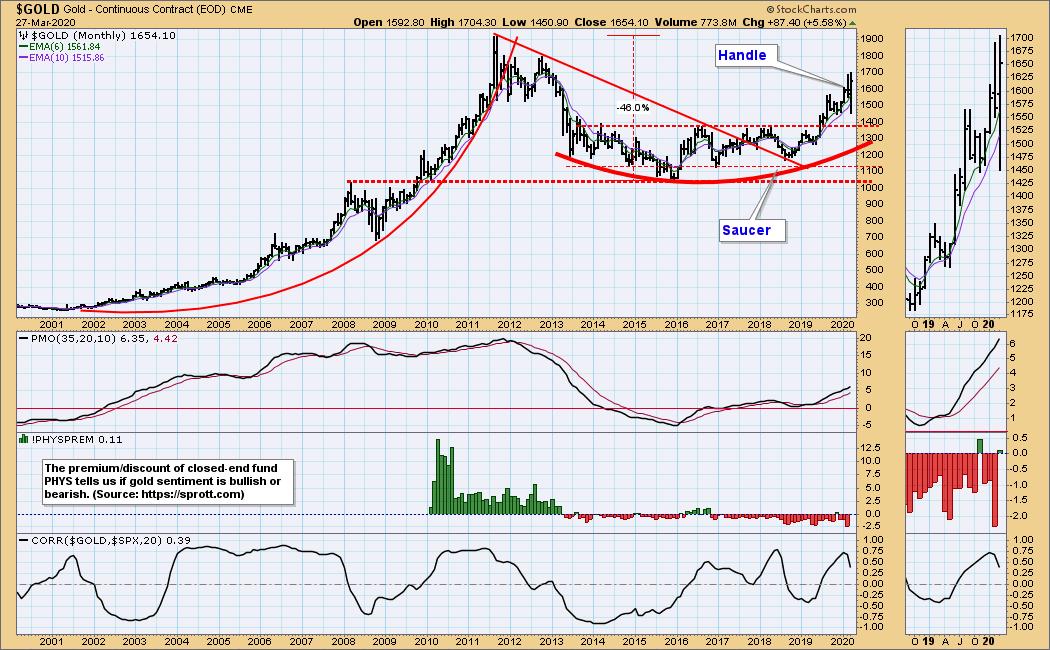
GOLD Daily Chart: We had a Trend Model whipsaw from NEUTRAL back to BUY this week. A banner on Fox Business says that gold had its biggest weekly gain in 11 years. A big deal, but we chartists can see that it is still stuck in a range.
GOLD Weekly Chart: We can see the effect of dollar volatility on the price of gold. And at present, there is no correlation between stocks and gold.
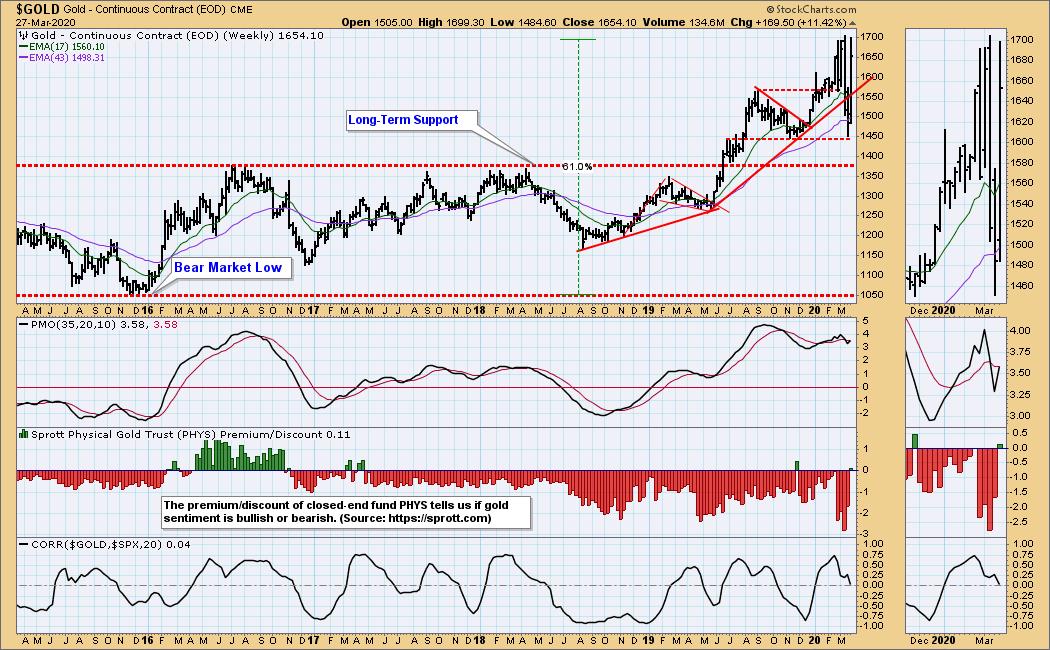
GOLD Monthly Chart: I think I will interpret the recent pullback as the handle on the saucer formation. As such it would be a positive sign. I still see gold as being positive, but its progress has been torturous.
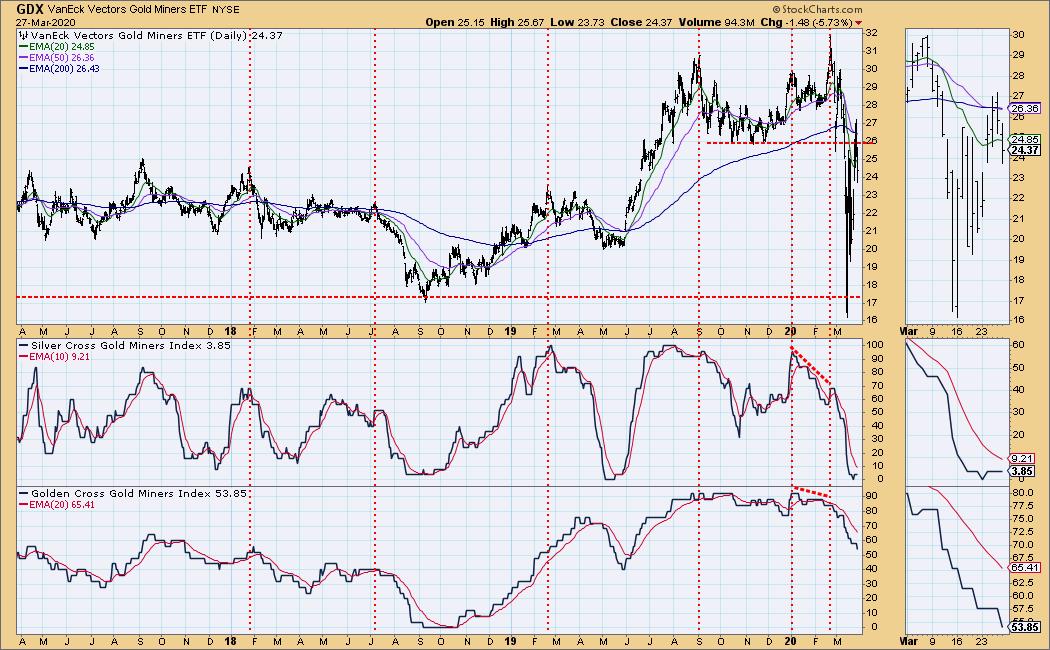
GOLD MINERS Golden and Silver Cross Indexes: The Silver Cross Index is at the bottom of the range. Because gold is positive, we should look for the miners to rally.
CRUDE OIL (USO)
IT Trend Model: NEUTRAL as of 1/27/2020
LT Trend Model: SELL as of 2/3/2020
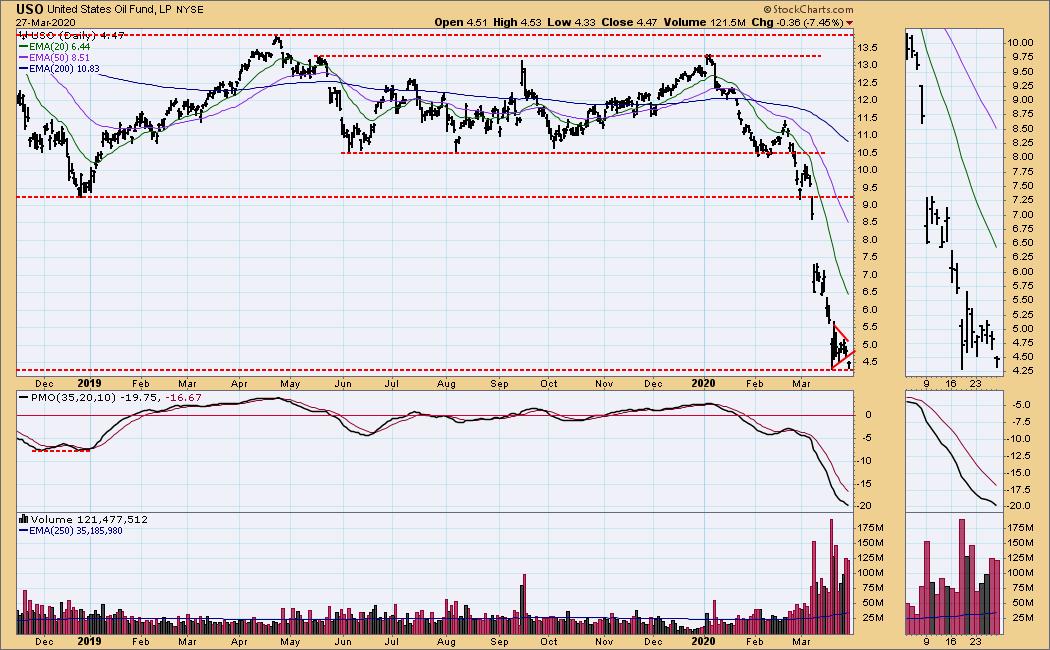
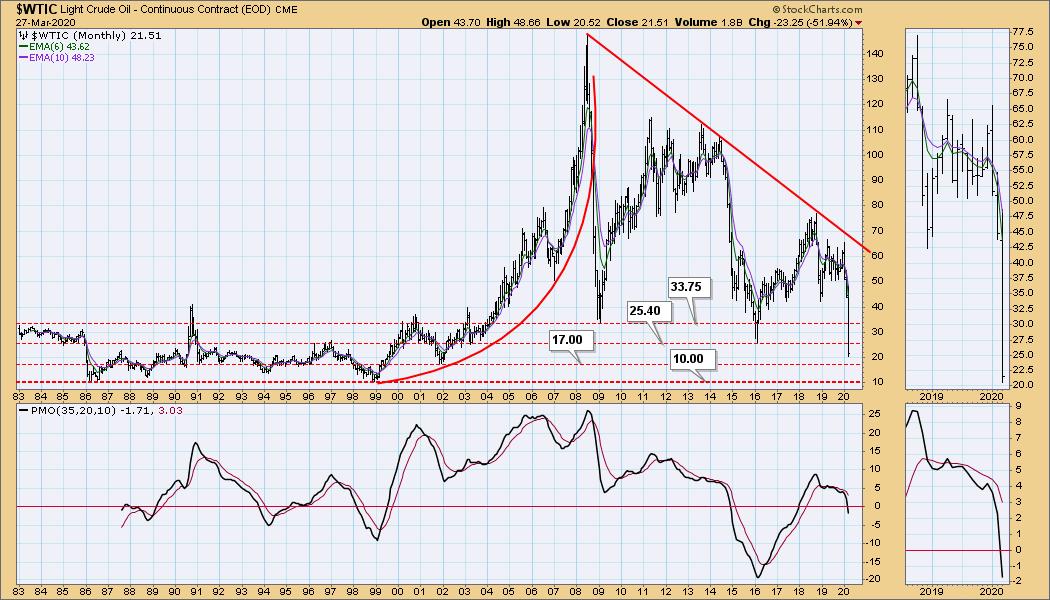
USO Daily Chart: That little consolidation at the end of this month looks insignificant, but it has a 17% range. It also forms a reverse pennant, which was vacated downward today.
USO Weekly Chart: There is no support visible on this chart below current price.
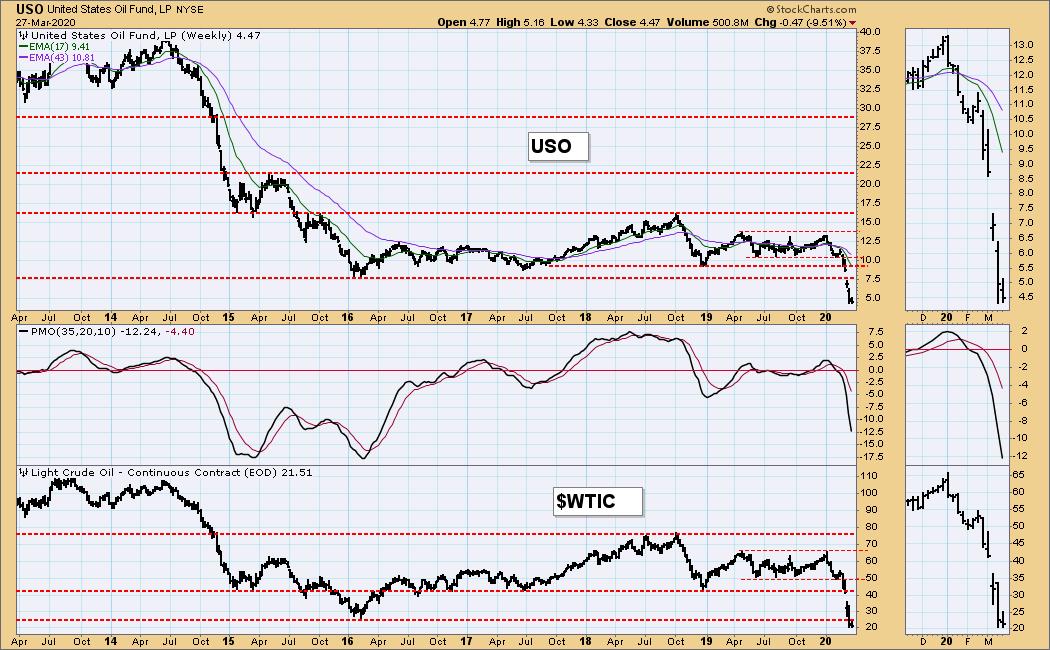
WTIC Monthly Chart: The next clear support for WTIC is at 17.00. A drop to 10.00 is a stretch, but I can't rule it out.
BONDS (TLT)
IT Trend Model: BUY as of 1/22/2020
LT Trend Model: BUY as of 1/2/2019
TLT Daily Chart: A small pennant formed this week, and it resolved upward on Friday.
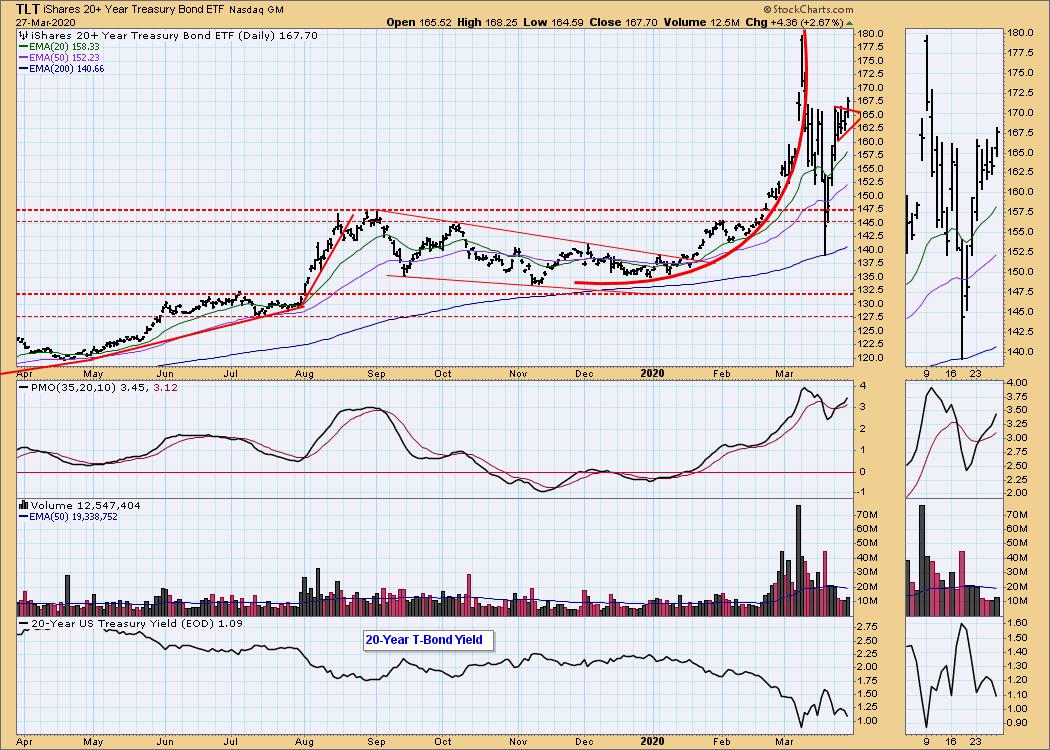
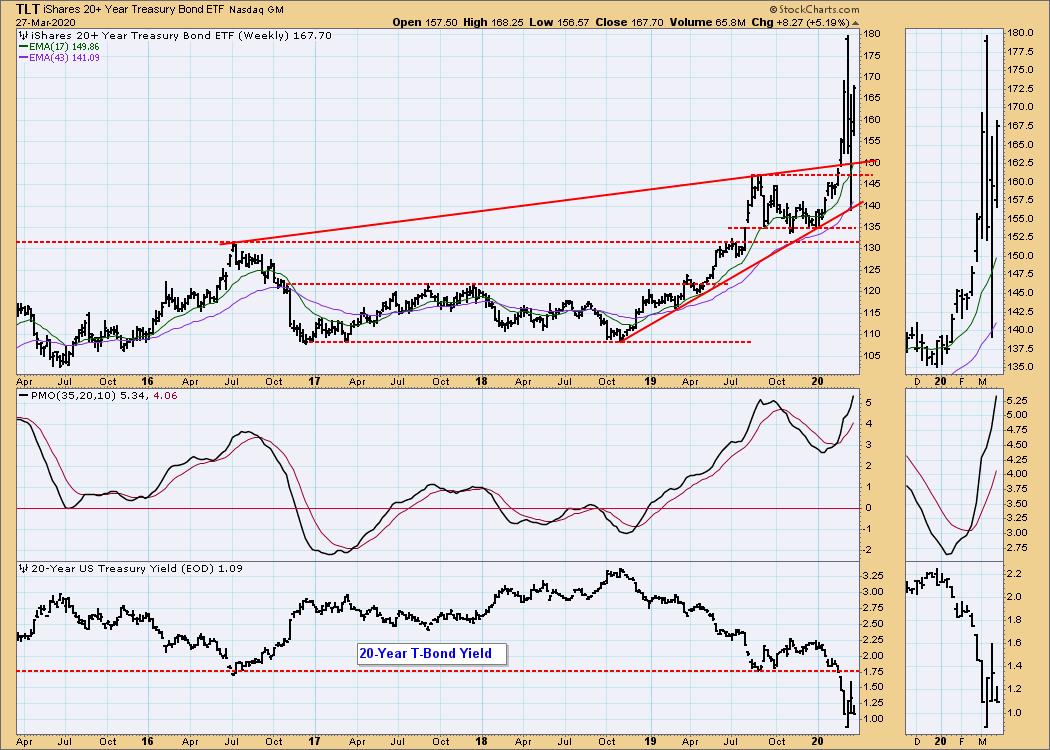
TLT Weekly Chart: If I need clarification for a daily chart, I normally go from the daily chart to the weekly chart. In this case, the daily chart conveys more clarity for the last three weeks.
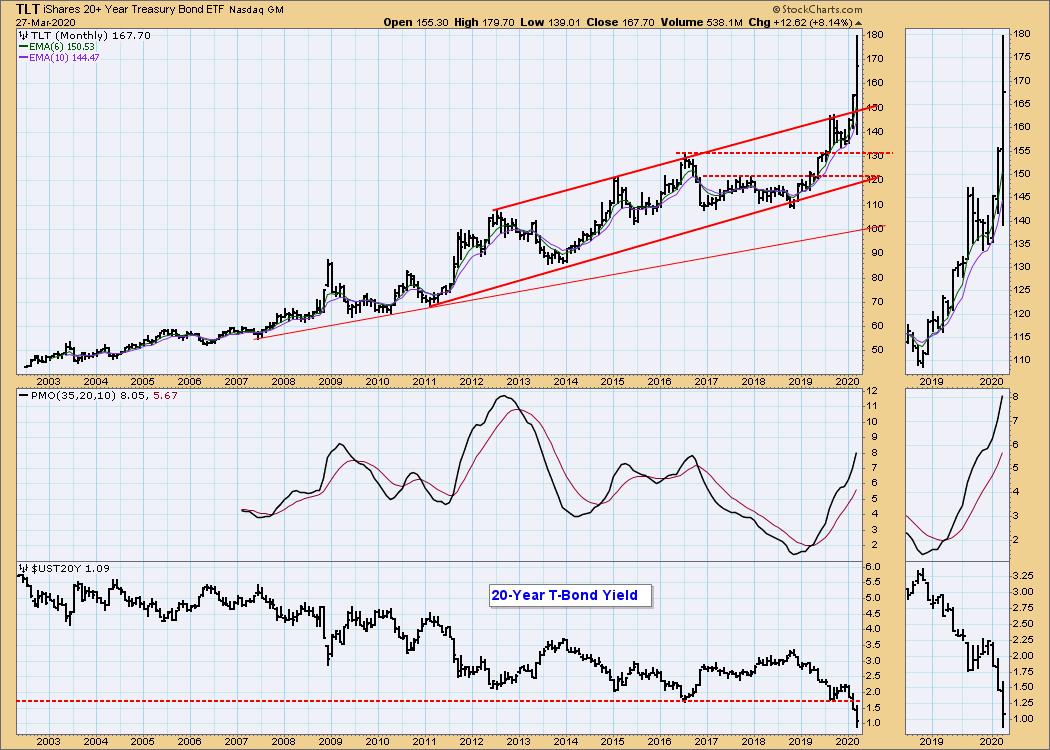
TLT Monthly Chart: In this time frame, we have parabolic movement, which we saw on the daily chart has resolved downward.
Technical Analysis is a windsock, not a crystal ball.
Happy Charting! - Carl
NOTE: The signal status reported herein is based upon mechanical trading model signals, specifically, the DecisionPoint Trend Model. They define the implied bias of the price index based upon moving average relationships, but they do not necessarily call for a specific action. They are information flags that should prompt chart review. Further, they do not call for continuous buying or selling during the life of the signal. For example, a BUY signal will probably (but not necessarily) return the best results if action is taken soon after the signal is generated. Additional opportunities for buying may be found as price zigzags higher, but the trader must look for optimum entry points. Conversely, exit points to preserve gains (or minimize losses) may be evident before the model mechanically closes the signal.
Helpful DecisionPoint Links:
DecisionPoint Alert Chart List
DecisionPoint Golden Cross/Silver Cross Index Chart List
DecisionPoint Sector Chart List
Price Momentum Oscillator (PMO)
Swenlin Trading Oscillators (STO-B and STO-V)