
The market rebounded somewhat and the optimism on the financial channels began to build in earnest. I like monitoring sentiment in the short-term through financial networks and social media. Sentiment needs to hit bearish extremes for a rebound. Think about the tenor of the media on the historic down days, panicky and depressed. It isn't surprising to see a bounce the next day. With it, comes extreme optimism as everyone 'guesses' this is the end of the bear market. A recent supposition is that the up days are really being fueled by short covering, not excessive bullishness. I have to agree for the most part. With the market bouncing back and forth from positive to negative territory and closing only slightly higherdf, I'd say sentiment today is neutral.
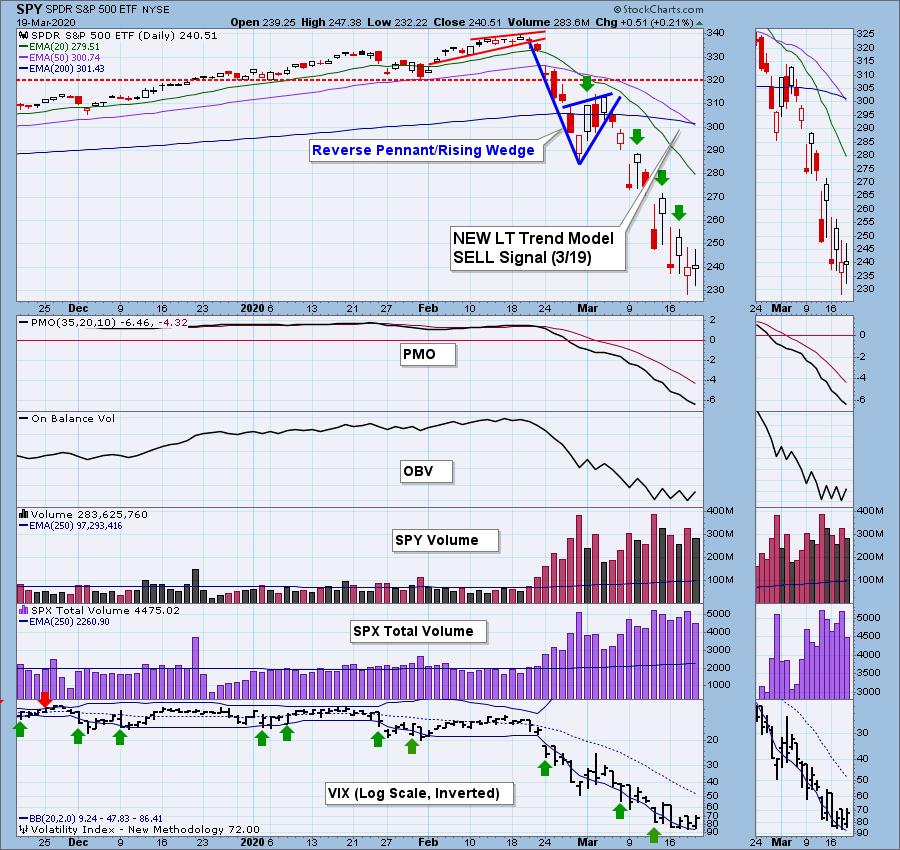
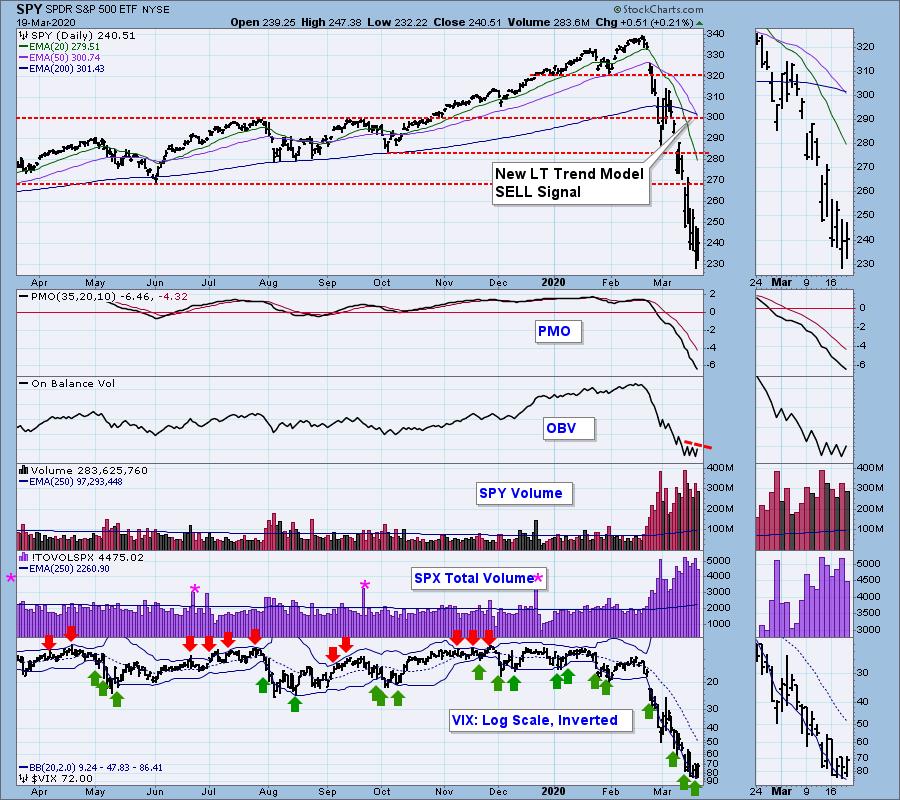
The Long-Term Trend Model SELL signal on the SPY was triggered by a negative 50/200-EMA crossover. We got this on the SPX yesterday, so we were expecting this today. The OBV is not positive yet. We have declining tops which simply confirms the decline.
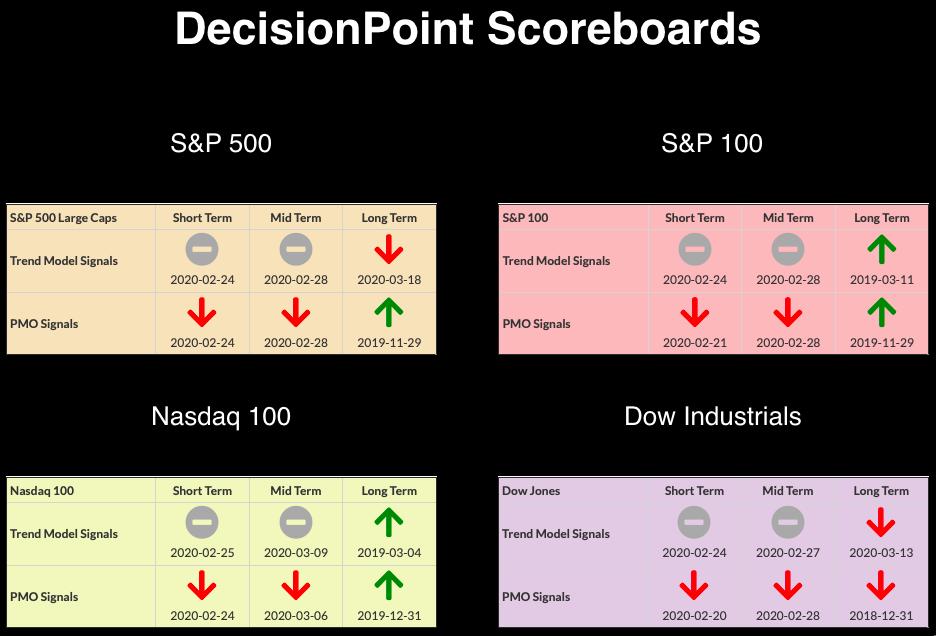
CURRENT BROAD MARKET DP Signals:
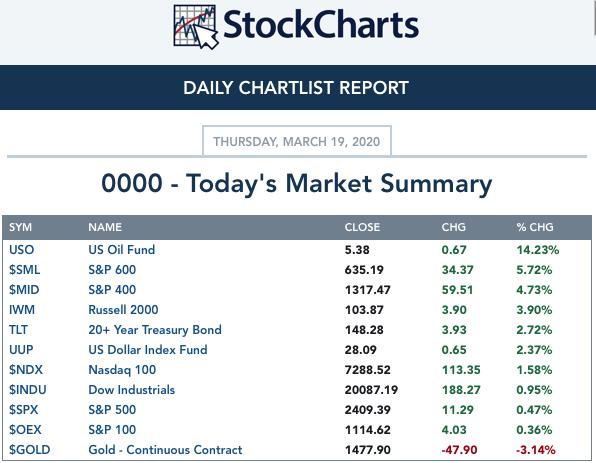
TODAY'S Broad Market Action:
Past WEEK Results: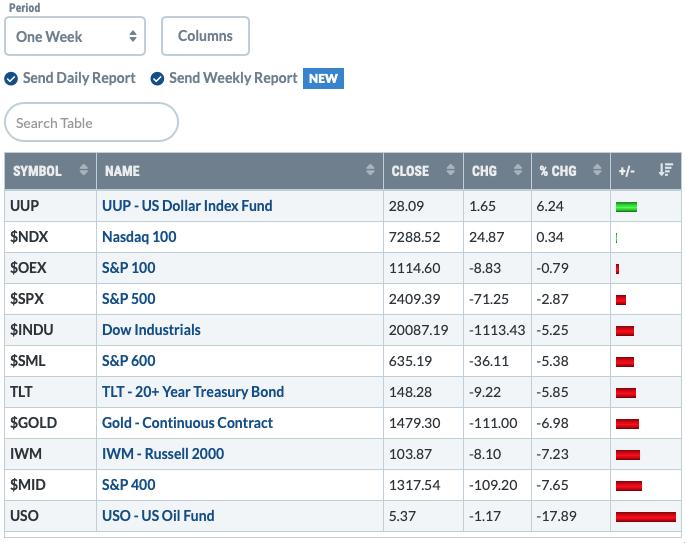
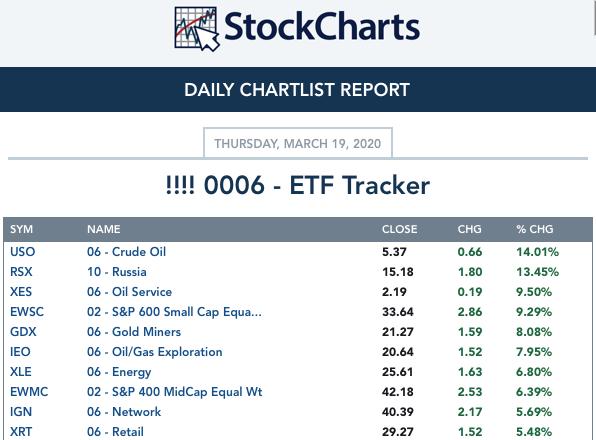
Top 10 from ETF Tracker:
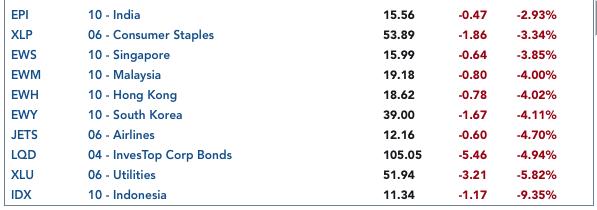
Bottom 10 from ETF Tracker:
On Friday, the DecisionPoint Alert Weekly Wrap presents an assessment of the trend and condition of the stock market (S&P 500), the U.S. Dollar, Gold, Crude Oil, and Bonds. Monday through Thursday the DecisionPoint Alert daily report is abbreviated and covers changes for the day.
Watch the latest episode of DecisionPoint on StockCharts TV's YouTube channel here!
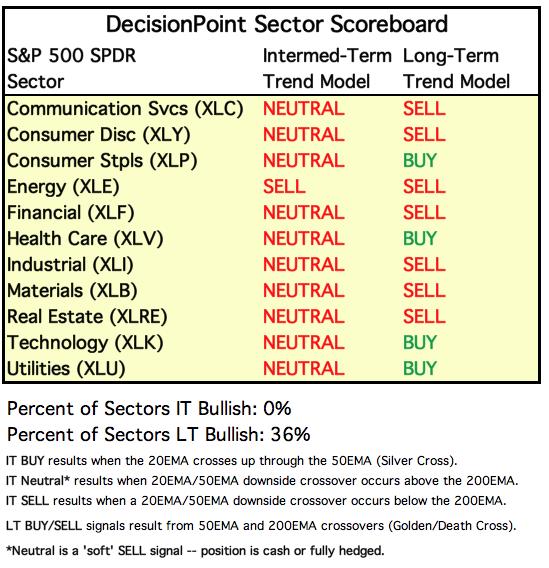
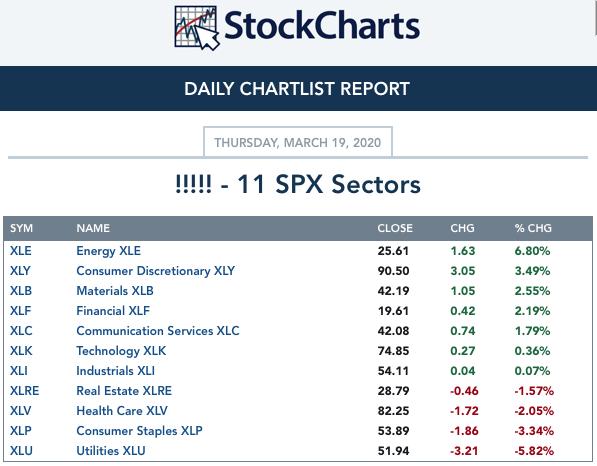
SECTORS
SIGNALS:
Each S&P 500 Index component stock is assigned to one, and only one, of 11 major sectors. This is a snapshot of the Intermediate-Term (Silver Cross) and Long-Term (Golden Cross) Trend Model signal status for those sectors.
TODAY'S RESULTS:
One WEEK Results: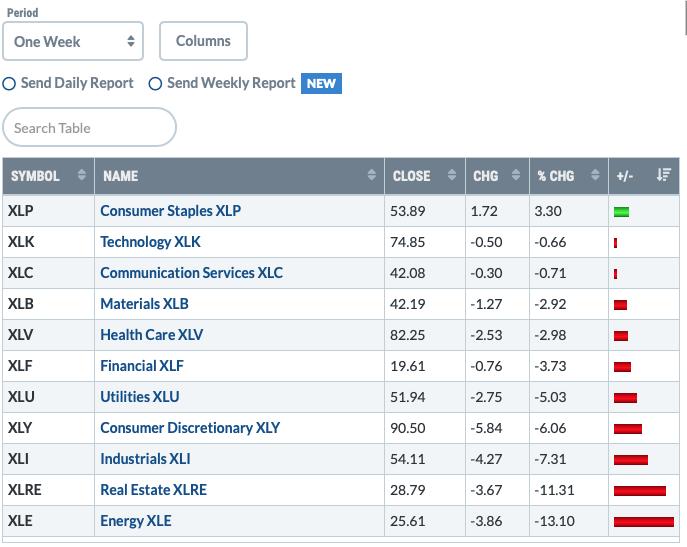
STOCKS
IT Trend Model: NEUTRAL as of 2/28/2020
LT Trend Model: SELL as of 3/19/2020
SPY Daily Chart: The magic 230 support level was broken briefly yesterday. Price traded above it all day today which is a little encouraging. We are still seeing very high volume. Tomorrow is options expiration, so I expect we could see even higher volume numbers. Generally speaking, option expiration days show giant volume with very little price movement. We could see more short covering.
Climactic Market Indicators: For once we don't have really climactic readings. New Lows pulled way back. The VIX is beginning to move back into the Bollinger Band which I find positive in the short term.
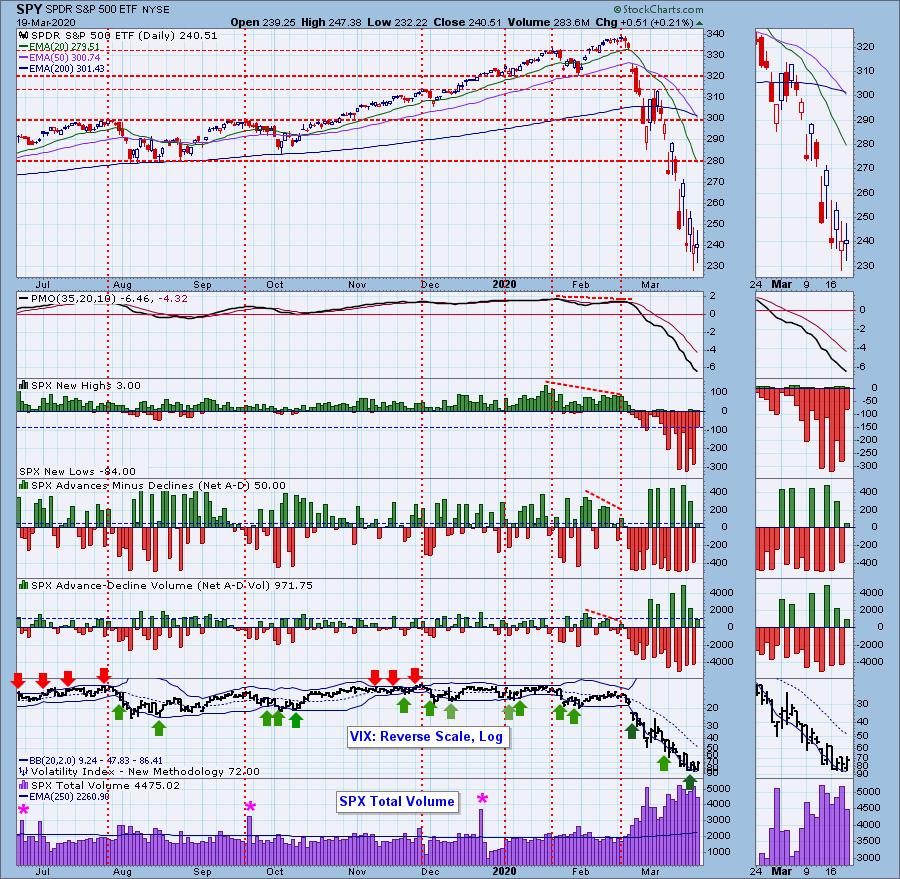
Short-Term Market Indicators: The ST trend is DOWN and the market condition is NEUTRAL based upon the Swenlin Trading Oscillator (STO) readings. The STOs are rising and do have a positive divergence in place. However, I find it less exciting given that we moved from oversold territory to neutral with no overall price rise.
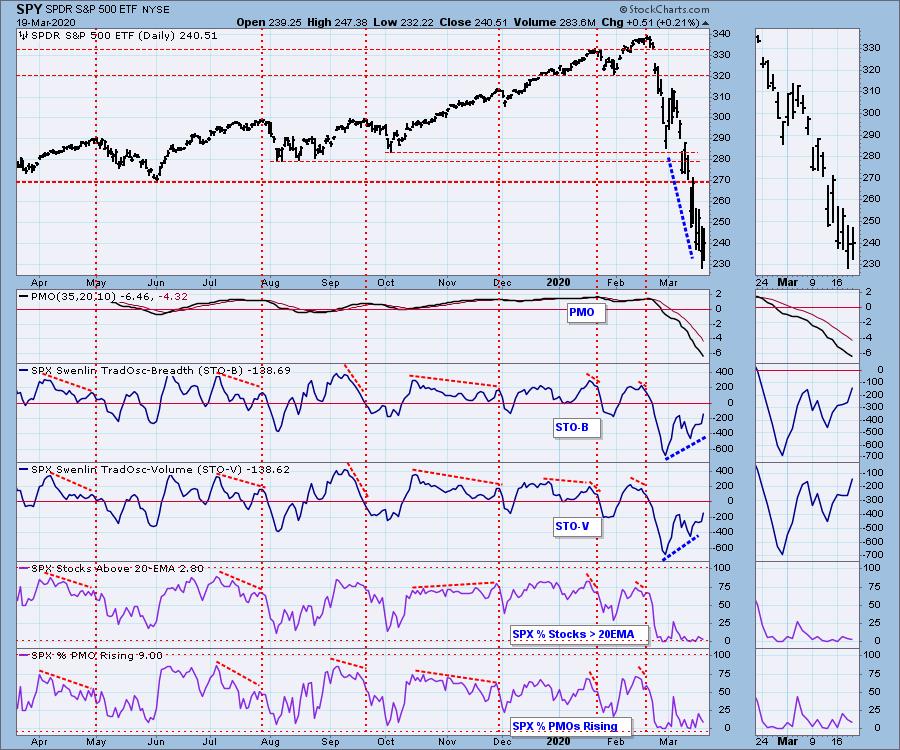
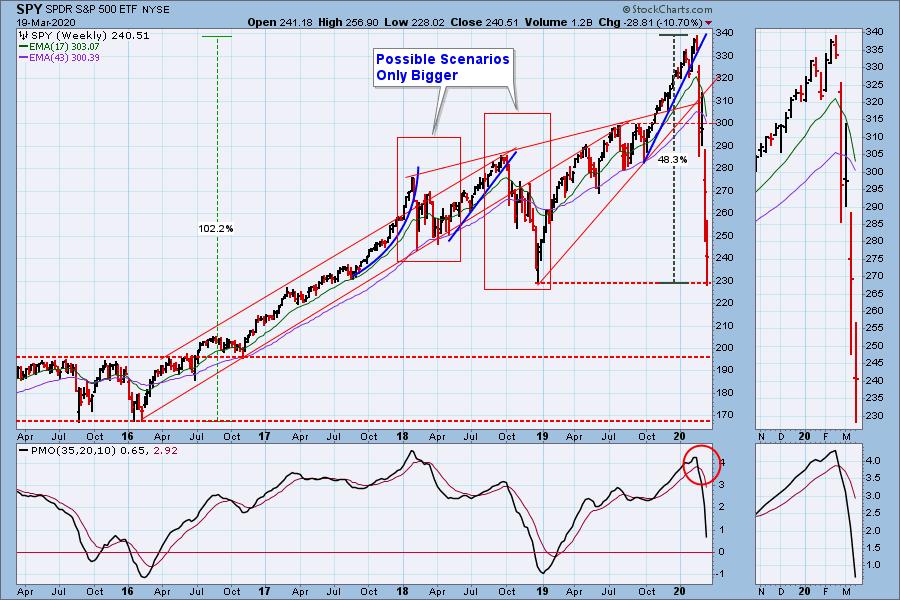
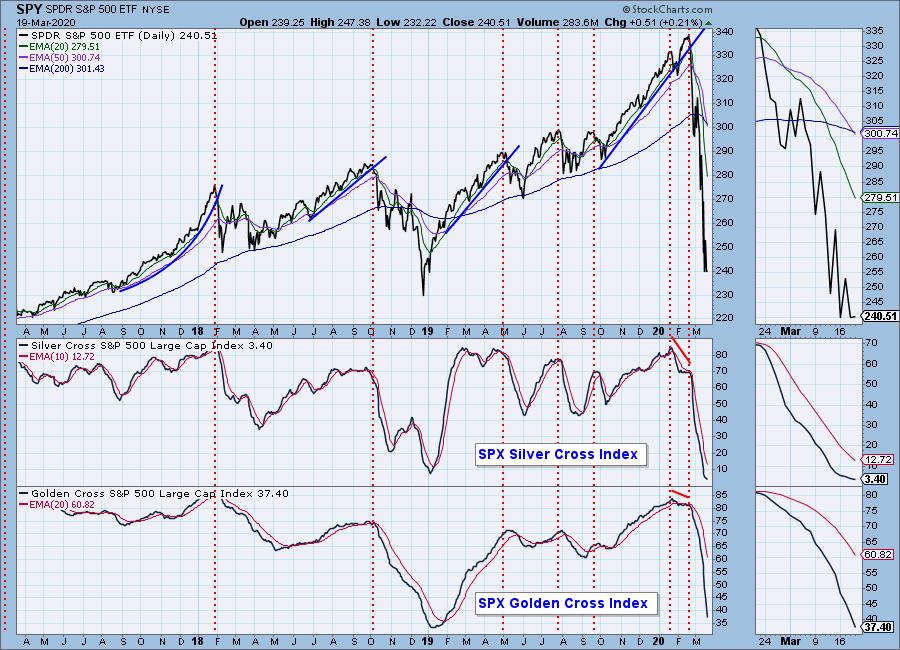
Intermediate-Term Market Indicators: The Silver Cross Index (% of SPX stocks 20EMA > 50EMA) and the Golden Cross Index (percent of SPX stocks 50EMA > 200EMA) are declining. The SCI is decelerating as it nears zero. The GCI is oversold, but could move lower based on the readings from 2018.
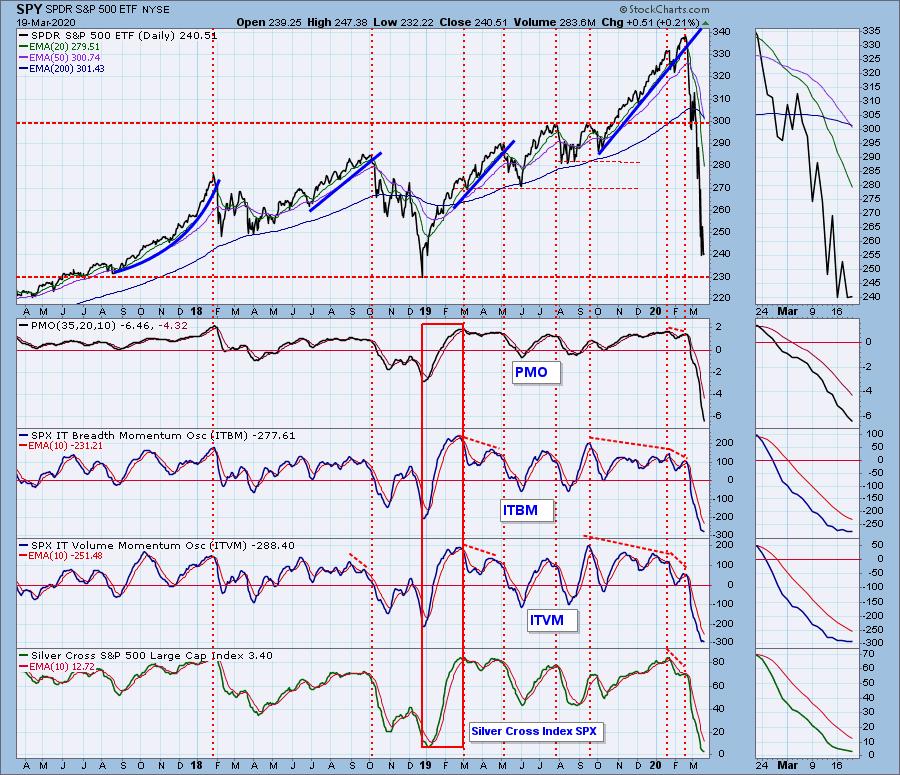
The IT trend is DOWN and the market condition is EXTREMELY OVERSOLD based upon all of the readings on the indicators below. We are seeing deceleration on these oscillators as they move into very oversold extremes. This is a good sign, but I'd like to see an upside crossover before getting too bullish.
CONCLUSION: The ST and IT trends are DOWN. Market condition based on ST and IT indicators is VERY OVERSOLD. In the very short term, we could see a bit more upside based on a slightly improving VIX and lack of climactic readings (finally). Indicators are mixed. The STOs have been rising, but price hasn't really cared.
(Not a Diamonds subscriber? Add it to your DP Alert subscription and get a discount! Contact support@decisionpoint.com for your limited time coupon code!)
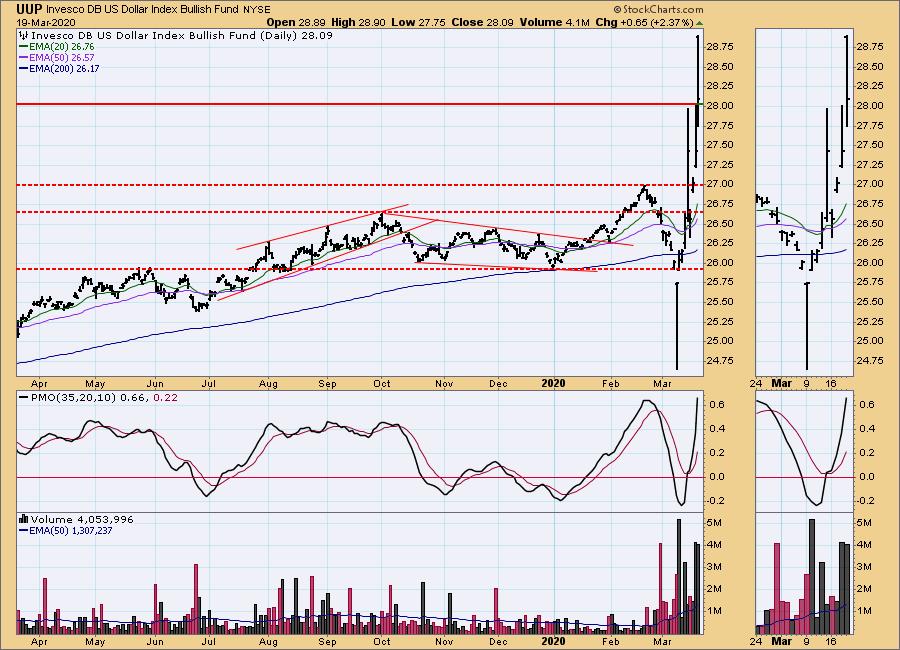
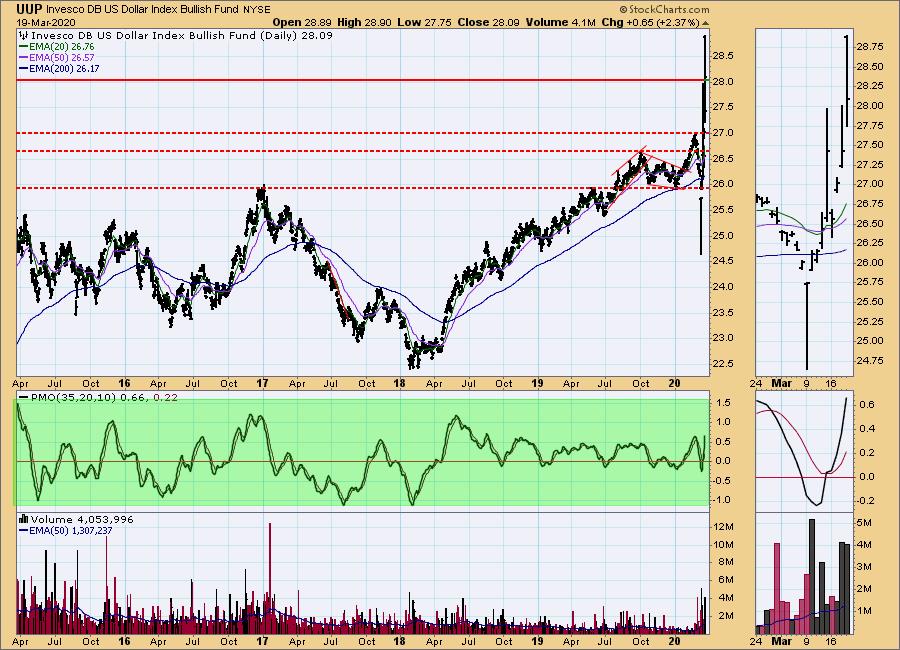
DOLLAR (UUP)
IT Trend Model: NEUTRAL as of 3/9/2020
LT Trend Model: BUY as of 5/25/2018
UUP Daily Chart: Another very wide trading range for UUP today. We saw it make another new annual high, but it pulled back greatly. The PMO has moved to very overbought territory when considered over the past year, but we've seen much higher PMO readings in the past (1.5+).
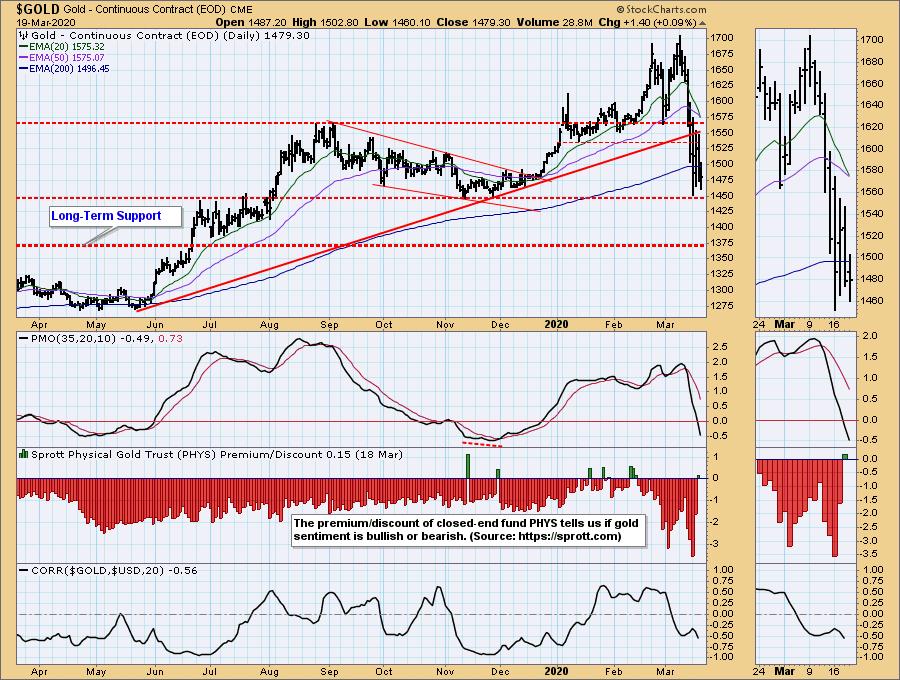
GOLD
IT Trend Model: BUY as of 12/26/2019
LT Trend Model: BUY as of 1/8/2019
GOLD Daily Chart: The important 1450 level is still holding up. The PMO is reaching near-term oversold territory. Like UUP above, the PMO range is fairly wide. We've seen PMOs below -2.0 before. The correlation to the Dollar is now back to normal. If the Dollar continues its rise, Gold will certainly falter.
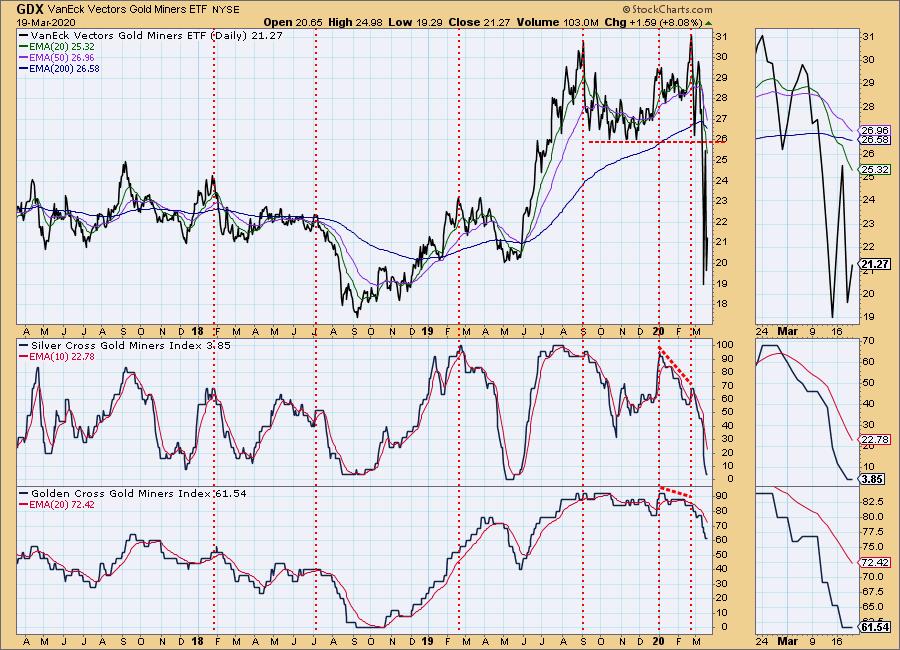
GOLD MINERS Golden and Silver Cross Indexes: You may have noticed that Gold Miners were in the "Top Ten" on the ETF Tracker. They had an 8%+ rally, but seen on the chart, it looks far less impressive. The $17 level could be tested as we wait for the Golden Cross Index to move into oversold territory.
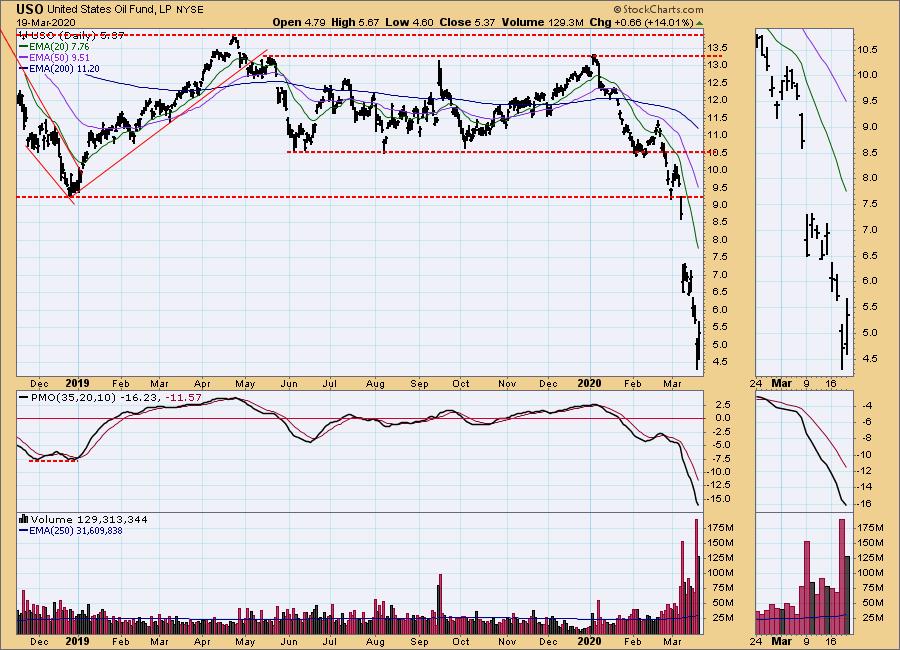
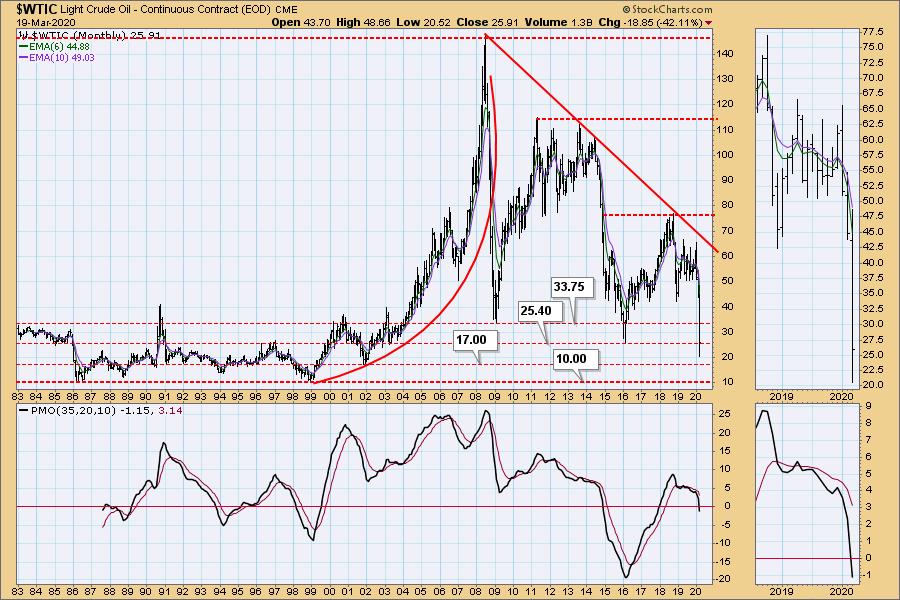
CRUDE OIL (USO)
IT Trend Model: Neutral as of 1/27/2020
LT Trend Model: SELL as of 2/3/2020
USO Daily Chart: Oil markets came back today with a vengeance. Likely investors couldn't help themselves to Oil at these historic lows, especially given the Texas considering a near halt in production to help get prices on track. I don't think USO is out of the woods until the supply and demand equation is solved.
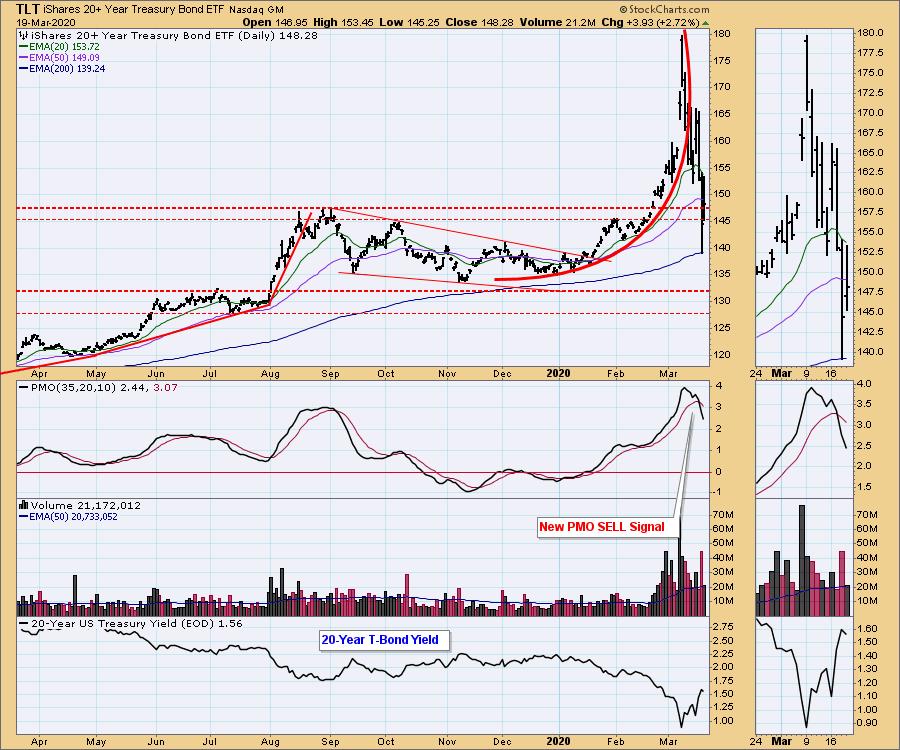
BONDS (TLT)
IT Trend Model: BUY as of 1/22/2020
LT Trend Model: BUY as of 1/2/2019
TLT Daily Chart: Bond prices rebounded as yields moved down slightly. I still don't like the chart. Price closed below the 50-EMA and that vertical drop on the PMO out of overbought territory suggests more downside. My thought is a move back into the trading range between 135 and 145 as the PMO unwinds. I will reevaluate on Monday.
Have you subscribed the DecisionPoint Diamonds yet? DP does the work for you by providing handpicked stocks/ETFs from exclusive DP scans! Add it with a discount! Contact support@decisionpoint.com for more information!
Technical Analysis is a windsock, not a crystal ball.
Happy Charting! - Erin
Email: erin@decisionpoint.com

If there is a Money Show in May, I will be there! Erin Swenlin will be presenting at the The MoneyShow Las Vegas May 11-13, 2020! You'll have an opportunity to meet Erin and discuss the latest DecisionPoint news and Diamond Scans. Claim your FREE pass here! You can watch online with this pass too!!
NOTE: The signal status reported herein is based upon mechanical trading model signals, specifically, the DecisionPoint Trend Model. They define the implied bias of the price index based upon moving average relationships, but they do not necessarily call for a specific action. They are information flags that should prompt chart review. Further, they do not call for continuous buying or selling during the life of the signal. For example, a BUY signal will probably (but not necessarily) return the best results if action is taken soon after the signal is generated. Additional opportunities for buying may be found as price zigzags higher, but the trader must look for optimum entry points. Conversely, exit points to preserve gains (or minimize losses) may be evident before the model mechanically closes the signal.
Helpful DecisionPoint Links (Can Be Found on DecisionPoint.com Links Page):
DecisionPoint Shared ChartList and DecisionPoint Chart Gallery
Price Momentum Oscillator (PMO)
Swenlin Trading Oscillators (STO-B and STO-V)