
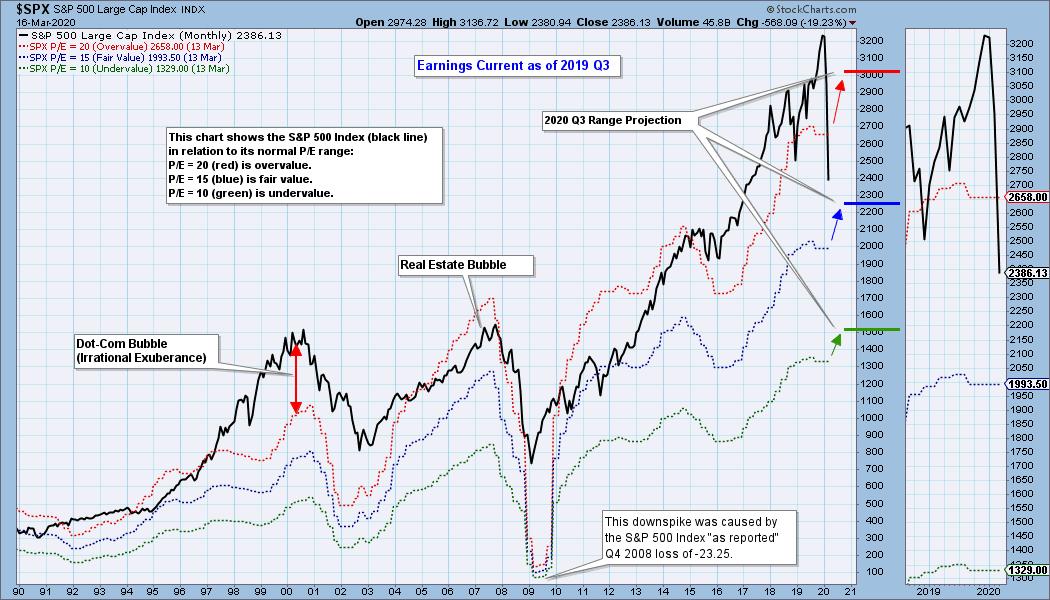
Today's decline was breathtaking. The resulting losses from the past 3 weeks is something no one (even bears like Carl and I) could have conceived. This is different. I'm sure you've been hearing this for some time. The reason for this loss, for the most part, is not being caused by financial malfeasance or even the economy, it is due to a biological threat... one that will resolve itself over time, God willing sooner rather than later. Of course, I would also argue that technically this has been overdue and in reality, this is a good thing as the market moves back into 'fair value' territory. The earnings chart below is a staple of DecisionPoint and certainly tells this story.
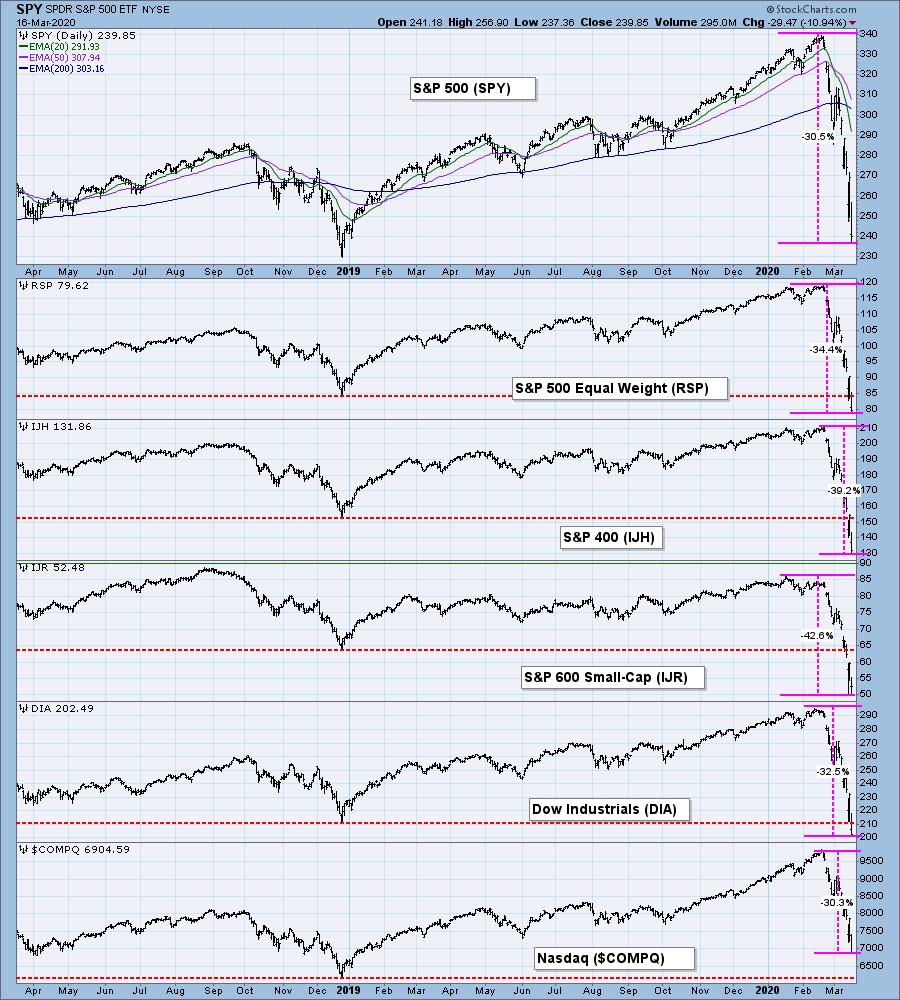
Below is an update of my broad market index chart, unbelievable numbers right now:
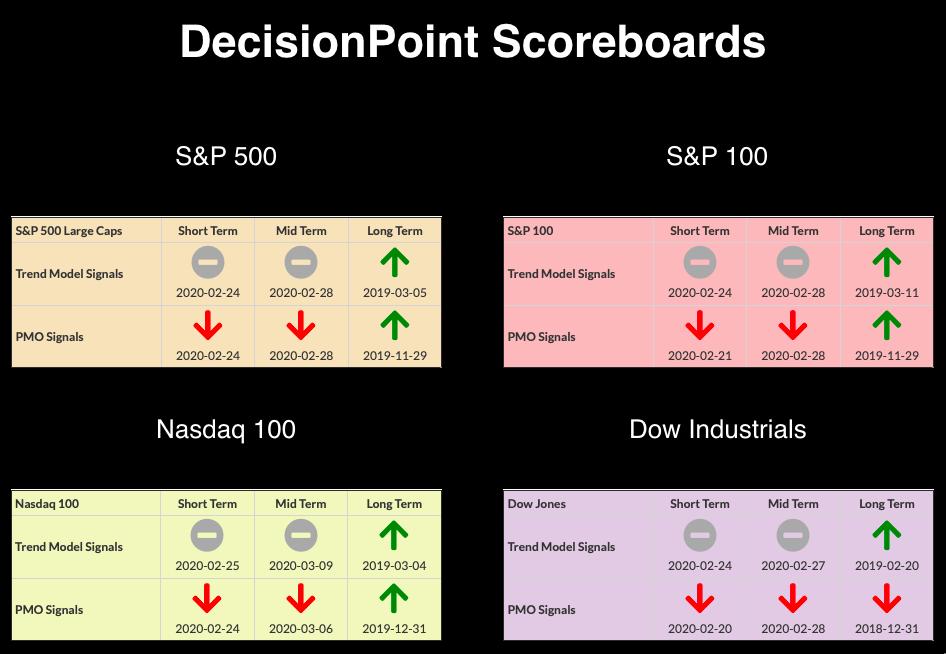
CURRENT BROAD MARKET DP Signals:
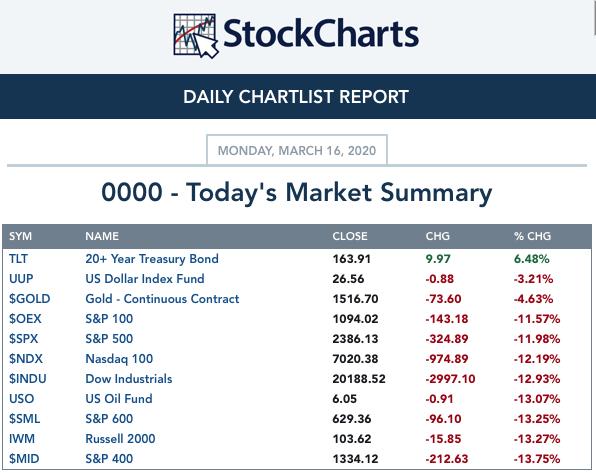
TODAY'S Broad Market Action:
Past WEEK Results: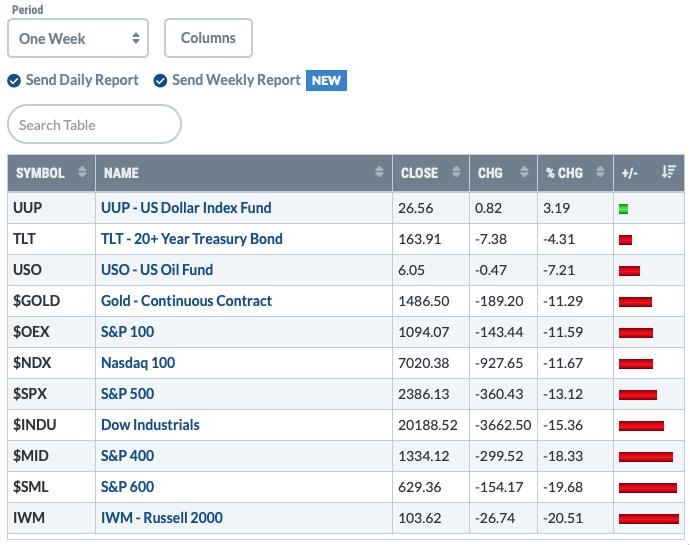
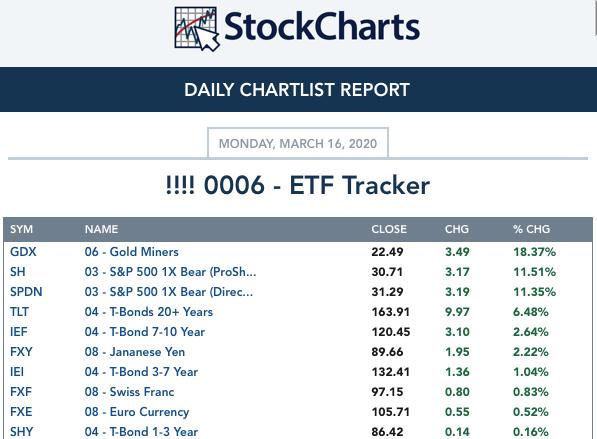
Top 10 from ETF Tracker:
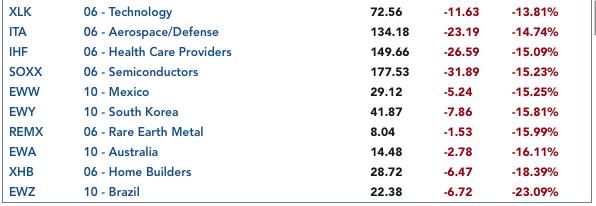
Bottom 10 from ETF Tracker:
On Friday, the DecisionPoint Alert Weekly Wrap presents an assessment of the trend and condition of the stock market (S&P 500), the U.S. Dollar, Gold, Crude Oil, and Bonds. Monday through Thursday the DecisionPoint Alert daily report is abbreviated and covers changes for the day.
Watch the latest episode of DecisionPoint on StockCharts TV's YouTube channel here!
SECTORS
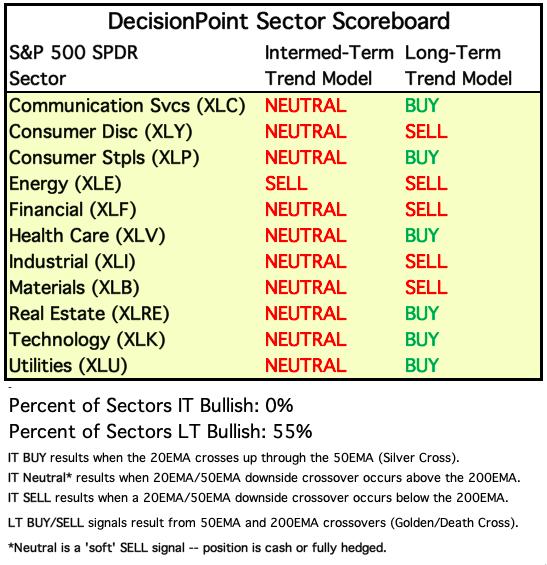
SIGNALS:
Each S&P 500 Index component stock is assigned to one, and only one, of 11 major sectors. This is a snapshot of the Intermediate-Term (Silver Cross) and Long-Term (Golden Cross) Trend Model signal status for those sectors.
TODAY'S RESULTS:
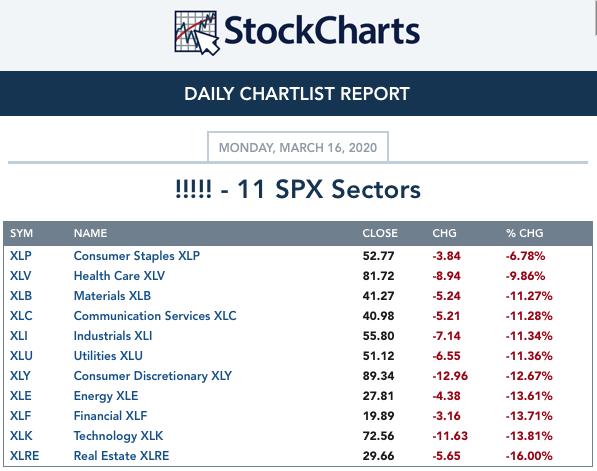
One WEEK Results: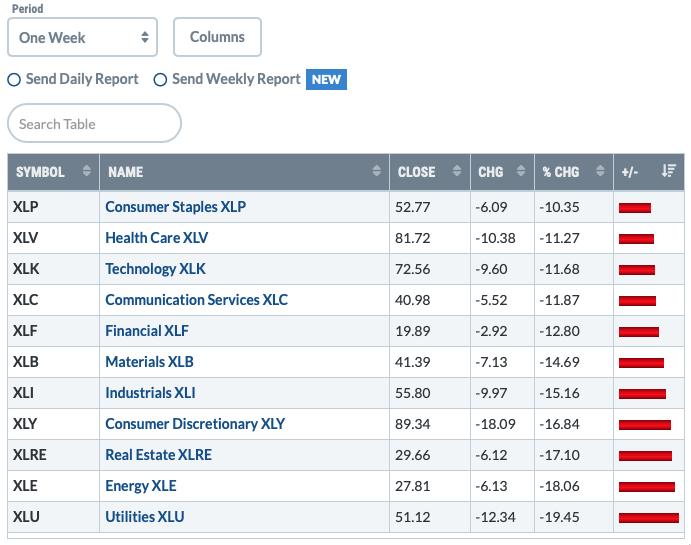
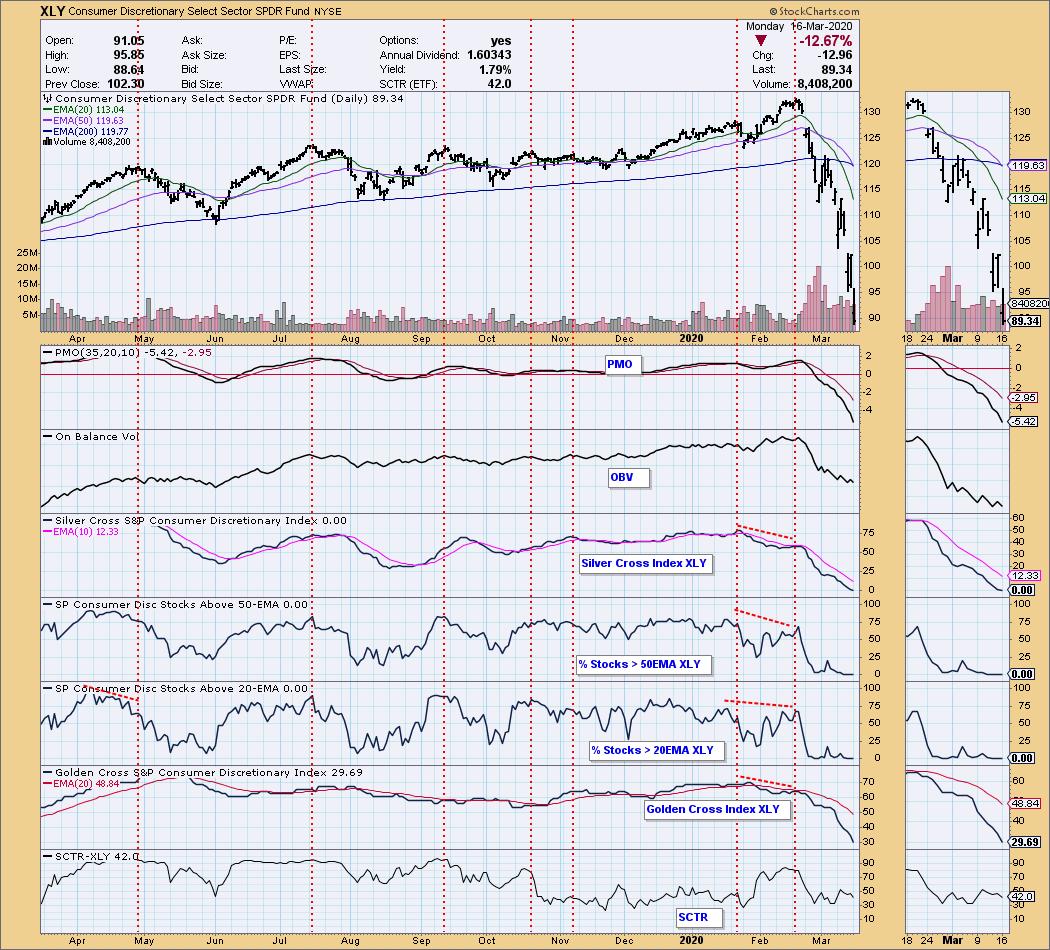
NEW SIGNAL CHANGE: Long-Term Trend Model SELL signal on Consumer Discretionary (XLY). The 50-EMA has dropped below the 200-EMA.
STOCKS
IT Trend Model: NEUTRAL as of 2/28/2020
LT Trend Model: BUY as of 2/26/2019
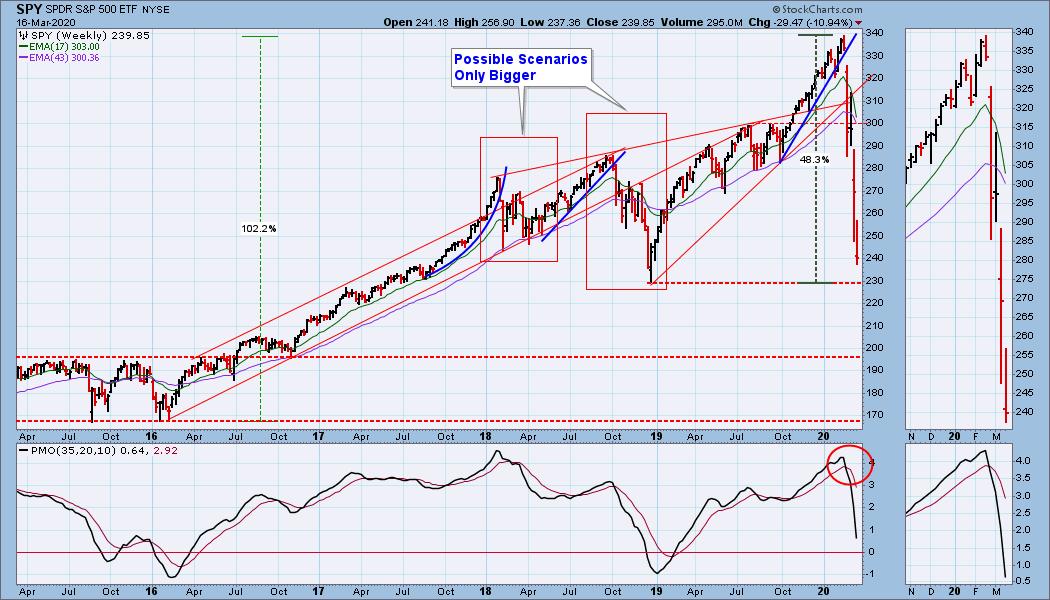
SPY Daily Chart: While the daily chart is helpful, I have included below the daily chart Carl's weekly chart with historical perspective and simply to determine the next level of support which can't be found on the daily chart. 230 for the SPY is the next major support level which is right at the 2018 low. Given that the SPY closed at 239.85, I suspect that level will be tested and likely lost tomorrow barring a relief rally.
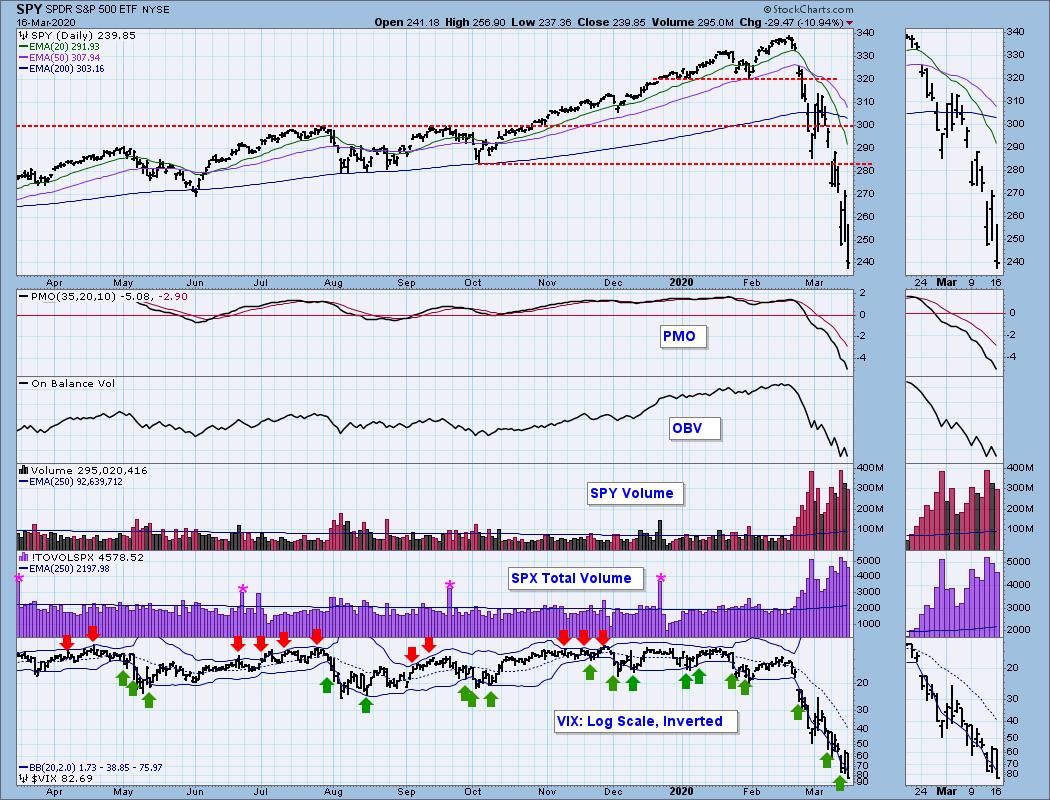
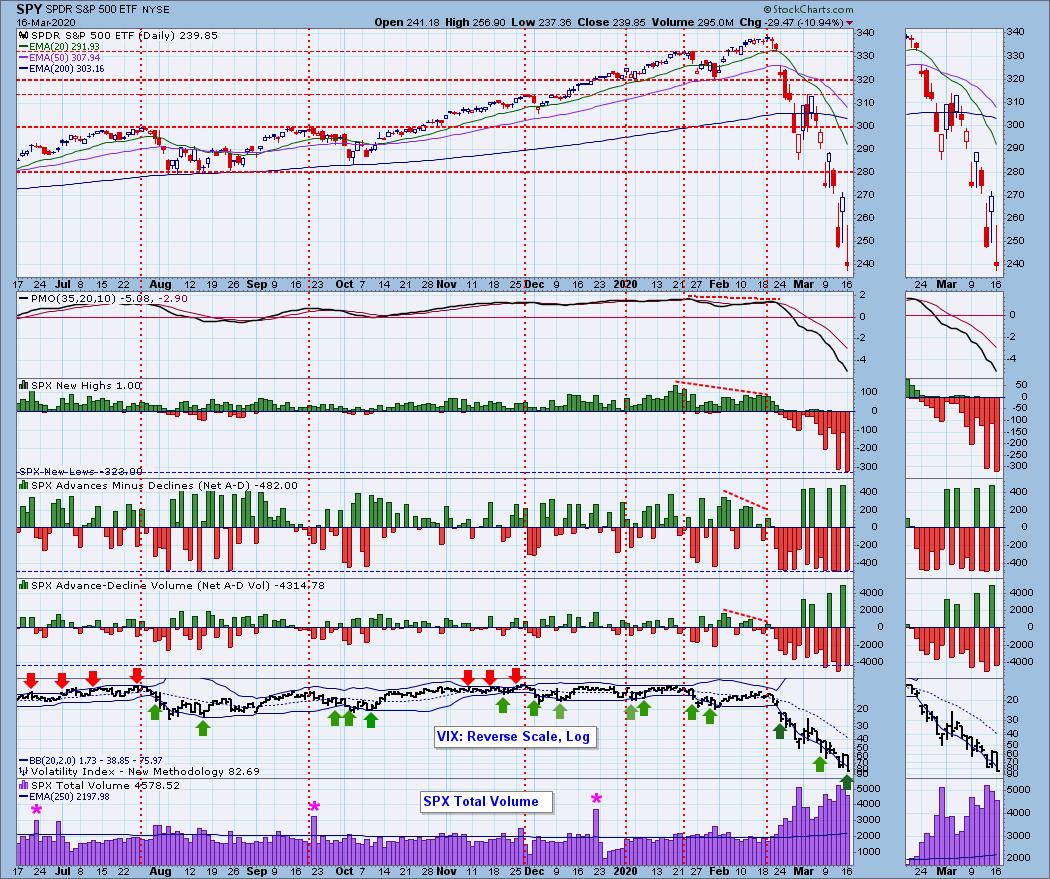
Climactic Market Indicators: Short-term climactic readings continue to make their own history with extreme readings to both the downside and upside. Even under normal circumstances I would look at these readings coming off a nice rally on Friday as a selling initiation not exhaustion. The VIX is now reading above 82! Now is not the time to try to pick up bargains, these wild swings are not your friend. For my dollar cost averaging friends who are continuing to put in their monthly contributions and buy on the way down are going to lose money out of the gate. My best advice is to PRESERVE capital by moving into cash and be ready when the market does turn back up. You will be glad that you have that cash to participate in the fullest!
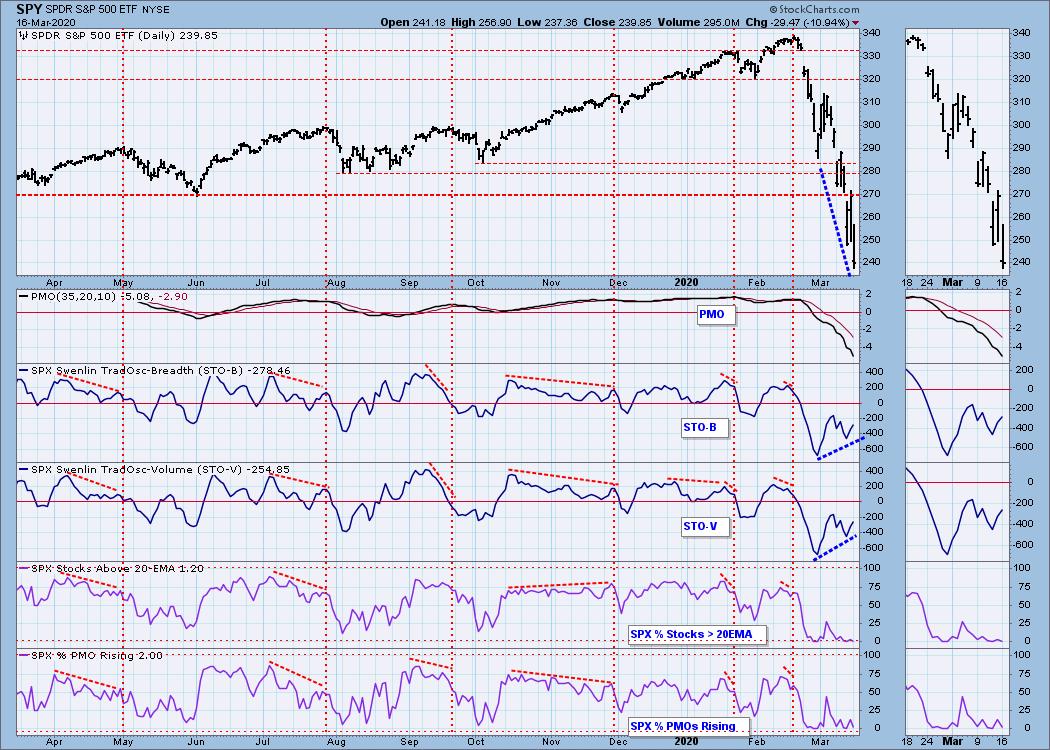
Short-Term Market Indicators: The ST trend is DOWN and the market condition is OVERSOLD based upon the Swenlin Trading Oscillator (STO) readings. This is an example of an oscillator having to oscillate. We did see the STOs decelerate but continue to rise. I hate to keep using "normal circumstances", but generally speaking, rising bottoms on an indicator and price bottoms declining, that's a positive divergence. That divergence was set up on Friday. It didn't work out.
Intermediate-Term Market Indicators: The Silver Cross Index (% of SPX stocks 20EMA > 50EMA) and the Golden Cross Index (percent of SPX stocks 50EMA > 200EMA) are declining. The SCI is now slightly lower than it was at the end of the 2018 correction. We are finally seeing the GCI in oversold territory, but it could move even lower. I expect to see the SCI at zero before we finally bottom.
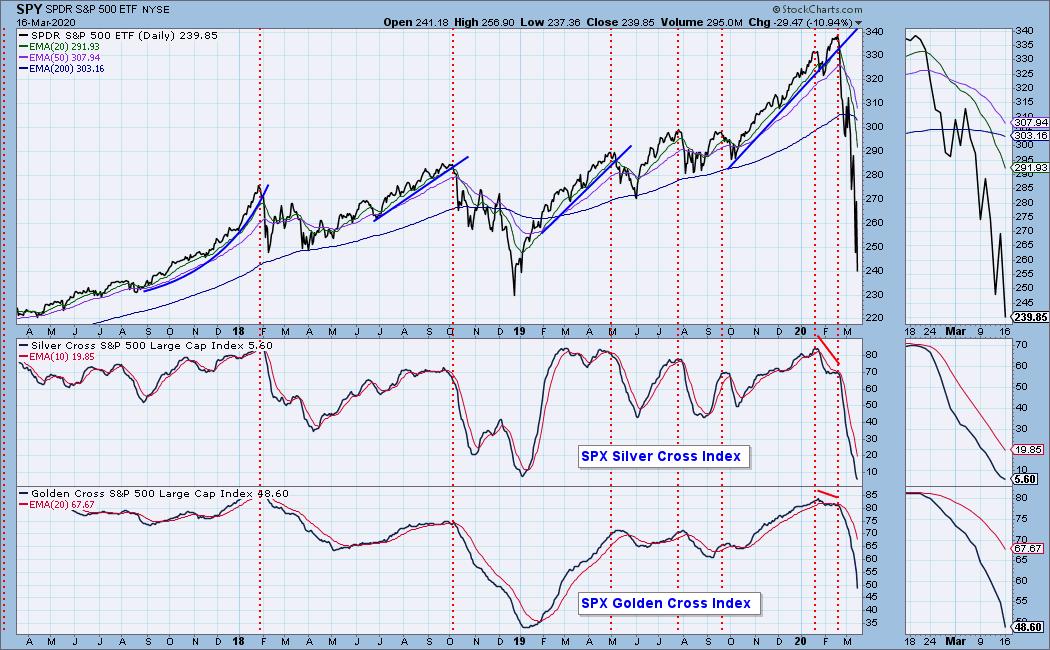
The IT trend is DOWN and the market condition is EXTREMELY OVERSOLD based upon all of the readings on the indicators below. More historic lows for these indicators with no indication they will bottom.
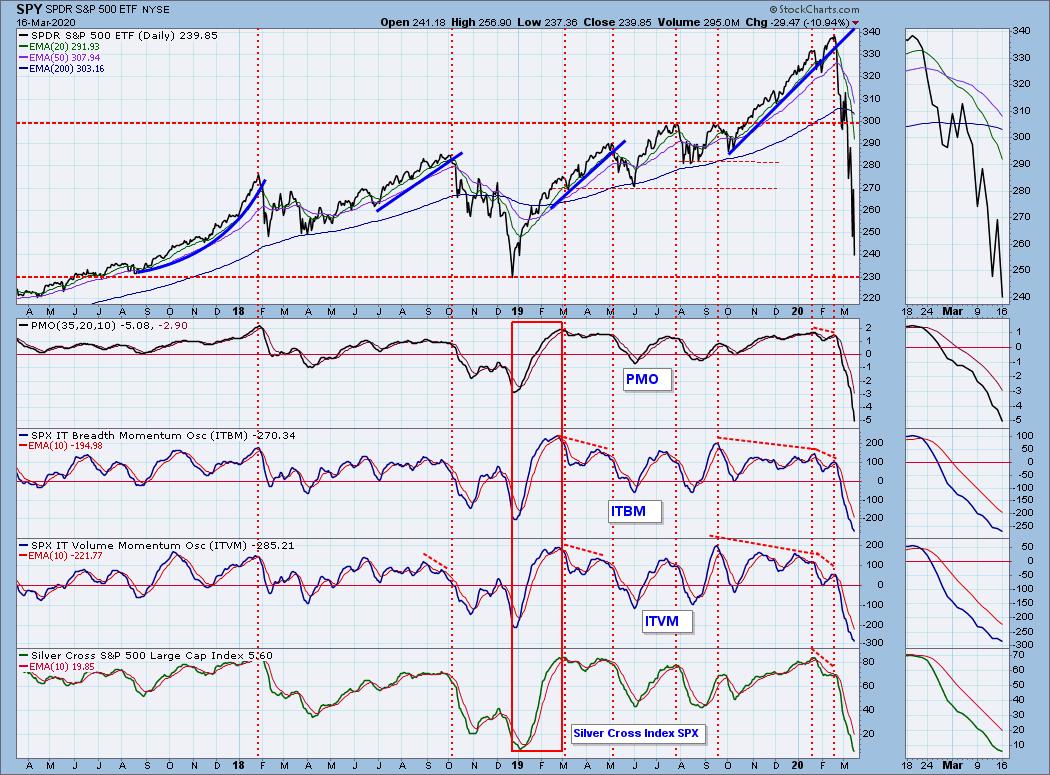
CONCLUSION: The ST and IT trends are DOWN. Market condition based on ST and IT indicators is VERY OVERSOLD. My friends keep asking my advice. I tell them to move to cash if they haven't already, but they all want to make excuses for the market and tell me they are still buying so they are getting more shares! They are also losing that investment on the way down. I explain this to them and I have now determined they don't really want my advice, they want someone to allay their fears and tell them it is going to be alright. It will be alright, but not for awhile, so protect yourself! Quarantine your investments in cash. You will get those bargain shares and not have to suck up the loss buying on the way down. "Wait! I might miss the bottom!", they say. Trust me, folks, you won't miss the bottom. There is a lot of ground to make up, over 30% right now. You'll get to take advantage. And, DecisionPoint will be there to give you the high sign.
(Not a Diamonds subscriber? Add it to your DP Alert subscription and get a discount! Contact support@decisionpoint.com for your limited time coupon code!)
DOLLAR (UUP)
IT Trend Model: NEUTRAL as of 3/9/2020
LT Trend Model: BUY as of 5/25/2018
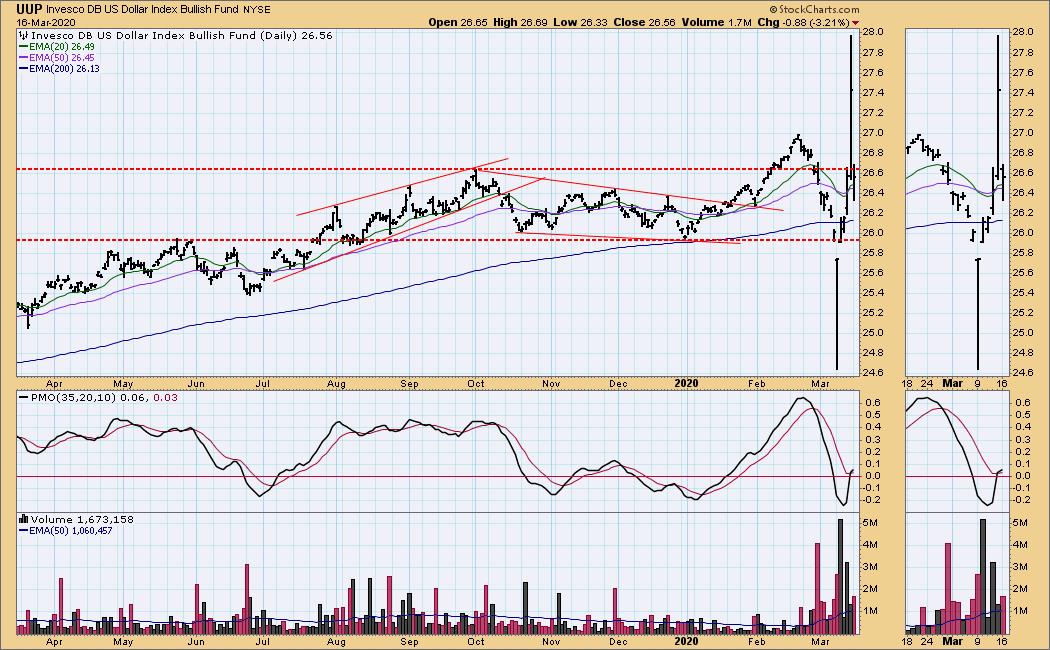
UUP Daily Chart: The Dollar lost ground today and ended up back below the October top. Good news is that we do see a PMO BUY signal coming in just above the zero line.
GOLD
IT Trend Model: BUY as of 12/26/2019
LT Trend Model: BUY as of 1/8/2019
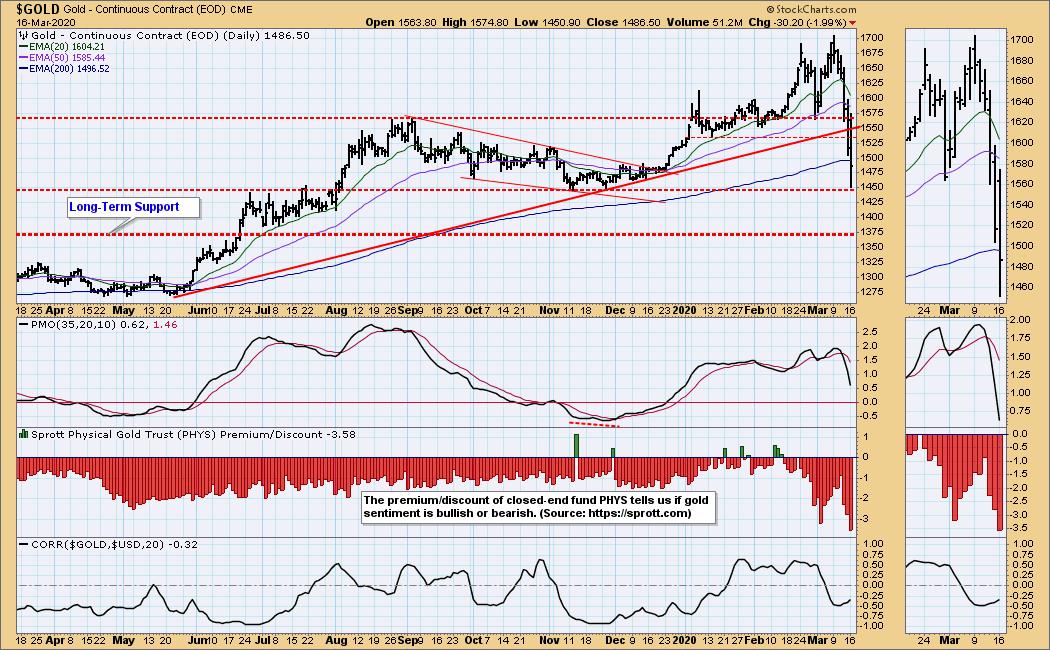
GOLD Daily Chart: With UUP losing over 3%, it is somewhat surprising to see Gold down 2%. The intraday low did hold support at the late 2019 lows, but it failed to hold the 200-EMA. The PMO is pointed straight down. My gut tells me this level will hold, but technically, looking at the chart and the indicators, I'm not very confident.
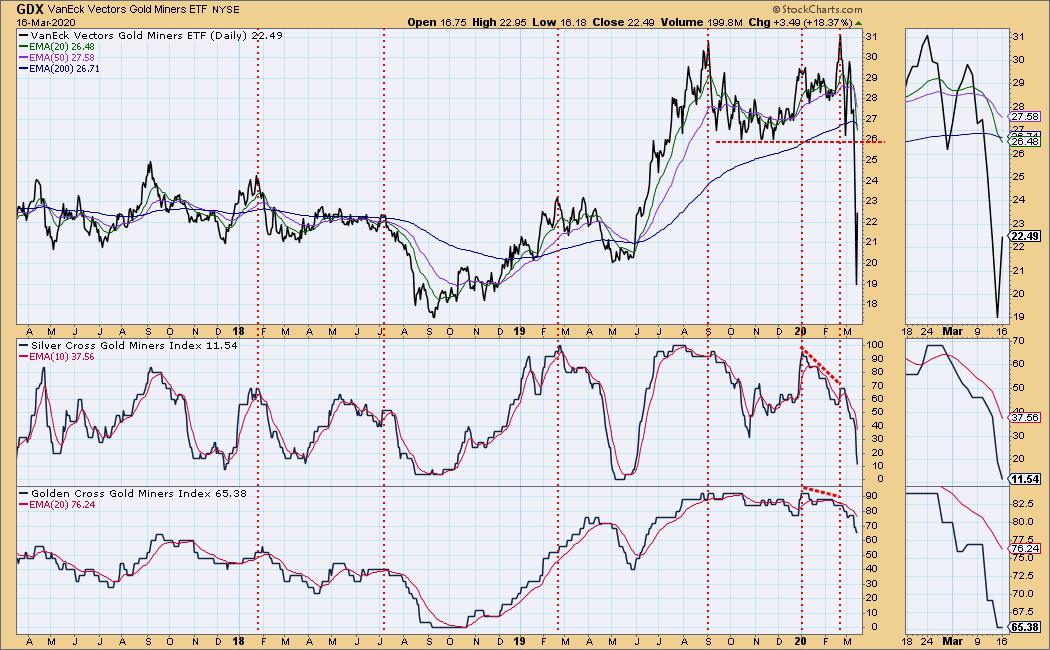
GOLD MINERS Golden and Silver Cross Indexes: More support levels being broken. Next area of support is now the 2018 lows.
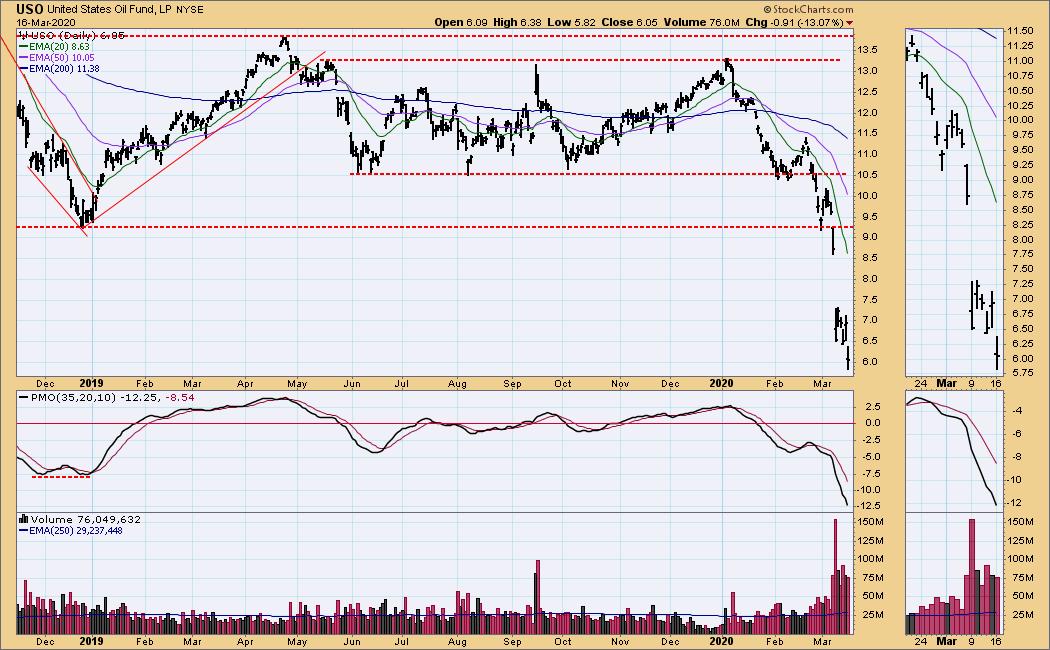
CRUDE OIL (USO)
IT Trend Model: Neutral as of 1/27/2020
LT Trend Model: SELL as of 2/3/2020
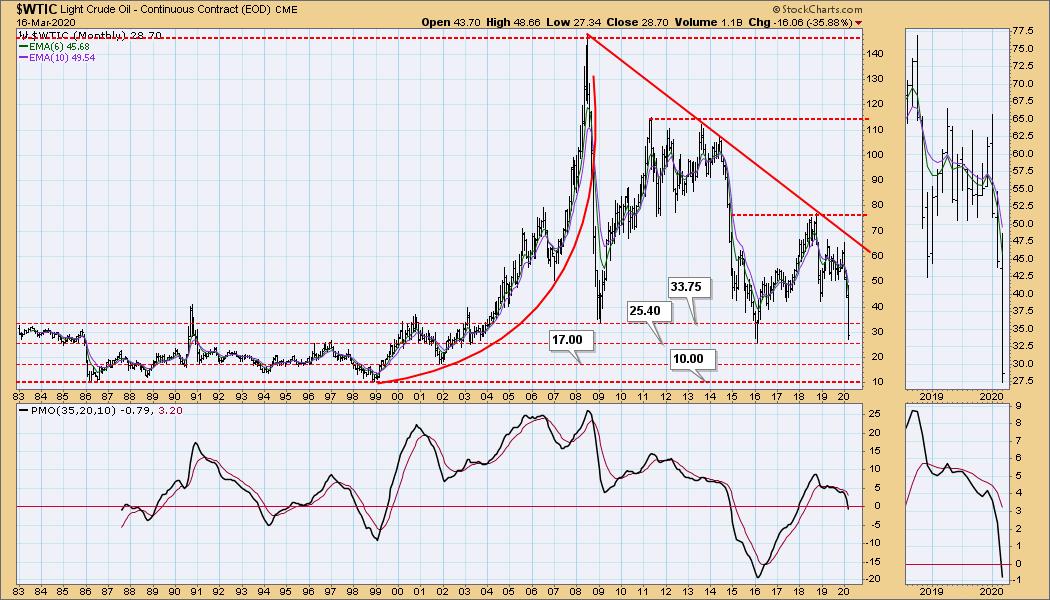
USO Daily Chart: Oil and USO are falling to historic lows (I feel as though I'm using the word "historic" a lot lately). The PMO is ugly. The weekly chart under the daily chart, suggest that $25.40 is the next stop for $WTIC.
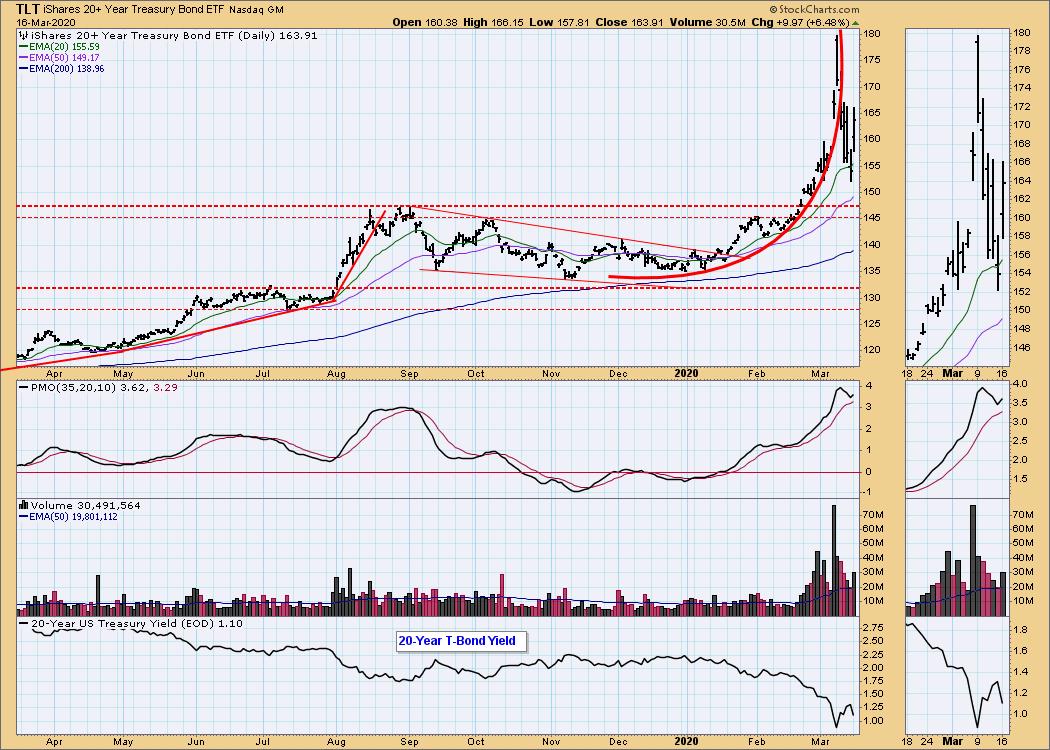
BONDS (TLT)
IT Trend Model: BUY as of 1/22/2020
LT Trend Model: BUY as of 1/2/2019
TLT Daily Chart: Bonds gained today and consequently the PMO ticked up. The PMO is very overbought and given the break of the parabolic, I would look for more chop and volatility.
Have you subscribed the DecisionPoint Diamonds yet? DP does the work for you by providing handpicked stocks/ETFs from exclusive DP scans! Add it with a discount! Contact support@decisionpoint.com for more information!
Technical Analysis is a windsock, not a crystal ball.
Happy Charting! - Erin
Email: erin@decisionpoint.com
If there is a Money Show in May, I will be there! Erin Swenlin will be presenting at the The MoneyShow Las Vegas May 11-13, 2020! You'll have an opportunity to meet Erin and discuss the latest DecisionPoint news and Diamond Scans. Claim your FREE pass here! You can watch online with this pass too!!
NOTE: The signal status reported herein is based upon mechanical trading model signals, specifically, the DecisionPoint Trend Model. They define the implied bias of the price index based upon moving average relationships, but they do not necessarily call for a specific action. They are information flags that should prompt chart review. Further, they do not call for continuous buying or selling during the life of the signal. For example, a BUY signal will probably (but not necessarily) return the best results if action is taken soon after the signal is generated. Additional opportunities for buying may be found as price zigzags higher, but the trader must look for optimum entry points. Conversely, exit points to preserve gains (or minimize losses) may be evident before the model mechanically closes the signal.
Helpful DecisionPoint Links (Can Be Found on DecisionPoint.com Links Page):
DecisionPoint Shared ChartList and DecisionPoint Chart Gallery
Price Momentum Oscillator (PMO)
Swenlin Trading Oscillators (STO-B and STO-V)
