
DecisionPoint maintains a chart list for member's composed of the 11 S&P SPDR Sectors, and every day I review and update the annotations to those charts. One thing I noticed in the last few weeks is the negative divergences developing on the Technology Sector (XLK) chart. To begin, there was a small pullback after the January price top, then there was another short rally to new, all-time highs this month; however, we can see that four of the indicators declined during that rally: (1) OBV showed that volume was drying up; (2) the Silver Cross Index showed a -22% decrease of stocks with the 20EMA above the 50EMA; and (3) the percentage of stocks above their 20EMA and 50EMA decreased about -25% each. These were concrete signs that participation in the Technology Sector rally was fading, and that some kind of correction was likely.
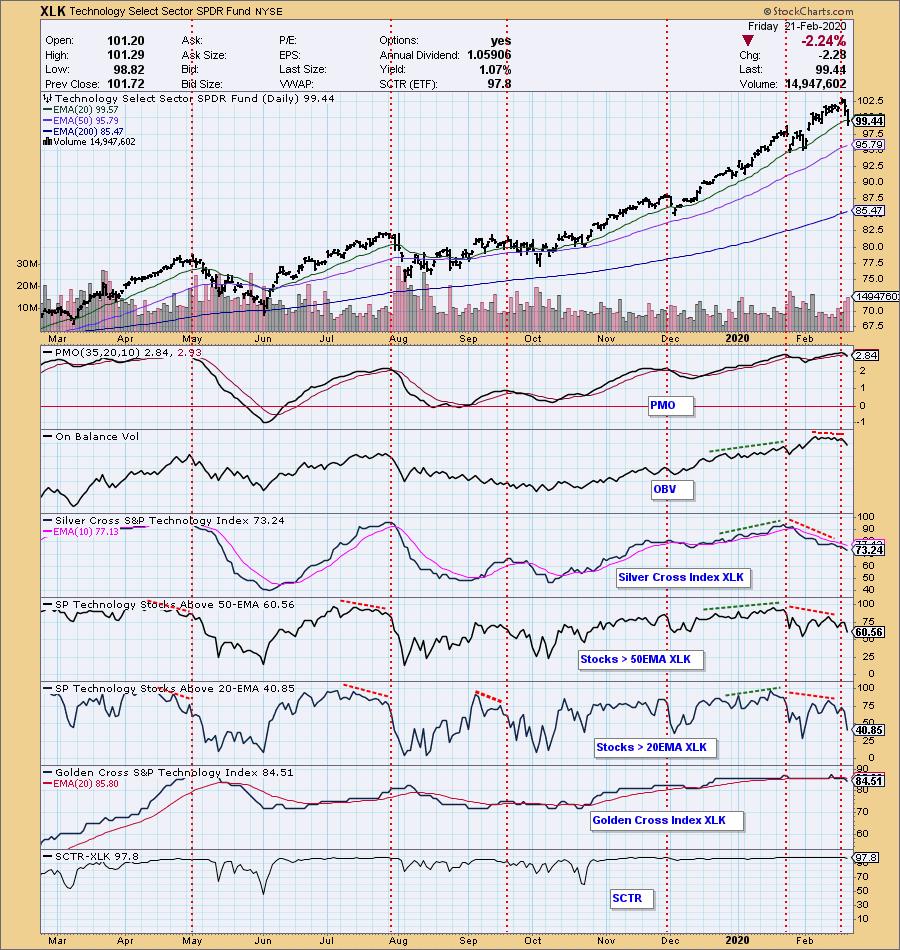
These negative divergences are a gift that we don't always get. Note how the indicators behaved during the rally from the December price low -- all they did was confirm the rally by moving higher themselves, and the January correction appeared without warning, at least not from these indicators.
The negative divergences are a strong hint that something untoward is probably about to happen, but they are not infallible. Participation can narrow, but the large-cap stocks may still be able to support the rising trend. Nevertheless, those divergences will nail it more often than not.
The DecisionPoint Alert Weekly Wrap presents an end-of-week assessment of the trend and condition of the Stock Market, the U.S. Dollar, Gold, Crude Oil, and Bonds. The DecisionPoint Alert daily report (Monday through Thursday) is abbreviated and gives updates on the Weekly Wrap assessments.
Watch the latest episode of DecisionPoint on StockCharts TV's YouTube channel here!
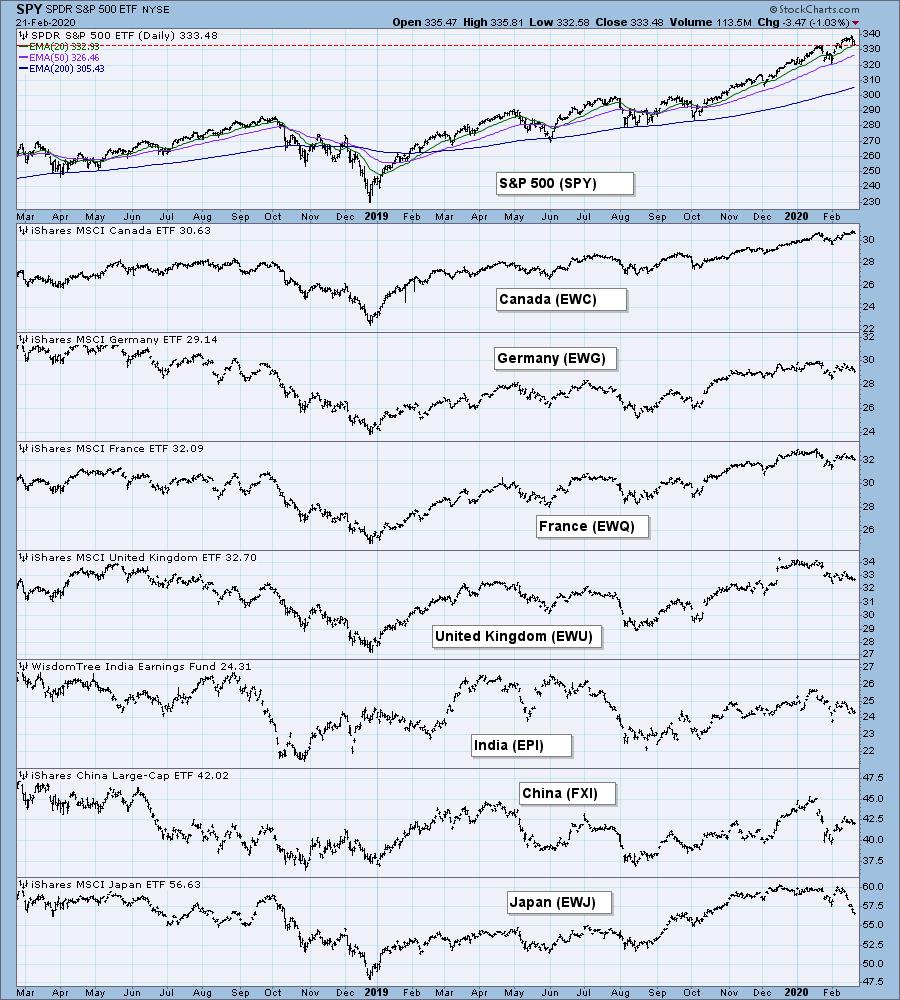
GLOBAL MARKETS
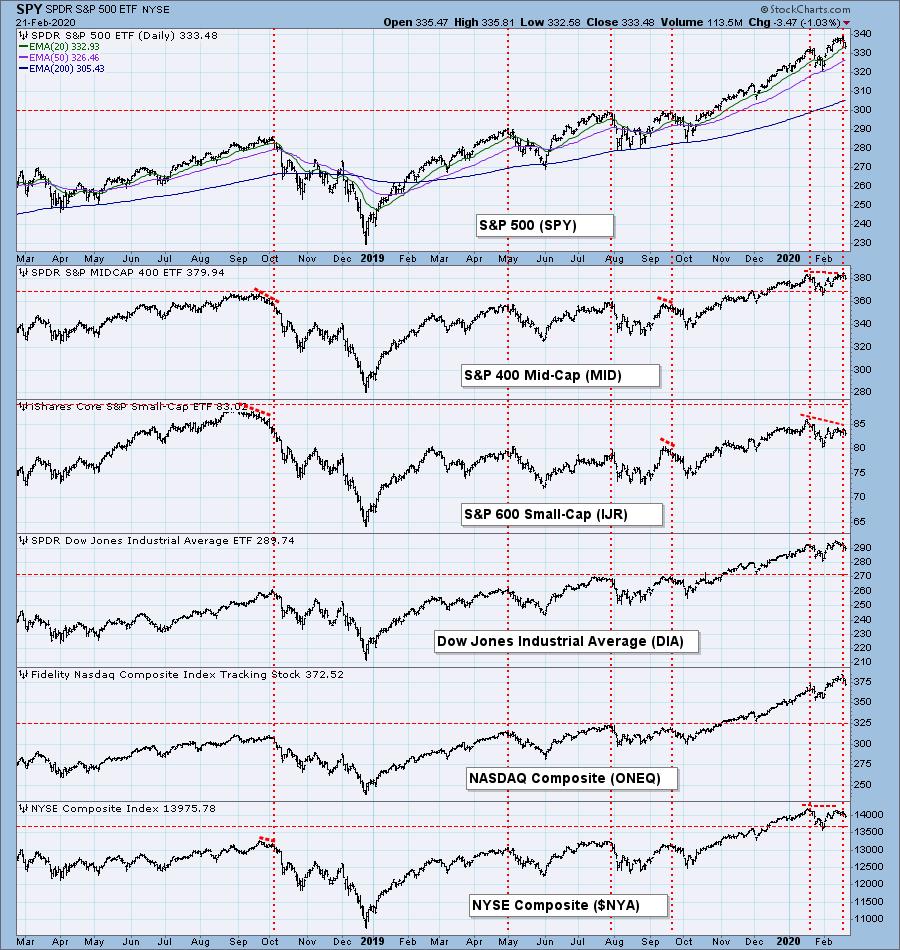
BROAD MARKET INDEXES
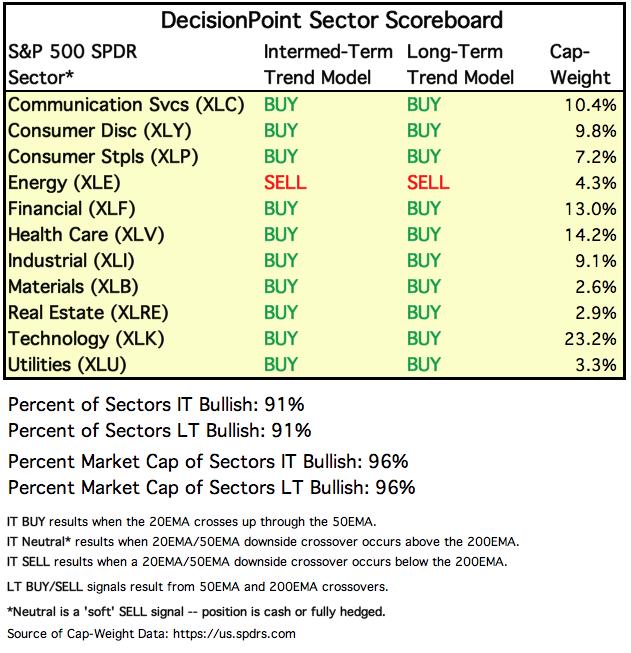
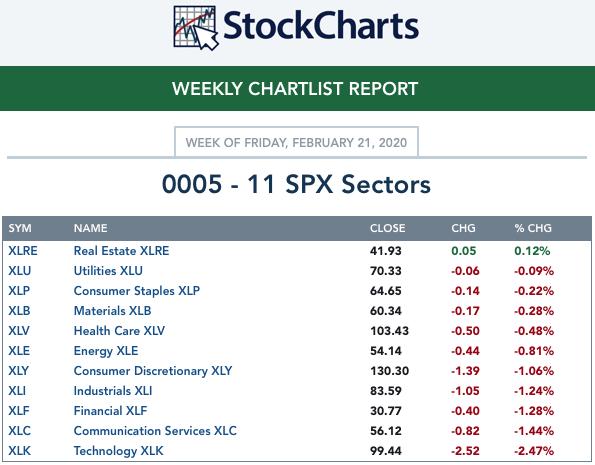
SECTORS
Each S&P 500 Index component stock is assigned to one, and only one, of 11 major sectors. This is a snapshot of the Intermediate-Term (Silver Cross) and Long-Term (Golden Cross) Trend Model signal status for those sectors.
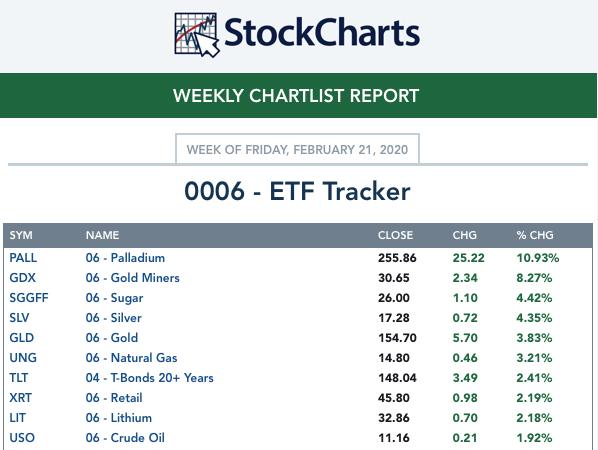
ETF TRACKER: This is a list of about 100 ETFs intended to track a wide range of U.S. market indexes, sectors, global indexes, interest rates, currencies, and commodities. StockCharts.com subscribers can acquire it in the DecisionPoint Trend and Condition ChartPack.
Top 10 . . .
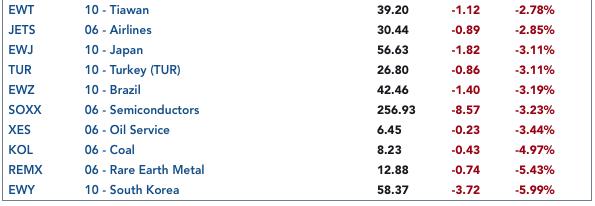
. . . and bottom 10:
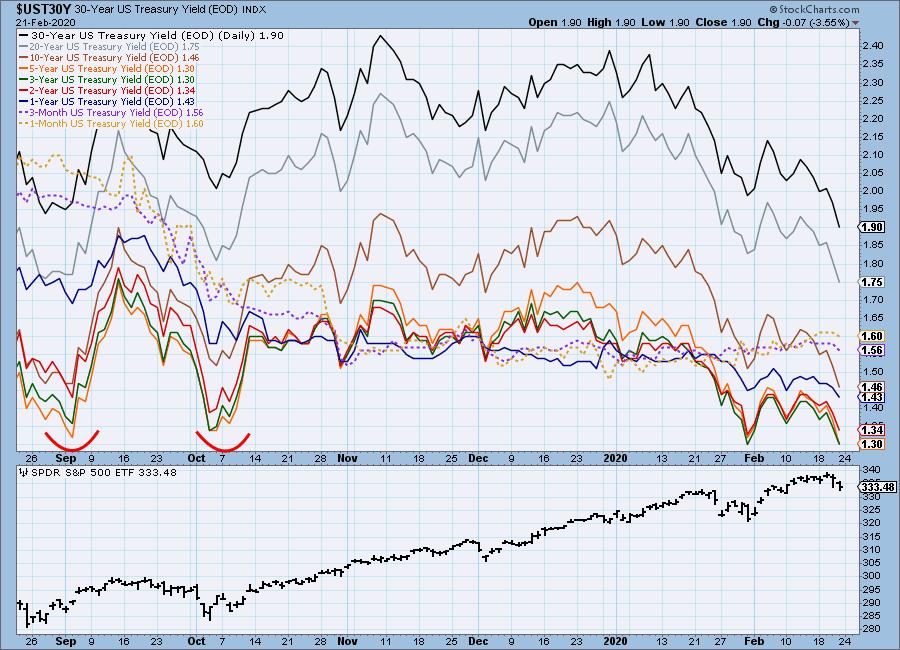
INTEREST RATES
This chart is included so we can monitor rate inversions. In normal circumstances the longer money is borrowed the higher the interest rate that must be paid. When rates are inverted, the reverse is true.
STOCKS
IT Trend Model: BUY as of 9/6/2019
LT Trend Model: BUY as of 2/26/2019
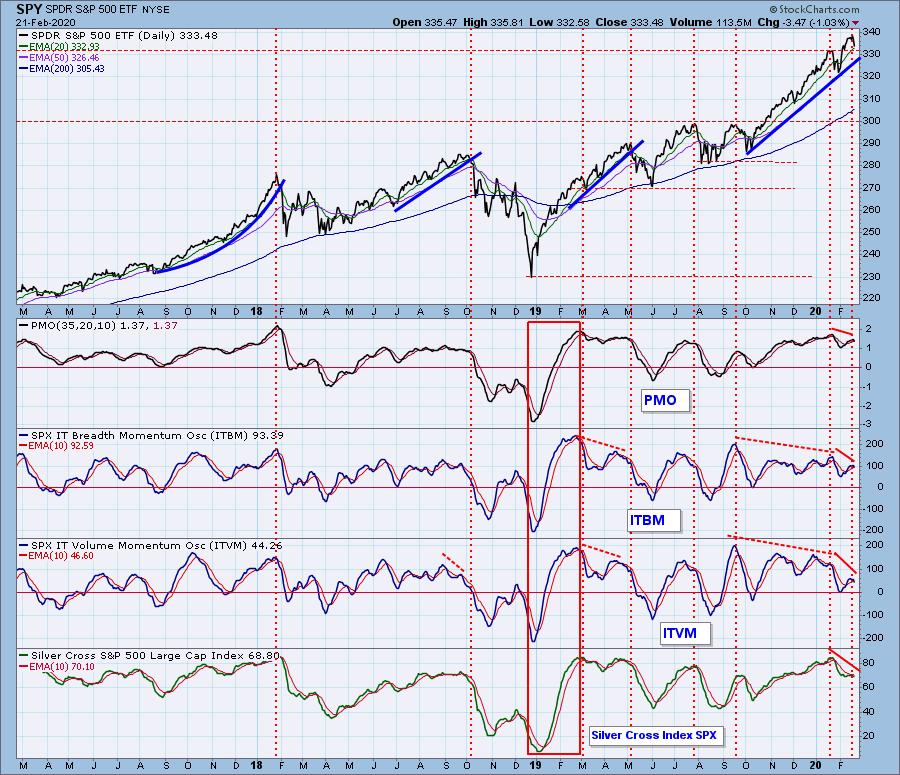
SPY Daily Chart: Yesterday SPY penetrated the bottom of a short-term rising wedge, but couldn't make it stick. Today was a different story, but the support line drawn across the January top impeded excessive downward progress. The VIX didn't quite reach the bottom Bollinger Band, but it is possible that we will see continued weak price action similar to the short January decline if the VIX breaks through the band. Being so close to the band, the VIX is also oversold, so it is also possible that we'll see a bounce.
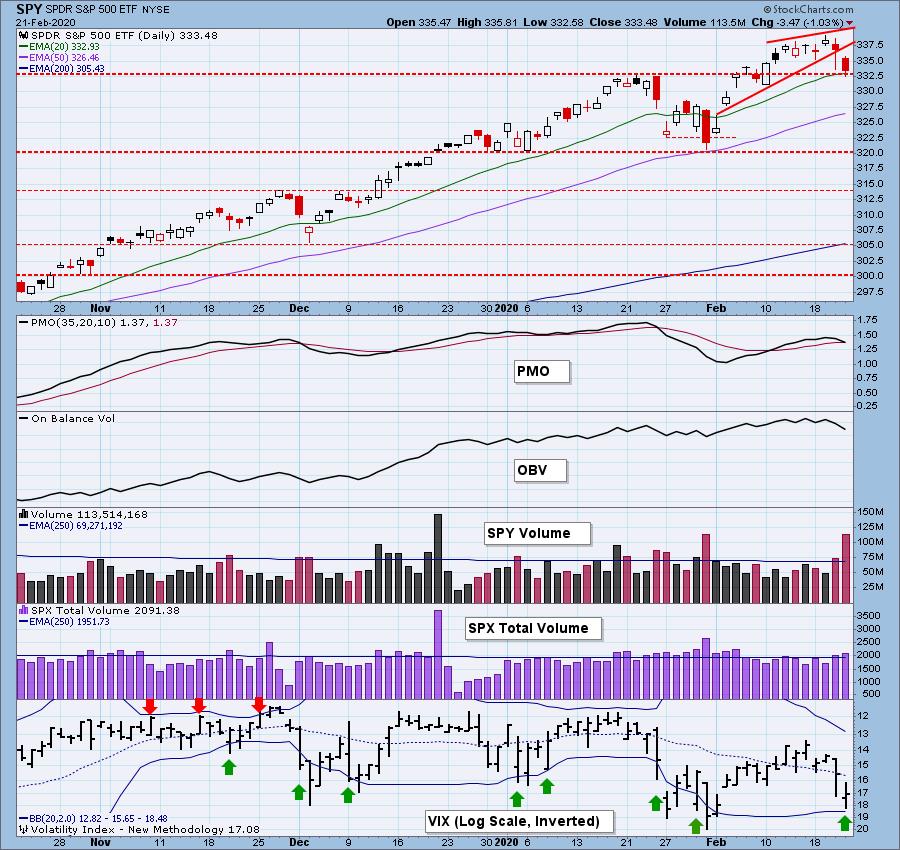
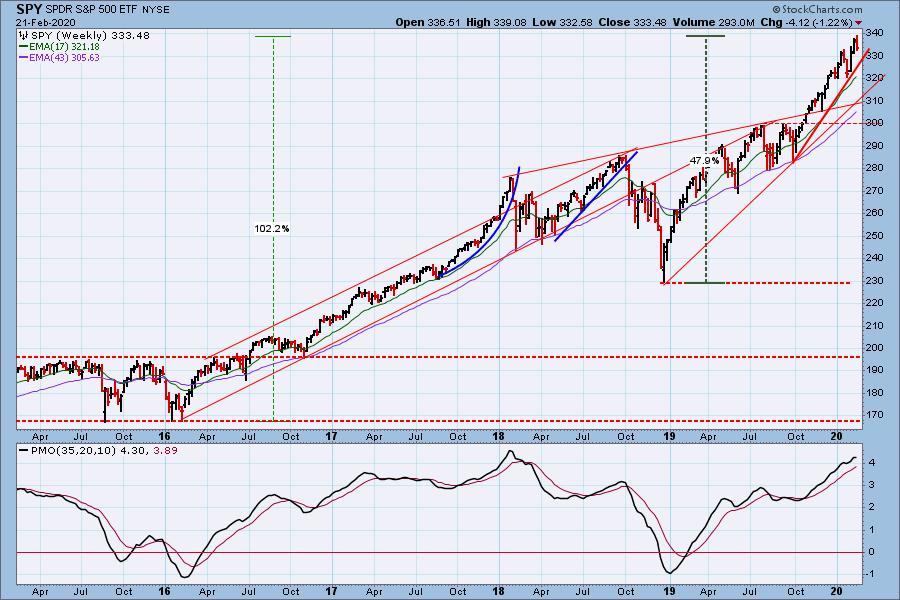
SPY Weekly Chart: The weekly PMO is very overbought and it seems ready to turn down.
Climactic Market Indicators: On Friday there were climactic readings for net breadth and net volume, and because SPY has just turned down, I will consider it to be an initiation climax -- initiation for continued downside. The PMO crossed down through the signal line (PMO SELL signal).
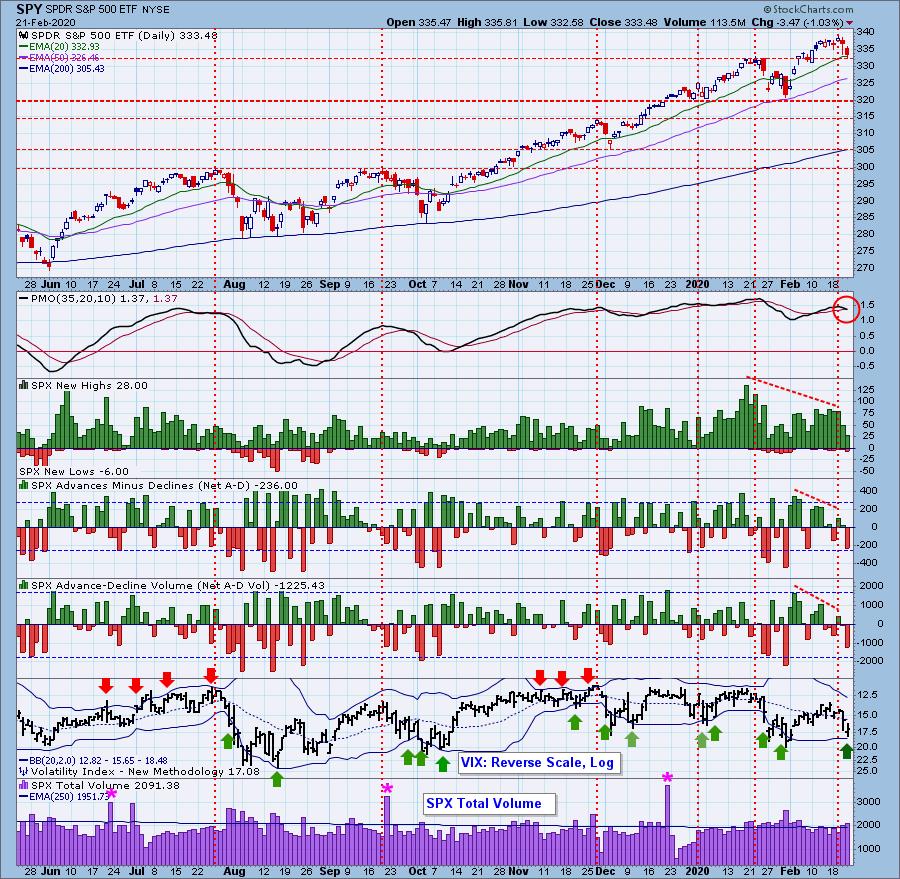
Short-Term Market Indicators: The short-term market trend is DOWN and the condition is NEUTRAL.
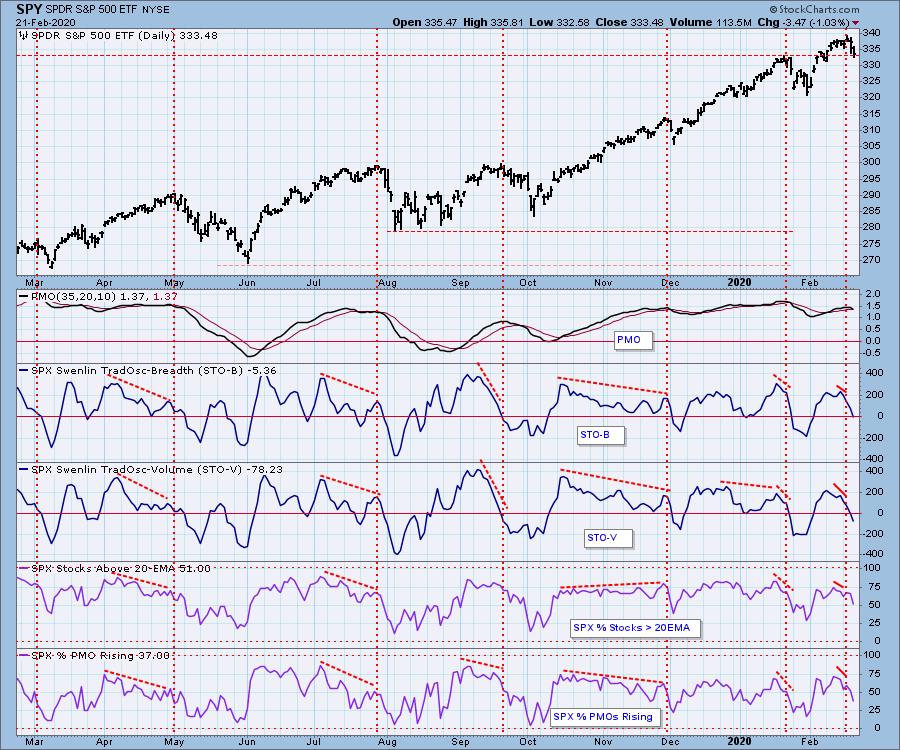
Intermediate-Term Market Indicators: These indexes show the percentage of long-term BUY signals (Golden Cross) and intermediate-term BUY signals (Silver Cross). Both have diverged negatively from the rally of the last three weeks, and note that both indexes are falling.
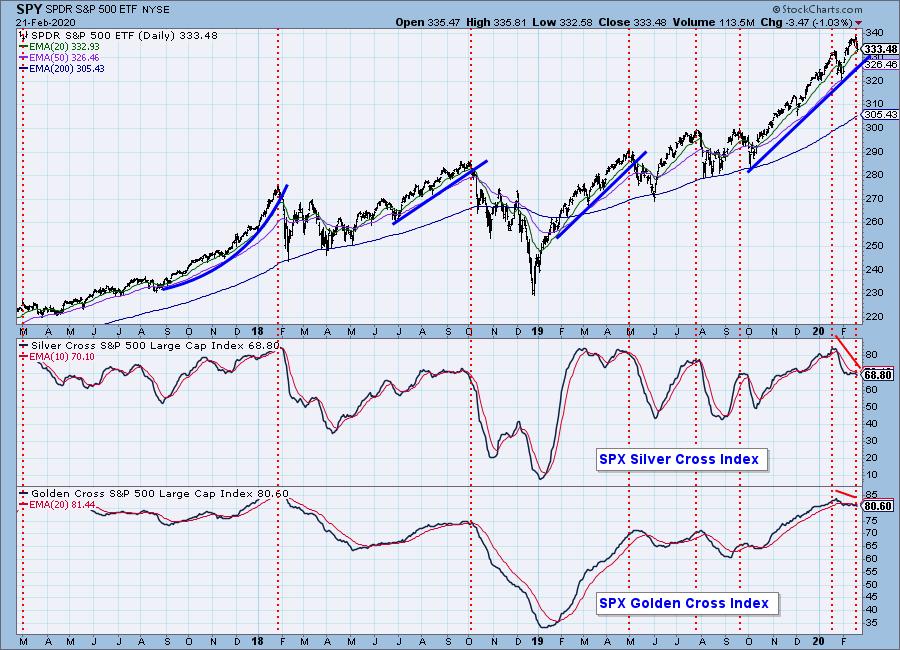
The intermediate-term market trend is UP and the condition is SOMEWHAT OVERBOUGHT. The negative divergences spell trouble., and all four indicators are below their signal line and falling.
CONCLUSION: The market trend is UP but TURNING and the market condition is OVERBOUGHT. The market has so resilient that it is hard to think that anything more than a minor pullback is possible. A critical breakdown below the January top hasn't happened yet, but that could be the first move on Monday. Indicators in the short- and intermediate-term are falling, and negative divergences are abundant, so I think that next week will be negative. That may just be the beginning.
Have you subscribed the DecisionPoint Diamonds yet? DP does the work for you by providing handpicked stocks/ETFs from exclusive DP scans! Add it with a discount! Contact support@decisionpoint.com for more information!
DOLLAR (UUP)
IT Trend Model: BUY as of 1/22/2020
LT Trend Model: BUY as of 5/25/2018
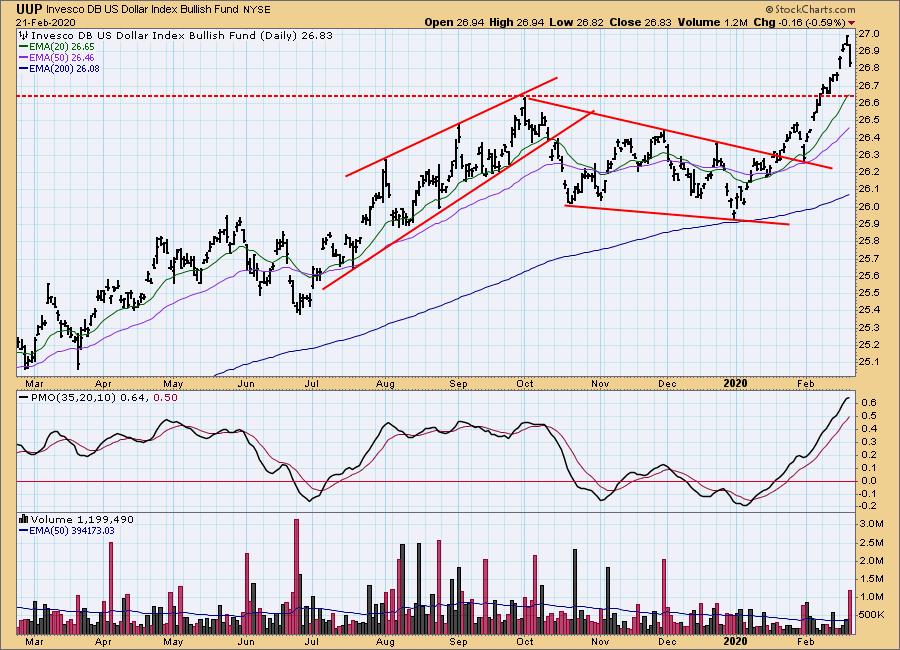
UUP Daily Chart: UUP tried to extend the momentum for the breakout this week, but it closed near the lows for this week. The PMO is very overbought in this time frame, and it is trying to top.
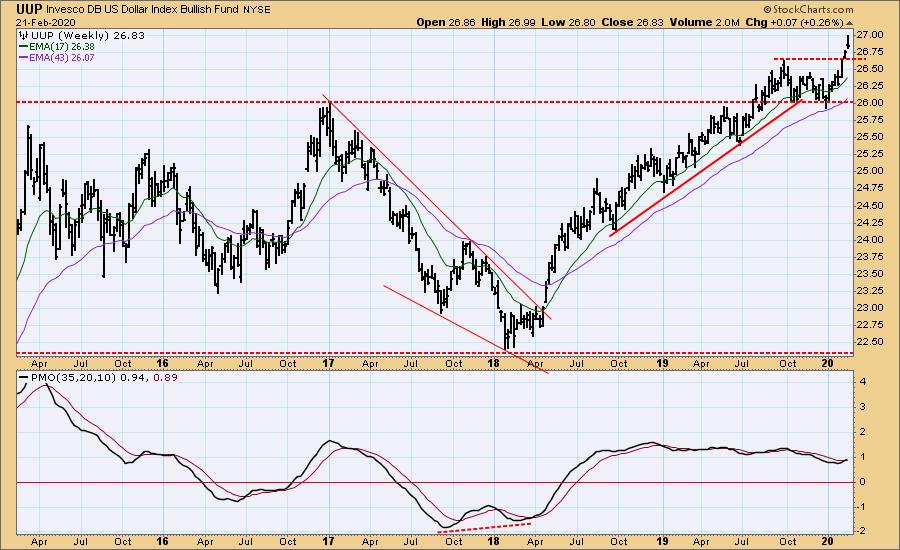
UUP Weekly Chart: If I used a candlestick chart, this week's candle would be a bearish shooting star. Even so, price is well above the long-term support at 26, so UUP may drop back into that recent trading range.
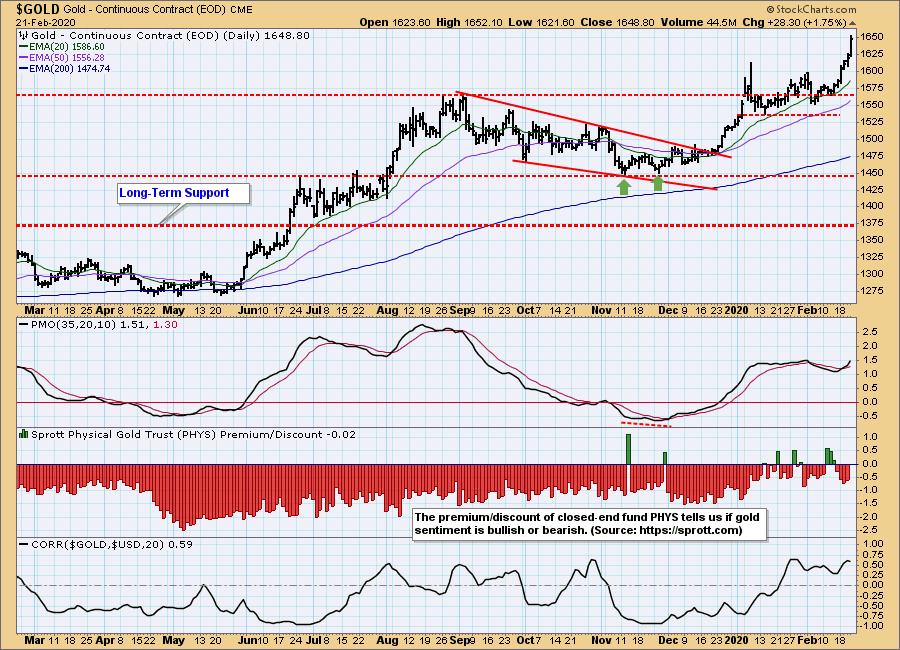
GOLD
IT Trend Model: BUY as of 12/26/2019
LT Trend Model: BUY as of 1/8/2019
GOLD Daily Chart: After a one-month consolidation, gold has made a solid breakout. The daily PMO has plenty of room before it becomes overbought, so I'm expecting the rally to continue. The next thing we need to see is for sentiment to turn bullish and remain that way.
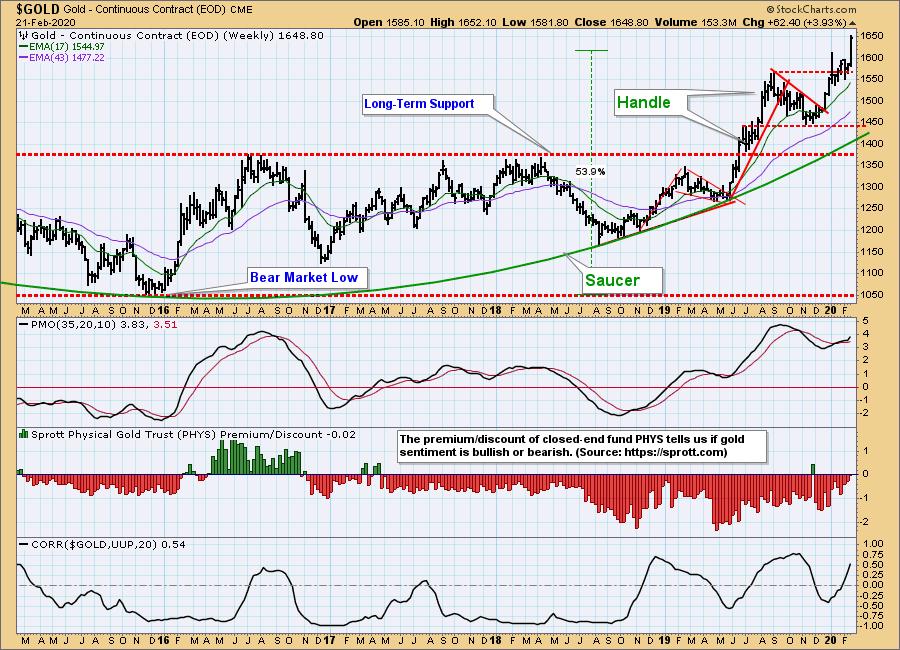
GOLD Weekly Chart: The saucer with handle formation has certainly delivered on its bullish promise.
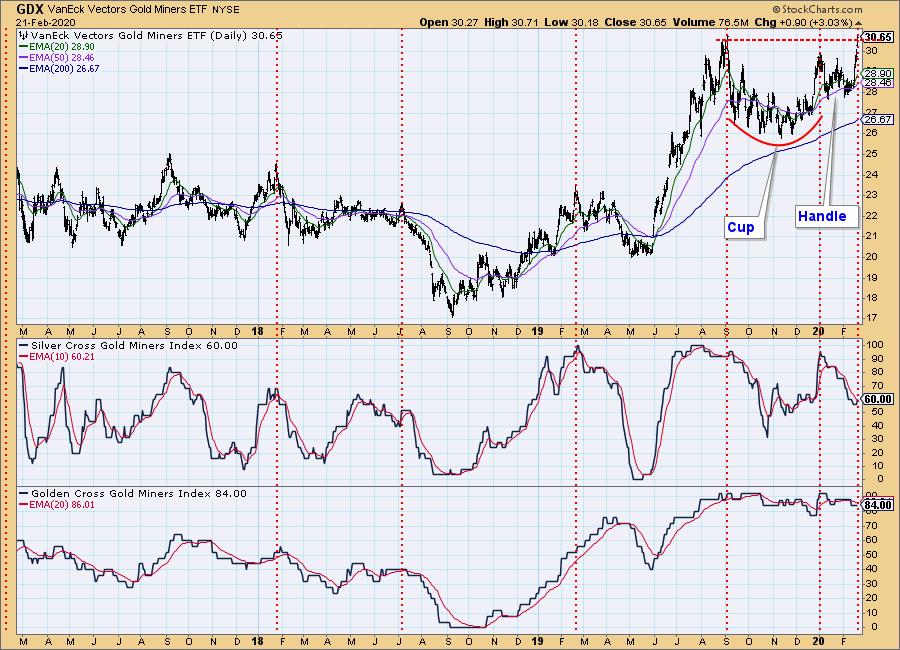
GOLD MINERS Golden and Silver Cross Indexes: A breakout is in progress. While the Silver Cross Index absorbed a correction, the Golden Cross Index has held solidly near the top of its range, and it implies that the rally will continue.
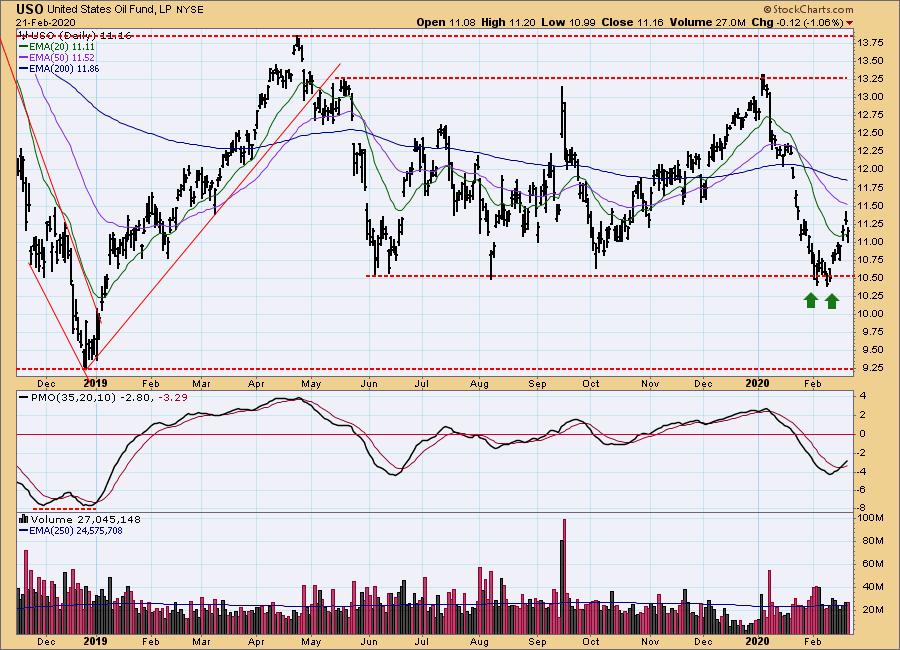
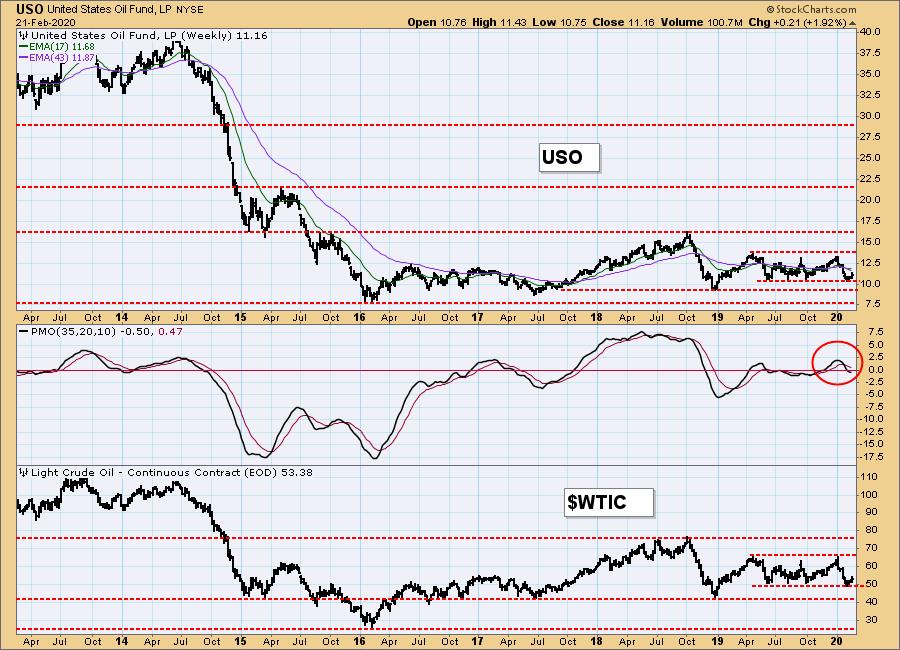
CRUDE OIL (USO)
IT Trend Model: NEUTRAL as of 1/27/2020
LT Trend Model: SELL as of 2/3/2020
USO Daily Chart: USO tried twice to break down through the support line, but a double bottom resulted in a decent rally. Friday's pullback seems more in line with my negative outlook, but for now, it seems headed to the top of the trading range.
USO Weekly Chart: It's a little ragged, but a basing pattern began in 2016. This range could continue for many more years.
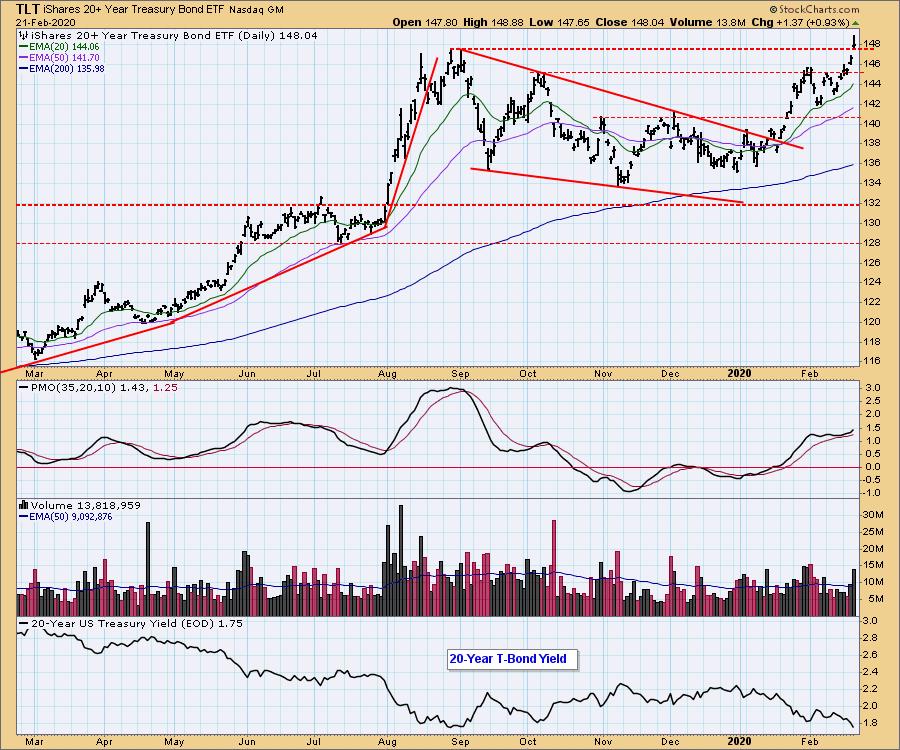
BONDS (TLT)
IT Trend Model: BUY as of 1/22/2020
LT Trend Model: BUY as of 1/2/2019
TLT Daily Chart: Today's price bar would be close to being a shooting star on a candlestick chart, which implies that today's breakout may not hold.
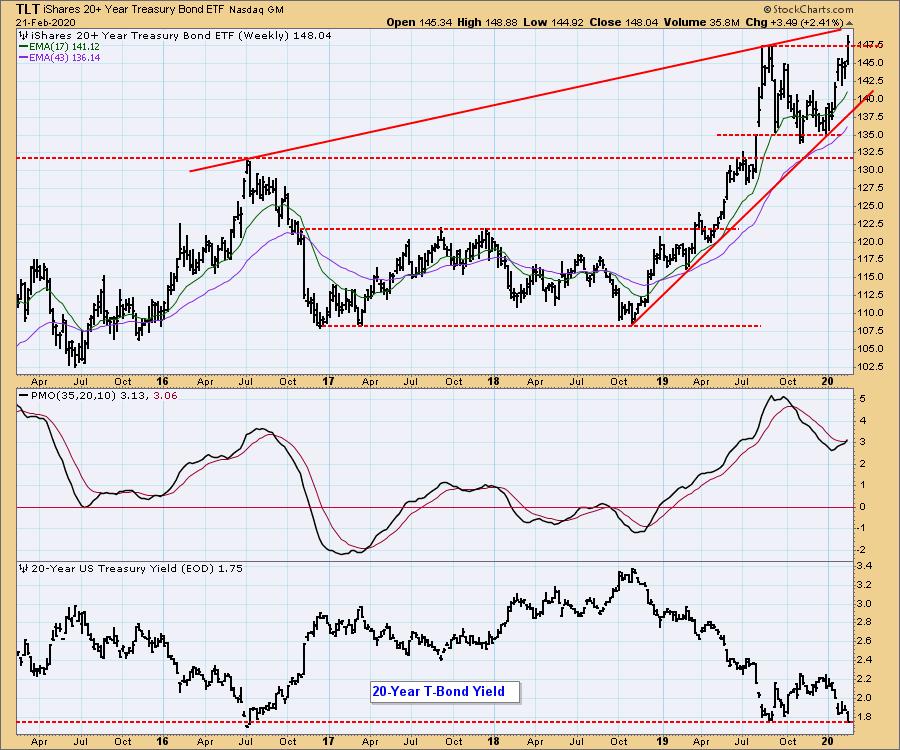
TLT Weekly Chart: The 20-Year Bond Yield is testing long-term support, which could mean the end of the bond rally. But I'm not counting on that.
Technical Analysis is a windsock, not a crystal ball.
Happy Charting! - Carl
NOTE: The signal status reported herein is based upon mechanical trading model signals, specifically, the DecisionPoint Trend Model. They define the implied bias of the price index based upon moving average relationships, but they do not necessarily call for a specific action. They are information flags that should prompt chart review. Further, they do not call for continuous buying or selling during the life of the signal. For example, a BUY signal will probably (but not necessarily) return the best results if action is taken soon after the signal is generated. Additional opportunities for buying may be found as price zigzags higher, but the trader must look for optimum entry points. Conversely, exit points to preserve gains (or minimize losses) may be evident before the model mechanically closes the signal.
Helpful DecisionPoint Links:
DecisionPoint Alert Chart List
DecisionPoint Golden Cross/Silver Cross Index Chart List
DecisionPoint Sector Chart List
Price Momentum Oscillator (PMO)
Swenlin Trading Oscillators (STO-B and STO-V)