
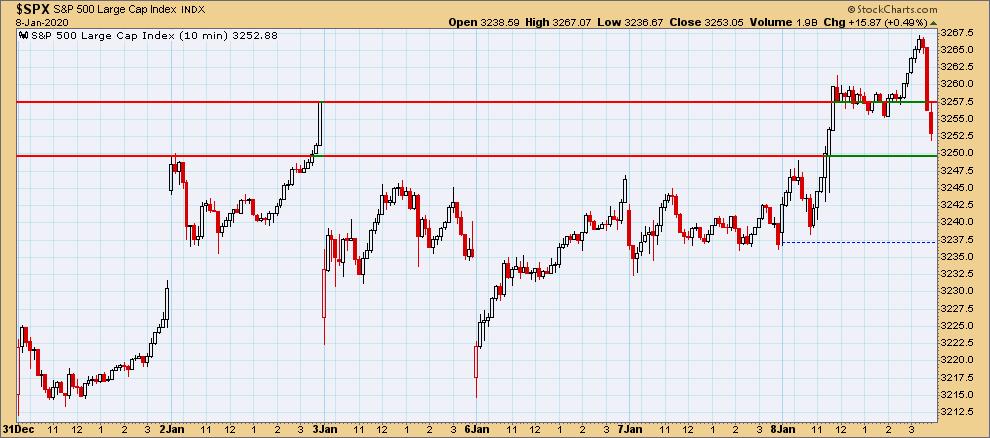
Another trading day where global unrest could've spurred a deep decline in the market, but essentially market participants shrugged it off. What was interesting is that futures were very negative last night, yet today we closed up nearly .5%. Below is the 10-minute bar chart. The last 20 minutes of trading saw a drop off that took almost half of today's gains back, so maybe there are some lingering concerns out there. I analyze charts and not investor motivation or psychology and looking at today's 10-min bar chart, the markets overall did well.
The DecisionPoint Alert Weekly Wrap presents an end-of-week assessment of the trend and condition of the stock market (S&P 500), the U.S. Dollar, Gold, Crude Oil, and Bonds. Monday through Thursday the DecisionPoint Alert daily report is abbreviated and covers changes for the day.
Watch the latest episode of DecisionPoint on StockCharts TV's YouTube channel here!
SECTORS
SIGNALS:
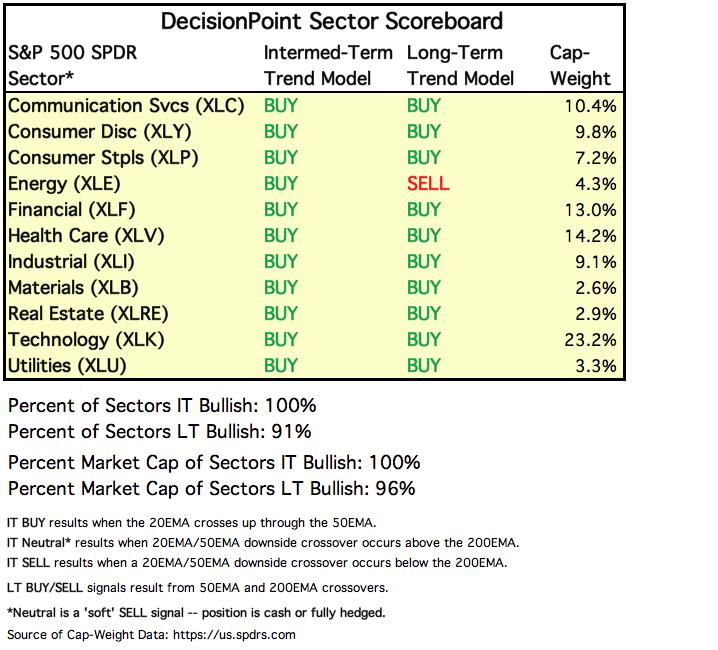
Each S&P 500 Index component stock is assigned to one, and only one, of 11 major sectors. This is a snapshot of the Intermediate-Term (Silver Cross) and Long-Term (Golden Cross) Trend Model signal status for those sectors.
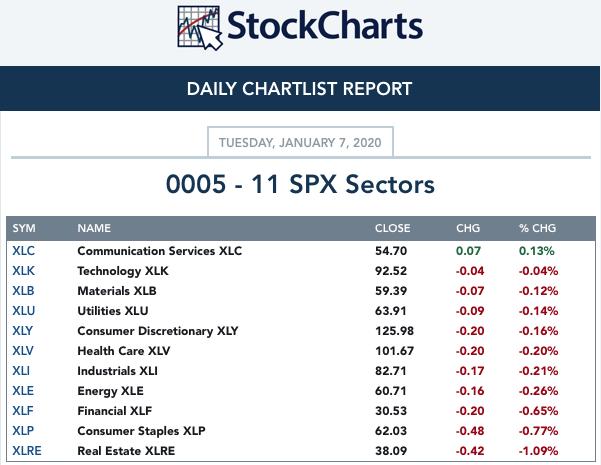
TODAY'S RESULTS:
STOCKS
IT Trend Model: BUY as of 9/6/2019
LT Trend Model: BUY as of 2/26/2019
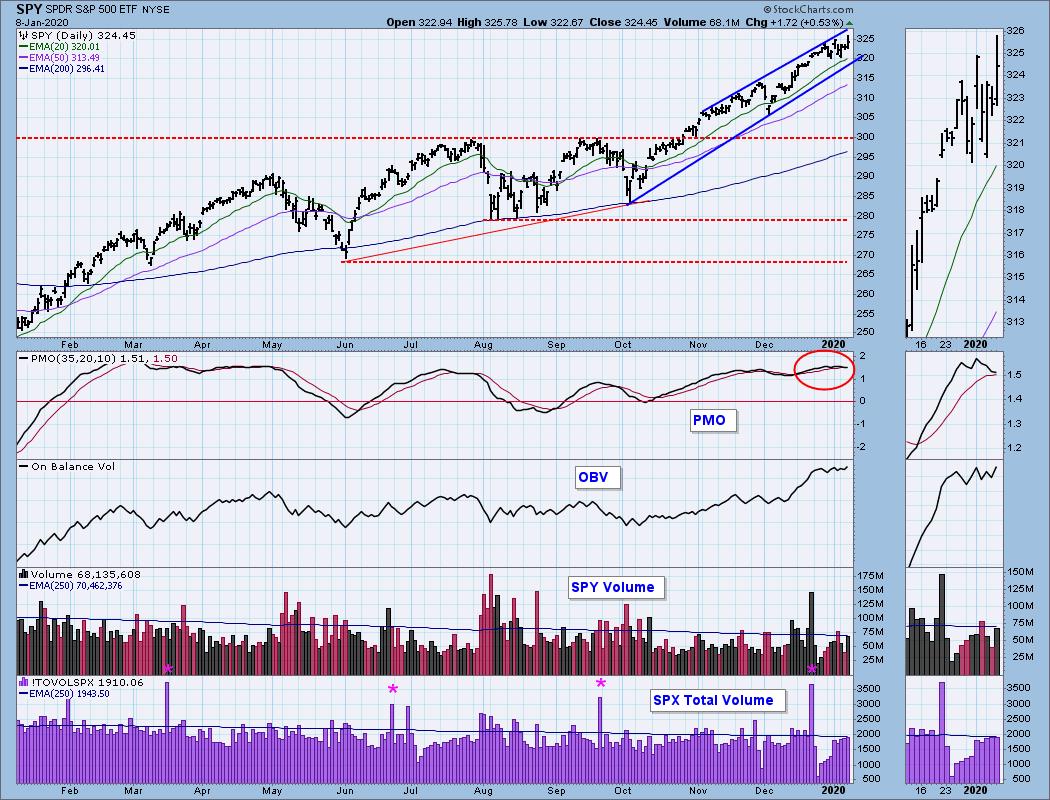
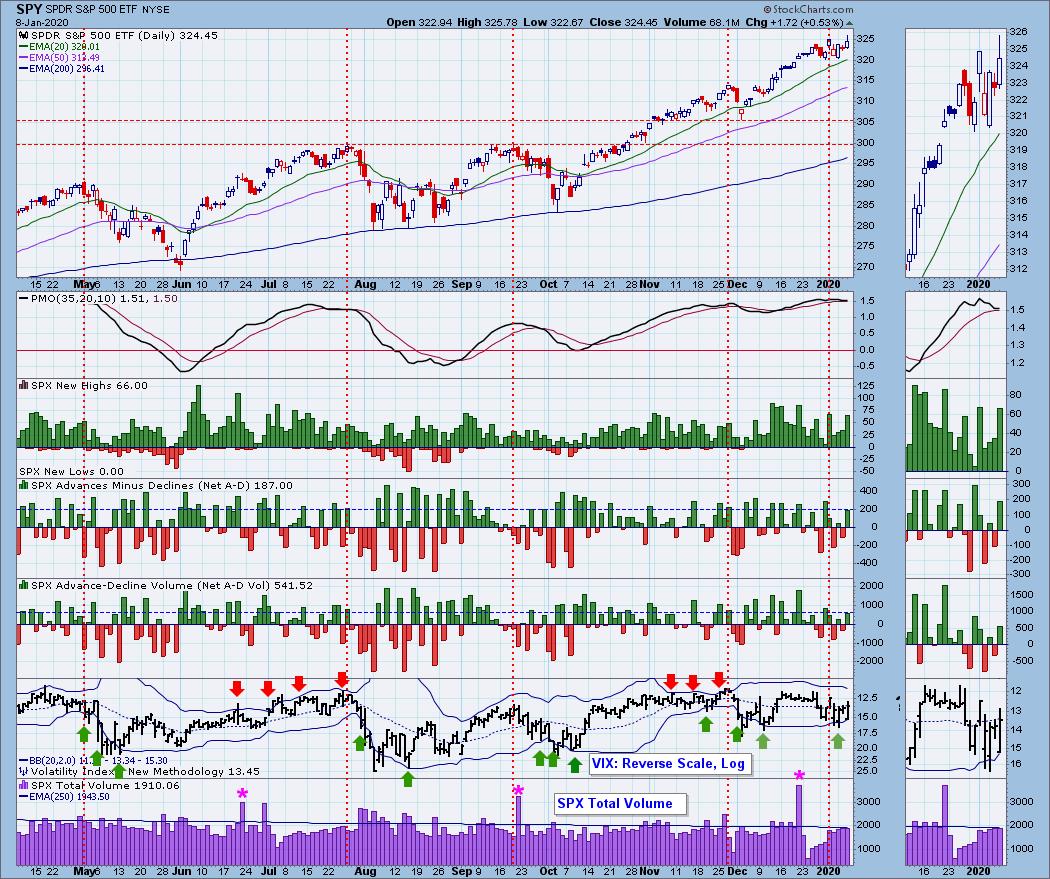
SPY Daily Chart: The bearish rising wedge continues to grow longer. The expectation is a breakdown from the wedge. While I think that is a possibility given the PMO is about to trigger a SELL signal, I'm not quite convinced a pullback here will turn into a full blown correction. The OBV is looking a bit sketchy as it meanders sideways, but those near-term lows are at least rising.
Climactic Market Indicators: Readings weren't climactic on the ultra short-term indicators. I do note that the lower Bollinger Band on the VIX was once again penetrated today (generally bullish). The final reading finished in the center on the moving average, so I could see the market eke out more upside based on sentiment, but the last 20 minutes of trading today leaves me less bullish than I might normally be when the VIX moves below the band.
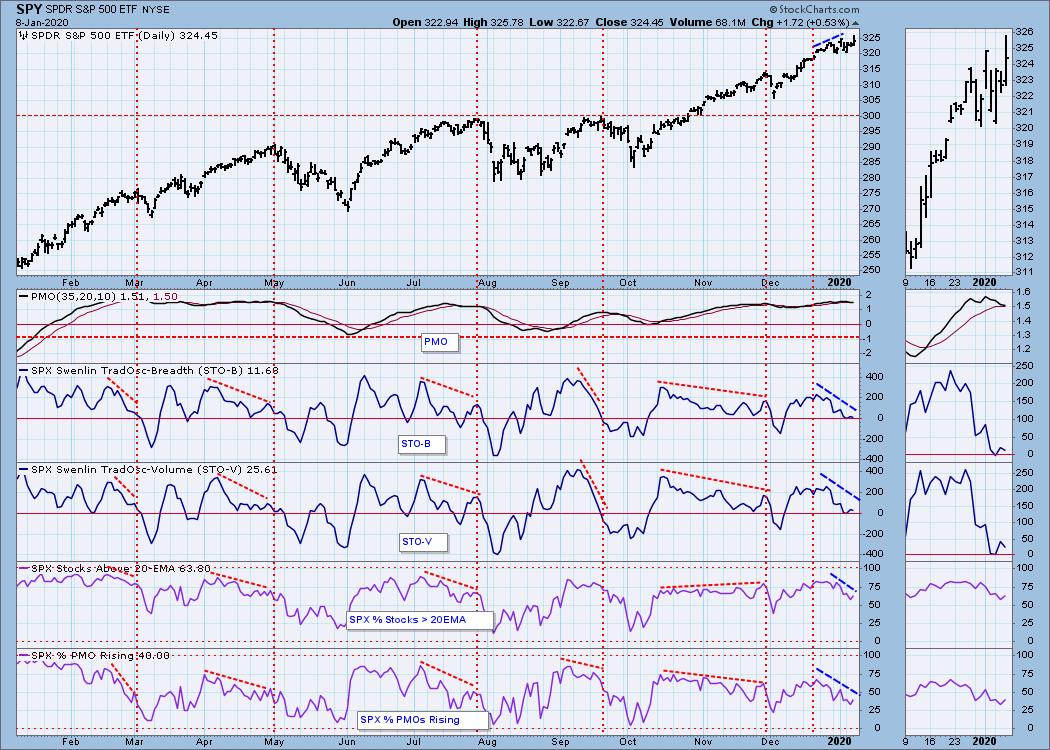
Short-Term Market Indicators: STOs are attempting to stay above the zero line which is positive for the market, but the negative divergences remain. The biggest concern would be the deterioration of the %stocks above their 20/50-EMAs. It isn't easy to sustain a rally when everyone isn't participating. My sense is the larger-cap 'big names' are carrying the SPY and some of its sectors higher despite the continued loss among other components.
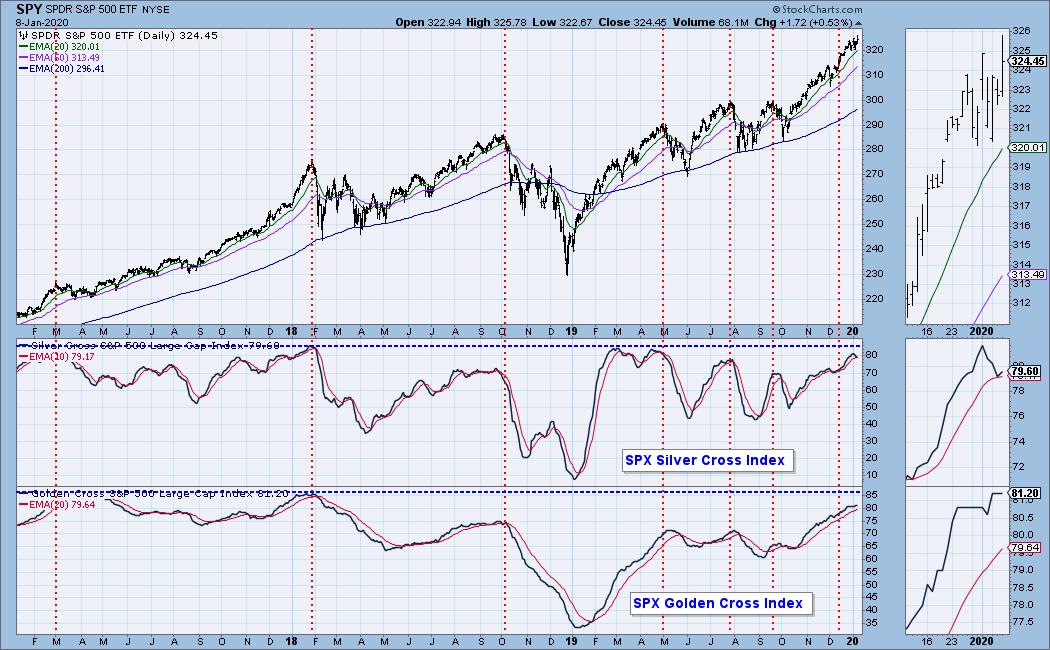
Intermediate-Term Market Indicators: The SCI bounced off its EMA and remains around 80%. So while we are seeing price drop below 20/50-EMAs as demonstrated in the chart above, the 20-EMAs are holding above the 50-EMAs, keeping IT Trend Model BUY signals intact. Knowing that prices are falling below 20/50-EMAs, we should start to see a decline in the SCI.
The ITBM/ITVM are very bearish as they continue their decline lower. The negative divergences remain and Carl pointed out that we are looking at a possible parabolic move over in the markets. Parabolics typically end badly as shown at the beginning of 2019.
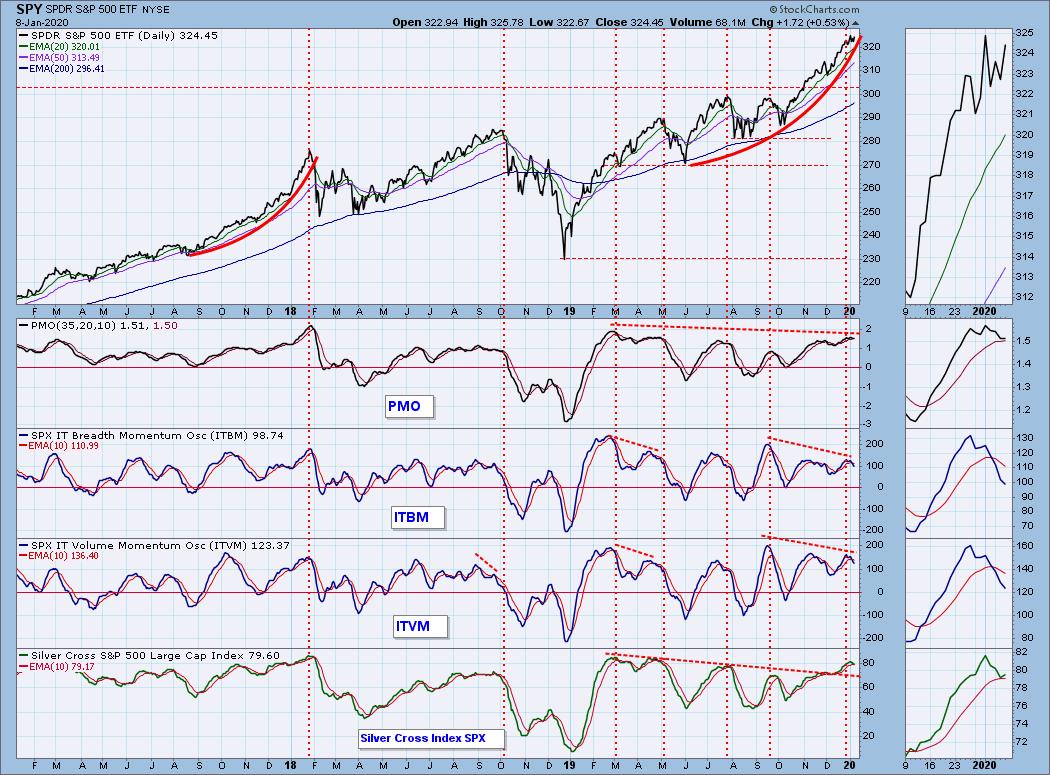
CONCLUSION: The market is overbought and given the bearishness of the majority of our indicators, I would expect this choppy sideways movement to resolve to the downside. However, news doesn't seem to be affecting the market as anticipated. Finishing the day up .49% on the SPY is a good day, but that drop off at the end of the day, matched with bearish indicators tells me to hold off on any new entries.
DOLLAR (UUP)
IT Trend Model: NEUTRAL as of 12/11/2019
LT Trend Model: BUY as of 5/25/2018
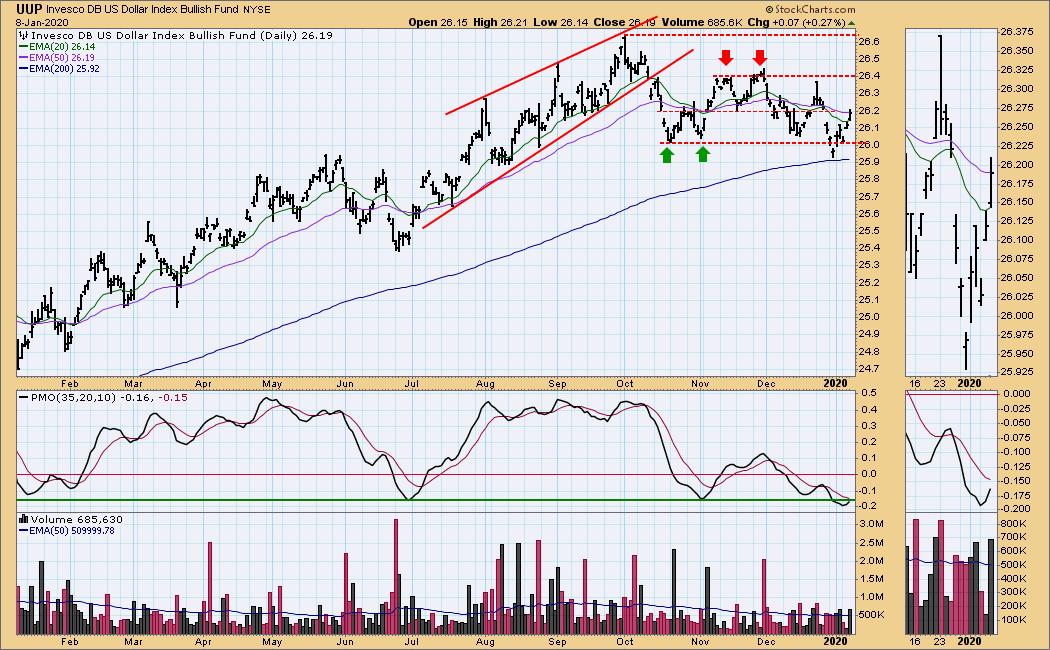
UUP Daily Chart: The Dollar is cooperating with my analysis this week that it should rally to test the top of the short-term trading range at $26.40. The PMO remains very oversold and is nearing a BUY. Price managed to cross above the 20-EMA and closed on the 50-EMA. Last time the PMO whipsawed out of its BUY signal near the end of December as price failed to break out of the trading zone. We could see a repeat.
GOLD
IT Trend Model: BUY as of 12/26/2019
LT Trend Model: BUY as of 1/8/2019
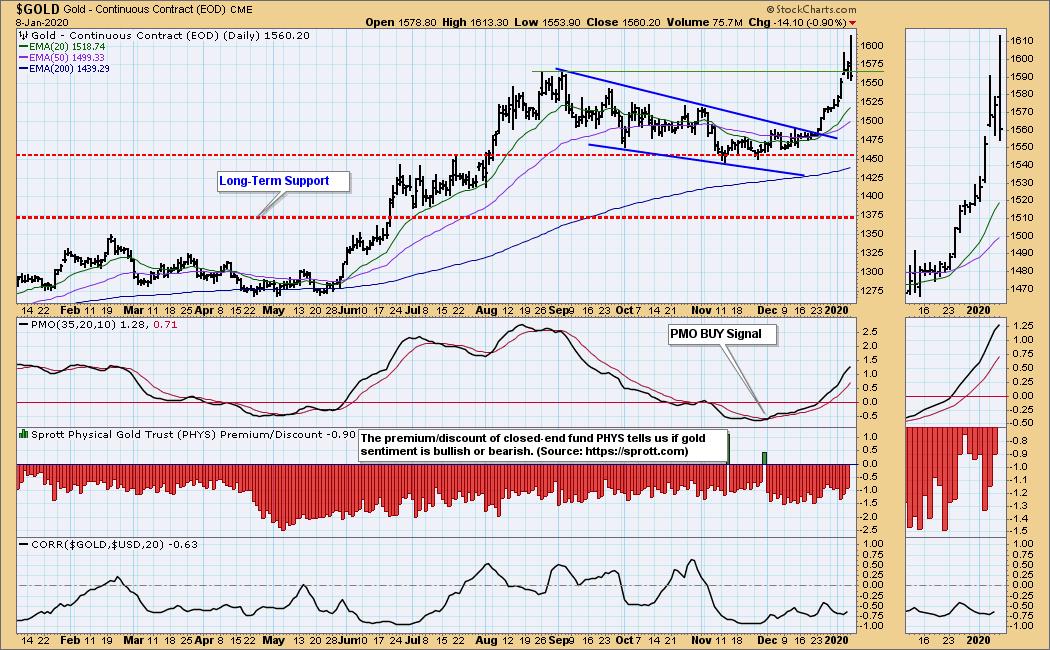
GOLD Daily Chart: Gold set a new intraday high for the year, but pulled back quite a bit, closing below the September top. Gold is due for a pullback and with the Dollar due for a short-term rise.. the time is right. The PMO is still very strong and definitely is not overbought so I expect the rising trend to continue. We just need to see some pullbacks or even sideways consolidation to clear that parabolic price rise and take the short-term rising trend away from vertical.
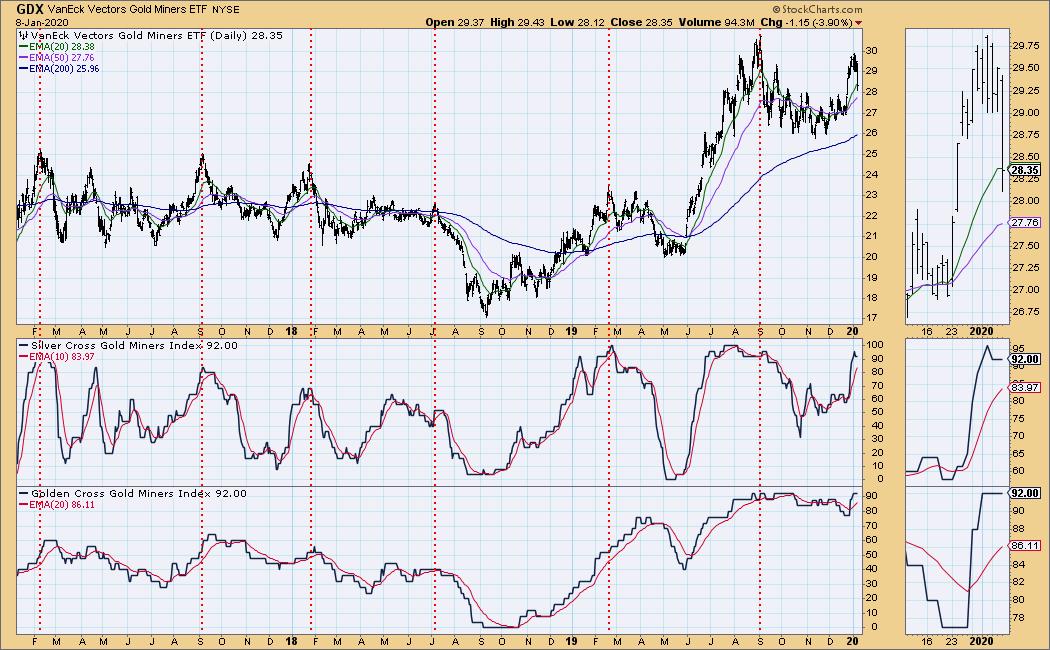
GOLD MINERS Golden and Silver Cross Indexes: Gold Miners suffered with today's drop in Gold as shown on this week's current OLHC bar. A 92% reading on both the SCI and GCI tells you that the group has internal strength. The readings currently are overbought and so the group is still vulnerable.
CRUDE OIL (USO)
IT Trend Model: BUY as of 11/6/2019
LT Trend Model: BUY as of 12/16/2019
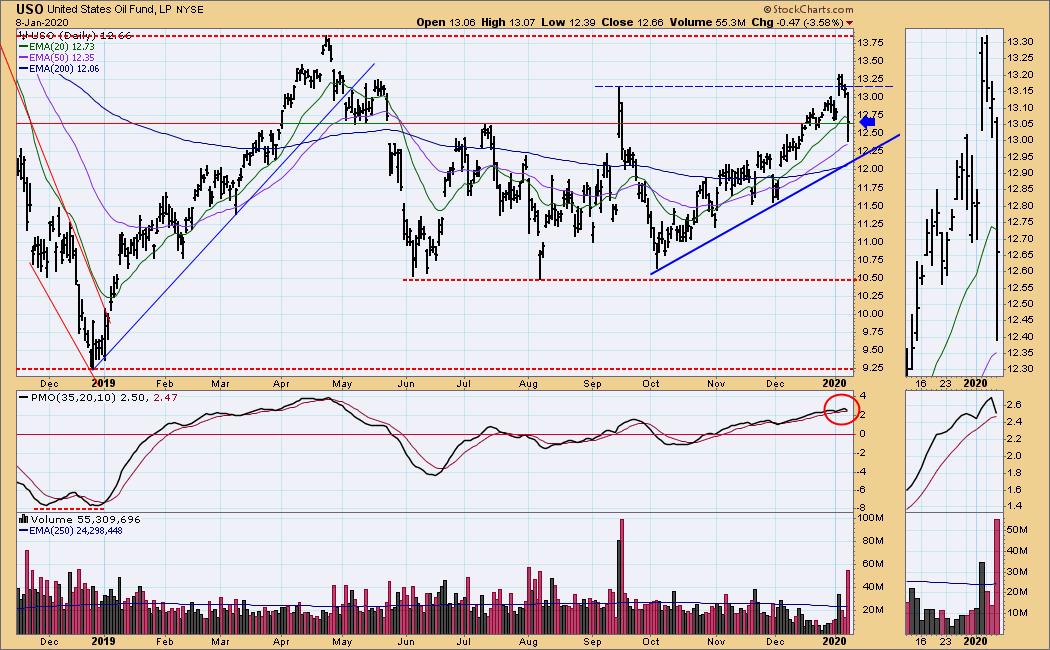
USO Daily Chart: While the general markets seemed unimpressed with the news from Iran, Oil prices did suffer with an over 3.5% drop today. It closed on support at the July high and despite the ugly price bar, the rising trend remains intact. The PMO has topped, but isn't that overbought given the range generally tops out at +4. The PMO has been twitchy for the past month. We could be looking at another twitch.
BONDS (TLT)
IT Trend Model: NEUTRAL as of 12/12/2019
LT Trend Model: BUY as of 1/2/2019
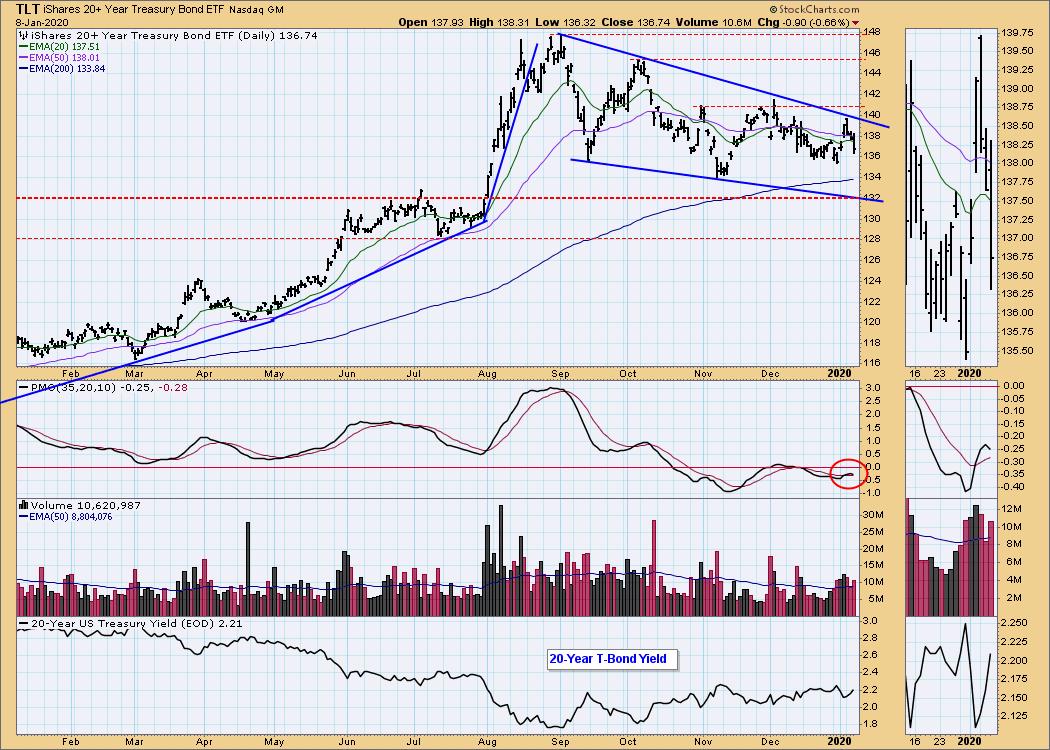
TLT Daily Chart:I had expected to see the bullish falling wedge execute this week. Instead, it banged against the top of the pattern and headed lower. The PMO topped but remains oversold. My sense is that we may need a drop to test the bottom of the pattern since it avoided that last time around. Best case, it'll find support at the $135 level.
**Don't miss any of the DecisionPoint commentaries! Go to the "Notify Me" box toward the end of this blog page to be notified as soon as they are published.**
Technical Analysis is a windsock, not a crystal ball.
Happy Charting! - Erin
Email: erinh@stockcharts.com

Erin Swenlin will be presenting at the The MoneyShow Las Vegas May 11-13, 2020! You'll have an opportunity to meet Erin and discuss the latest DecisionPoint news and Diamond Scans. The conference is free to attend or view online!
NOTE: The signal status reported herein is based upon mechanical trading model signals, specifically, the DecisionPoint Trend Model. They define the implied bias of the price index based upon moving average relationships, but they do not necessarily call for a specific action. They are information flags that should prompt chart review. Further, they do not call for continuous buying or selling during the life of the signal. For example, a BUY signal will probably (but not necessarily) return the best results if action is taken soon after the signal is generated. Additional opportunities for buying may be found as price zigzags higher, but the trader must look for optimum entry points. Conversely, exit points to preserve gains (or minimize losses) may be evident before the model mechanically closes the signal.
Helpful DecisionPoint Links (Can Be Found on DecisionPoint.com Links Page):
DecisionPoint Shared ChartList and DecisionPoint Chart Gallery
Price Momentum Oscillator (PMO)
Swenlin Trading Oscillators (STO-B and STO-V)