
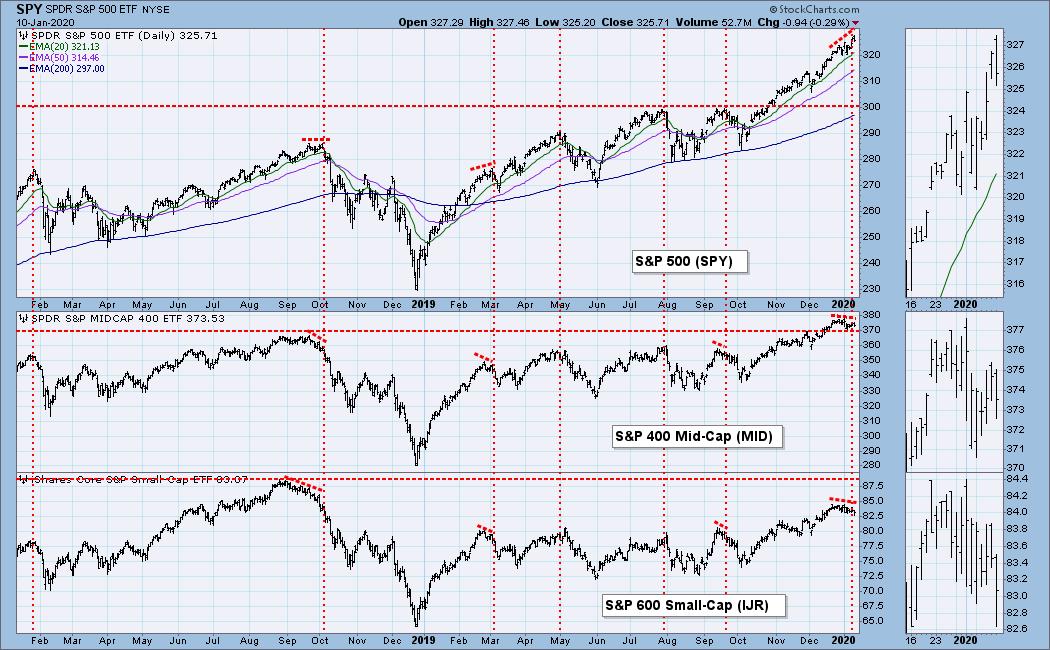
Over the years technical analysts have devised many indicators of varying degrees of complexity, and sometimes simple but effective indicators are overlooked. For example, one of the things that can happen ahead of broad market tops is that participation narrows, and small- and mid-cap indexes roll over as money migrates away from them and into large-cap stocks. When we see this kind of divergence, it is a good bet that the large-cap index is also about to top. On the chart below I have noted examples of this phenomenon, and, coincidentally, one of those times is now. I know this seems simple, but oftentimes simple works. That said, we do like to look deeper, and we will be looking at some of our more complex indicators later in this article.
The DecisionPoint Alert Weekly Wrap presents an end-of-week assessment of the trend and condition of the Stock Market, the U.S. Dollar, Gold, Crude Oil, and Bonds. The DecisionPoint Alert daily report (Monday through Thursday) is abbreviated and gives updates on the Weekly Wrap assessments.
Watch the latest episode of DecisionPoint on StockCharts TV's YouTube channel here!
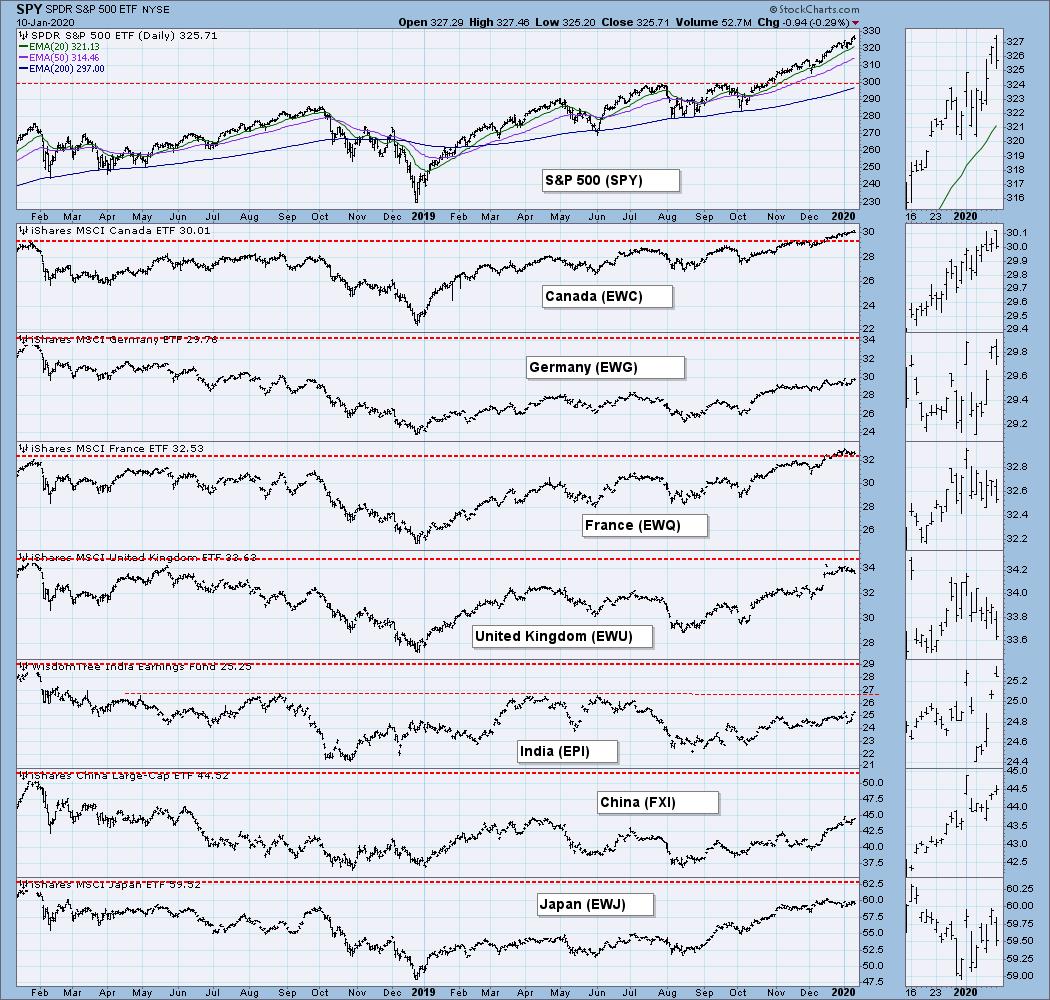
GLOBAL MARKETS
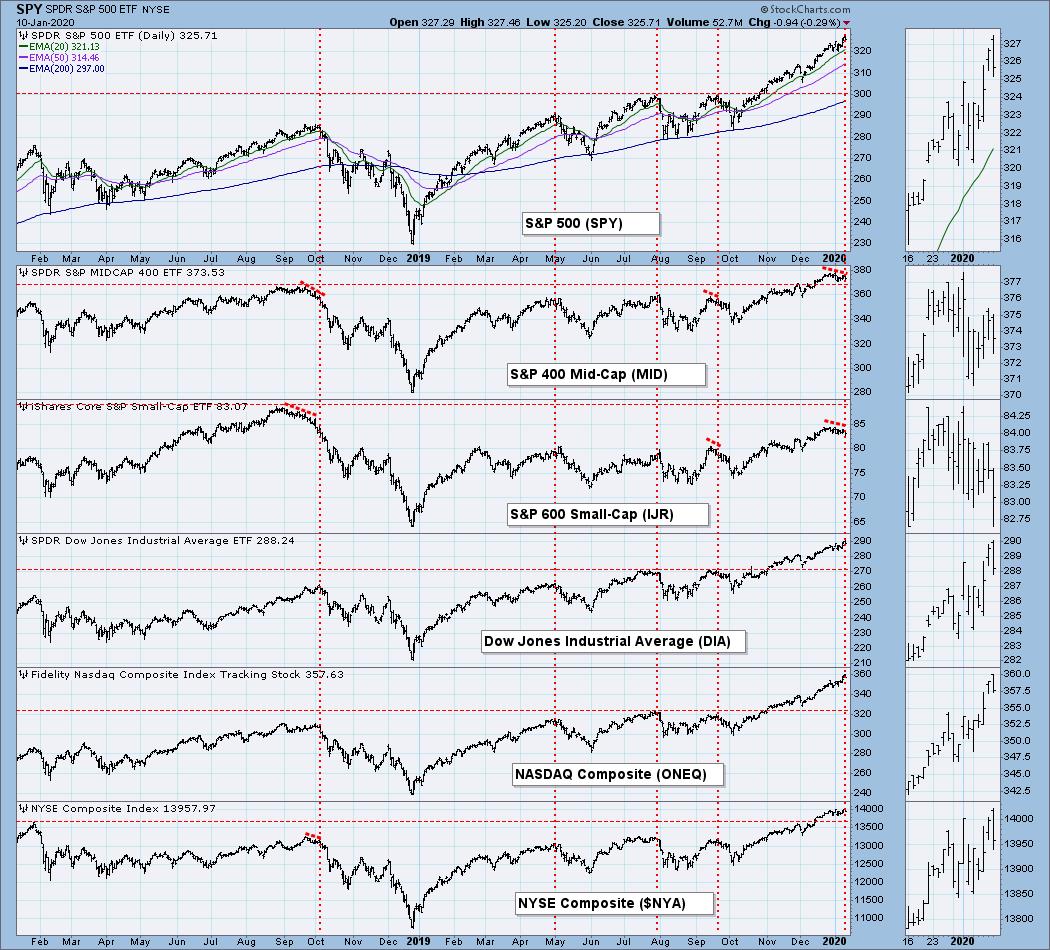
BROAD MARKET INDEXES
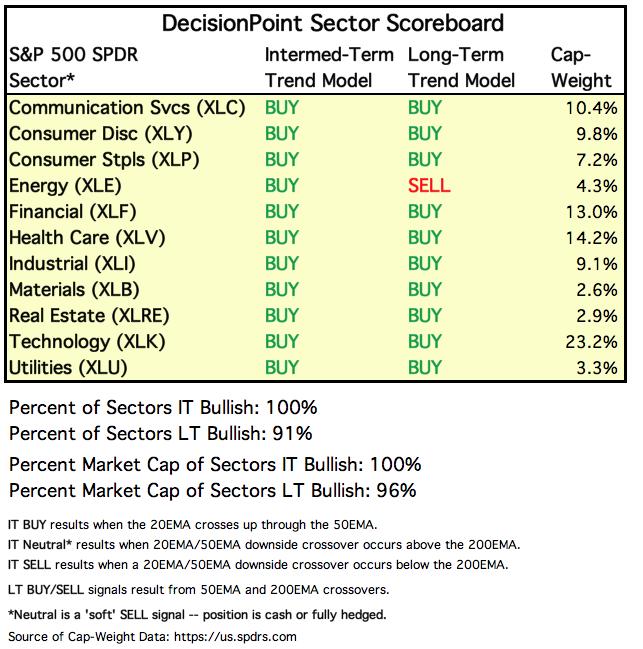
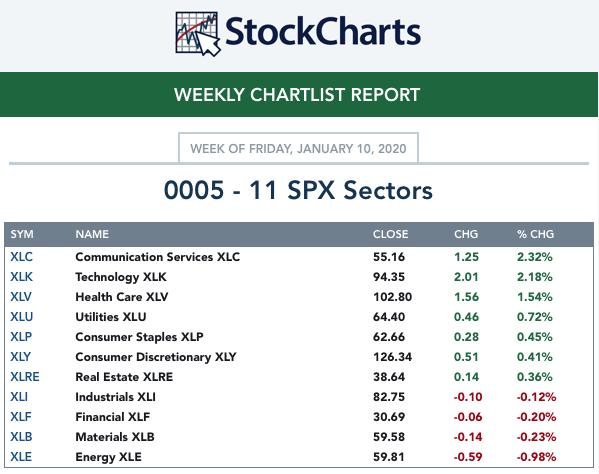
SECTORS
Each S&P 500 Index component stock is assigned to one, and only one, of 11 major sectors. This is a snapshot of the Intermediate-Term (Silver Cross) and Long-Term (Golden Cross) Trend Model signal status for those sectors.
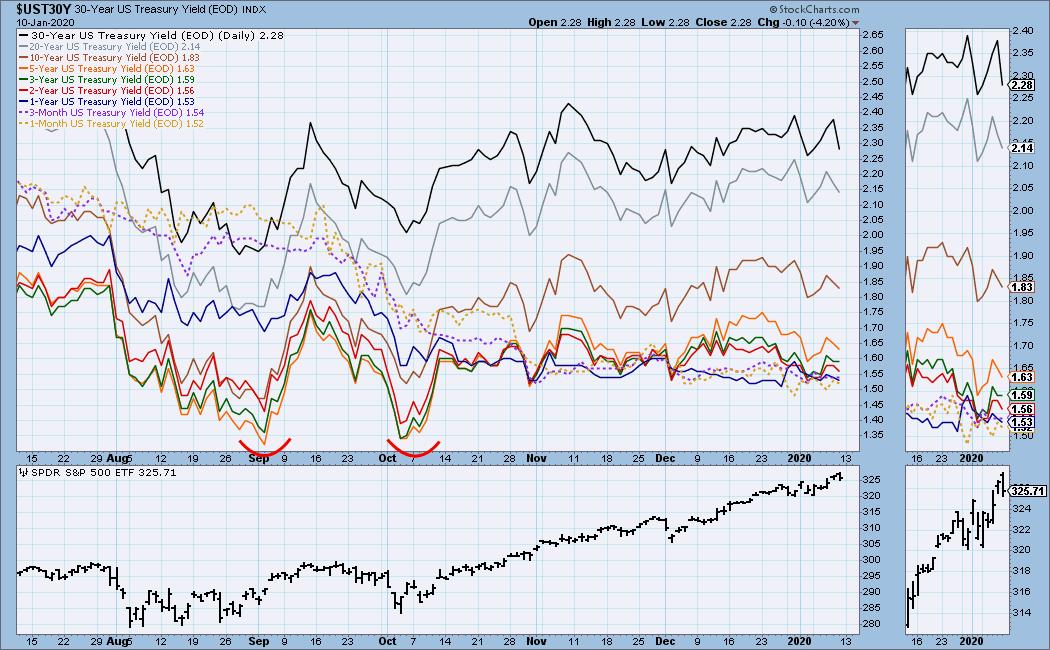
INTEREST RATES
This chart is included so we can monitor rate inversions. In normal circumstances the longer money is borrowed the higher the interest rate that must be paid. When rates are inverted, the reverse is true.
STOCKS
IT Trend Model: BUY as of 9/6/2019
LT Trend Model: BUY as of 2/26/2019
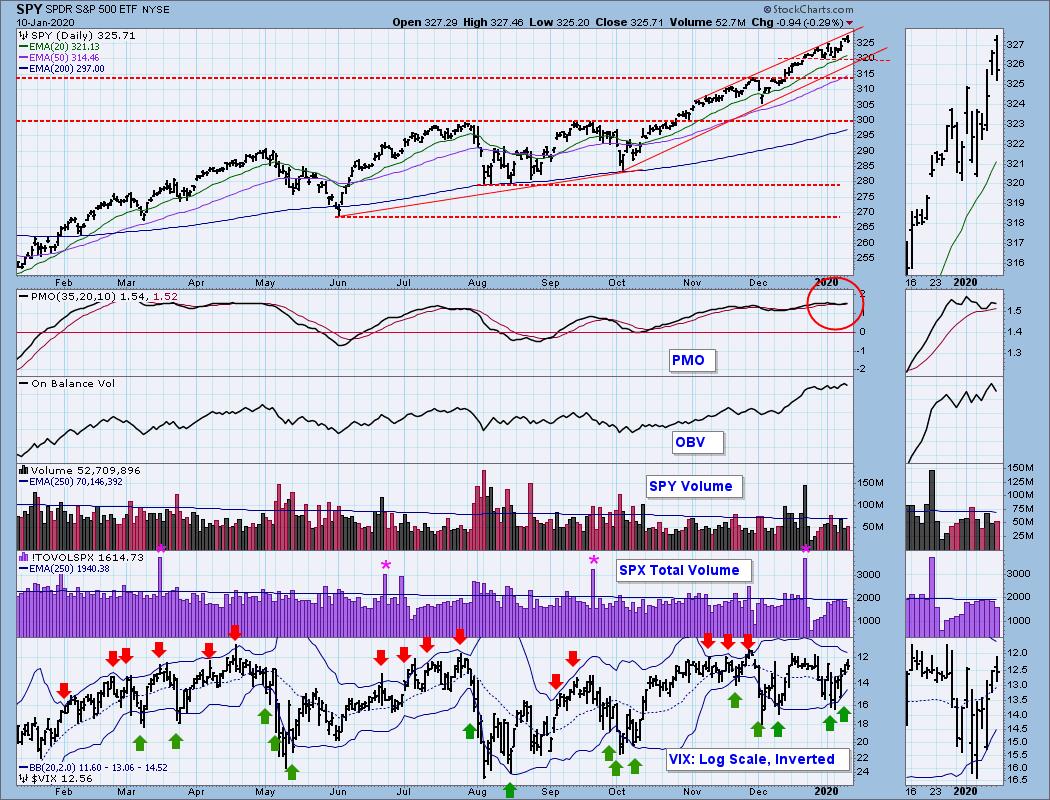
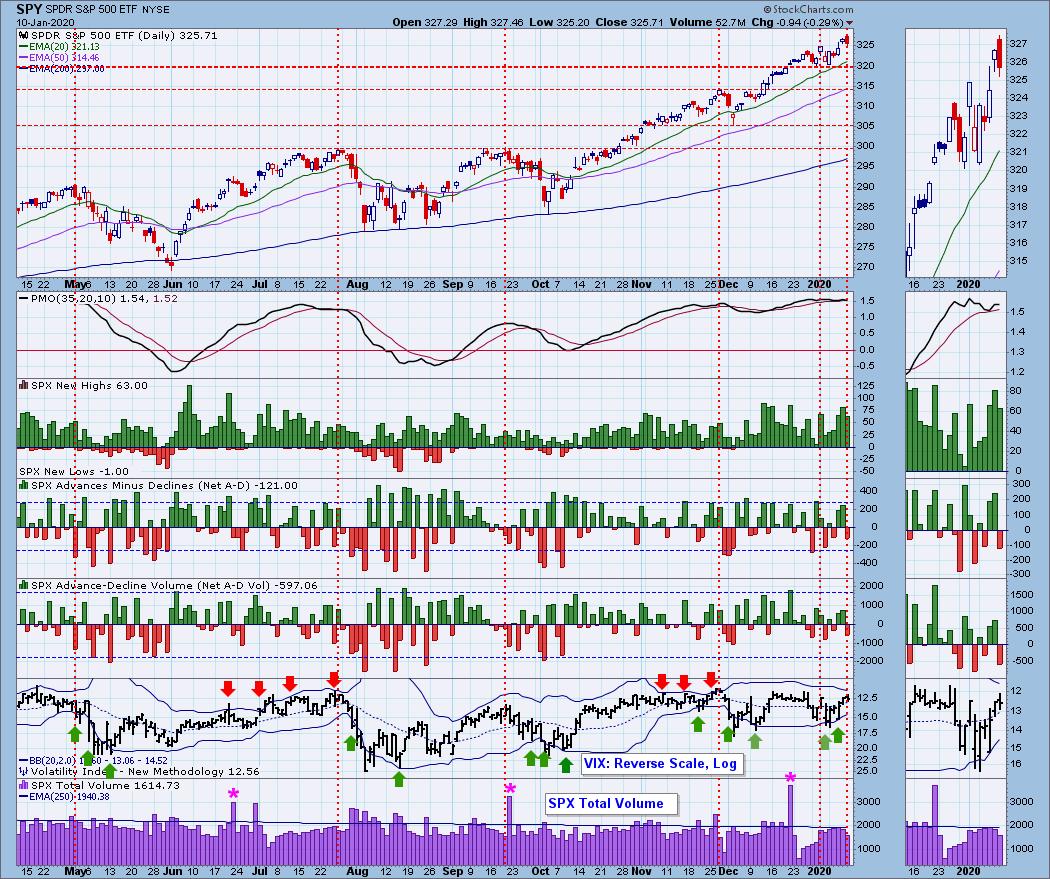
SPY Daily Chart: Price is at the top of the rising trend channel, and the VIX is getting overbought. Note that SPX volume pulled back.
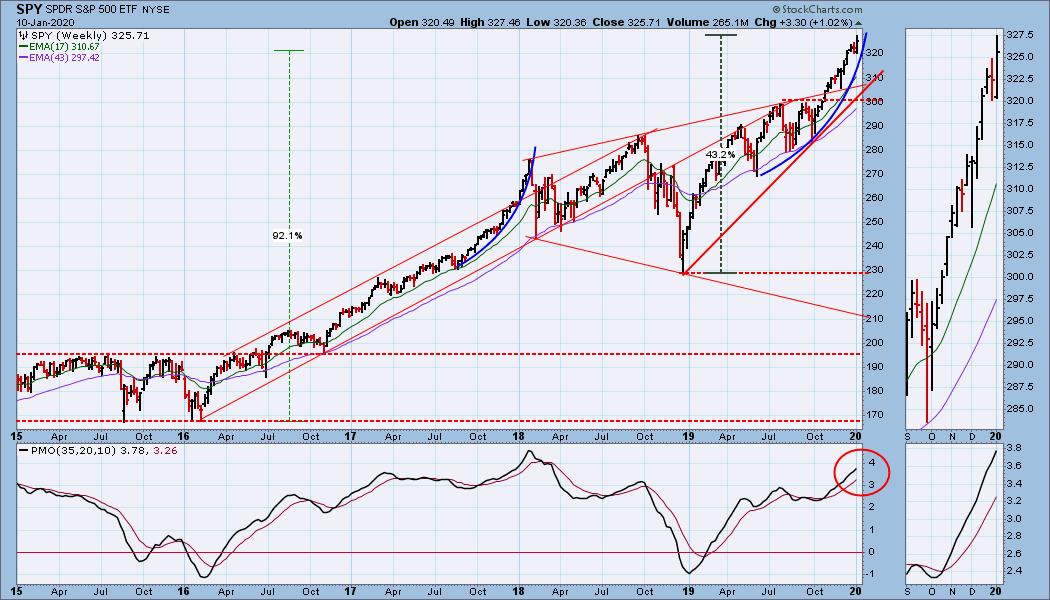
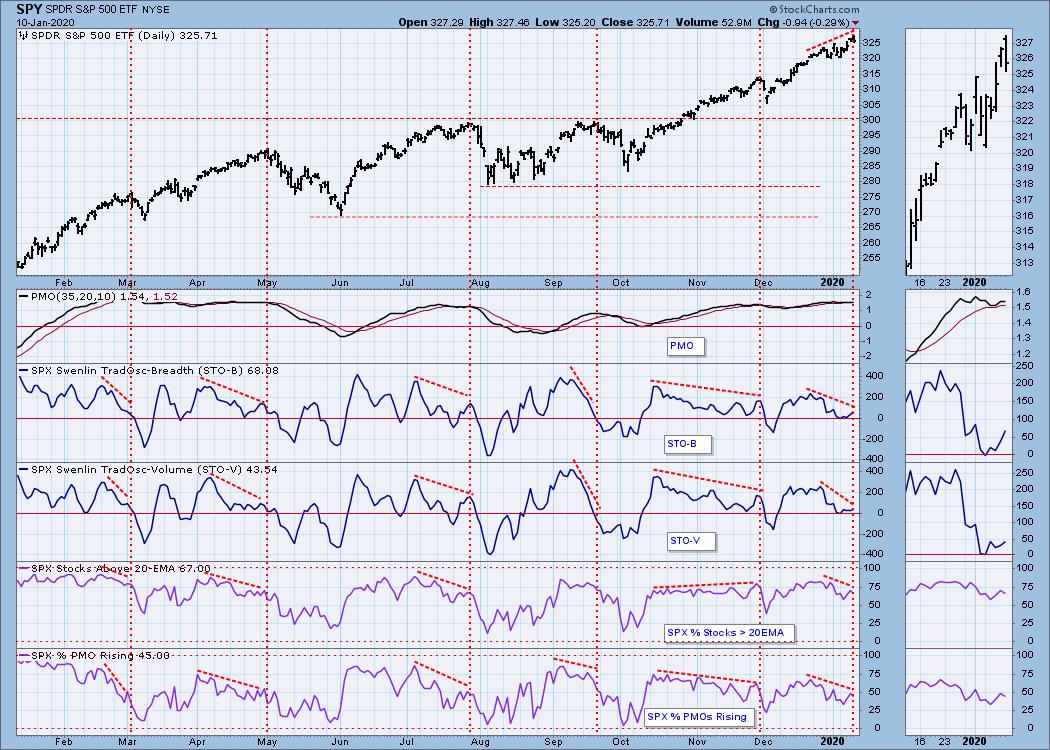
SPY Weekly Chart: This chart is bullish, but the advance is pretty steep.
Climactic Market Indicators: We had somewhat climactic activity this week in New Highs and breadth, and the VIX moved up toward the upper Bollinger Band. Because the price trend is up, I consider climaxes to be of the exhaustion type; however, we haven't seen any real blowoff climaxes in the last two weeks.
Short-Term Market Indicators: In the last two weeks some very sharp negative divergences have on these indicators. Ignore them at your peril.
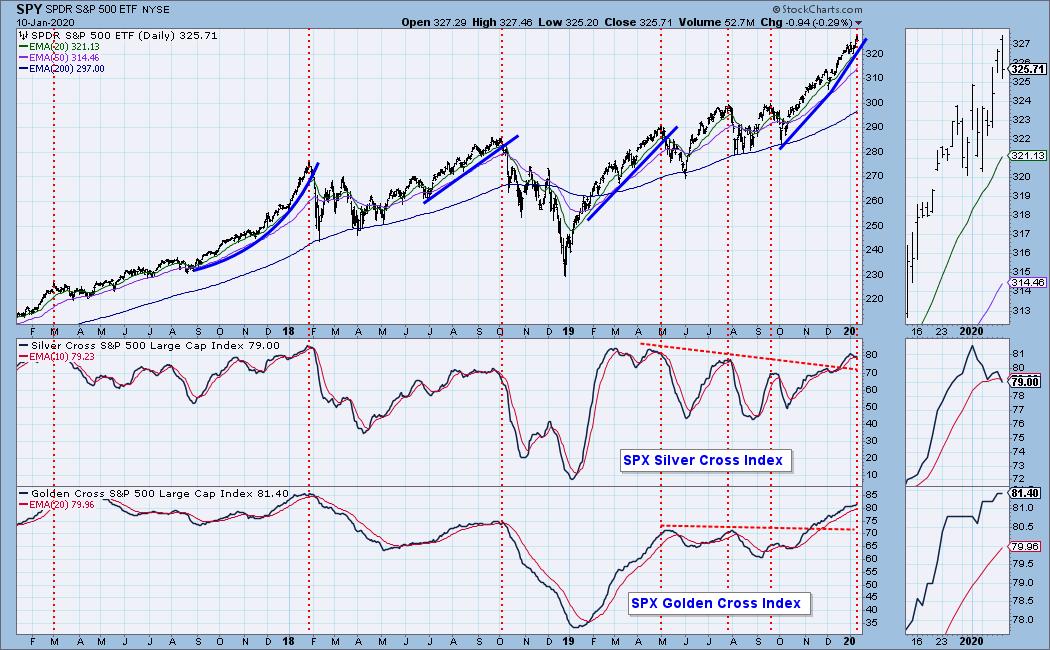
Intermediate-Term Market Indicators: The Golden and Silver Cross Indexes have shown good improvement since the October market low; however, they are both overbought and the Silver Cross Index topping should cause concern.
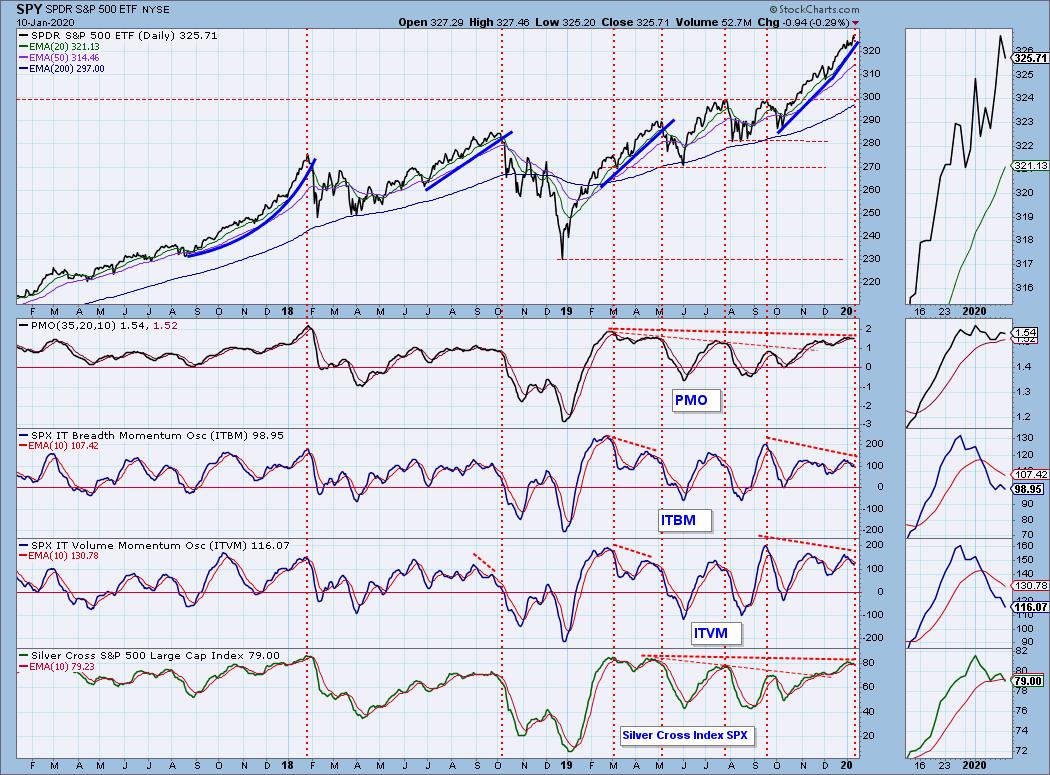
The PMO and Silver Cross Index, both derived from price, are almost at the highs they made in early-2019, and they are about as good as they can get. Poor internals are reflected by the ITBM and ITVM (breadth and volume), which are negatively diverging from their September highs. This combined with the steep angle that price is rising, makes the situation precarious to say the least.
CONCLUSION: The trend is UP and the market condition is OVERBOUGHT. The short- and intermediate-term indicators just above tell me that we're going to get a pullback, and I'm assuming that it began on Friday. We are used to pullbacks so short and shallow, two or three days, some of the talking heads are calling them "buying opportunities." I'm just looking for something more than a two-day "blink your eye and you've missed it" kind of decline. Something at least as we got in May.
A reminder, next week is an options expiration week. It is not end-of-quarter, so I do not expect unusually high volume, but I do expect low volatility toward the end of the week.
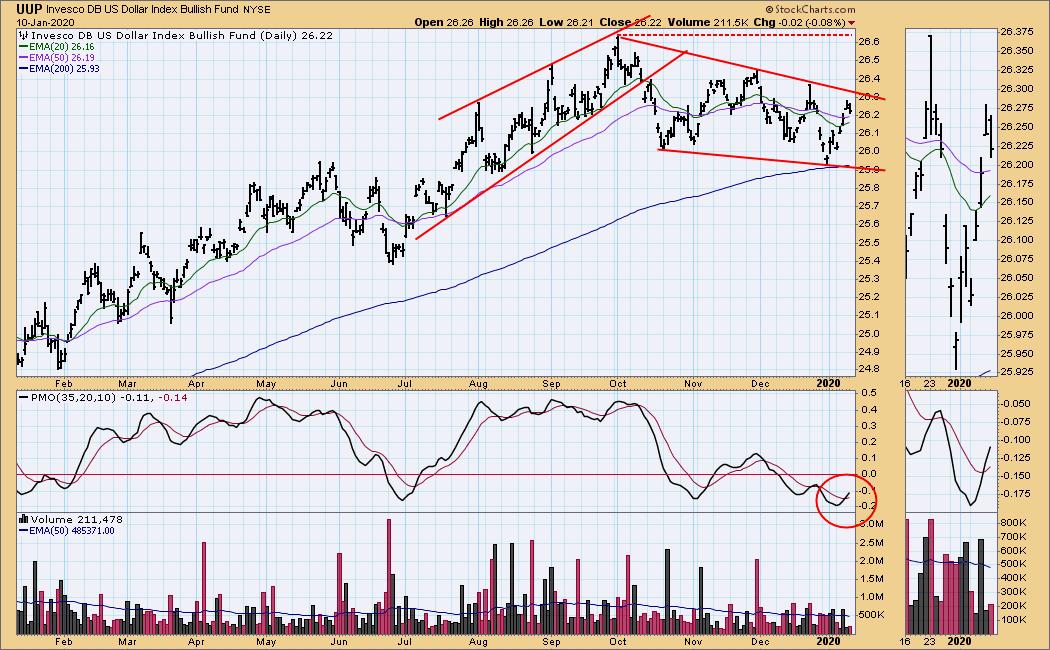
DOLLAR (UUP)
IT Trend Model: NEUTRAL as of 12/11/2019
LT Trend Model: BUY as of 5/25/2018
UUP Daily Chart: The dollar has been edging lower within a falling wedge, a formation that implies an eventual upside resolution.
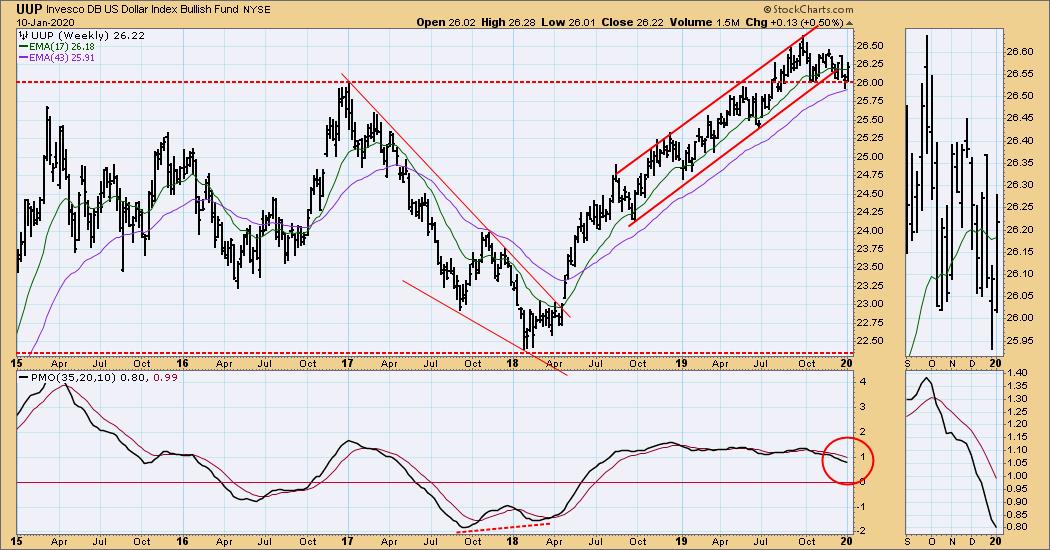
UUP Weekly Chart: Price has moved sideways through a rising trend line, but the horizontal support has held and that is more relevant.
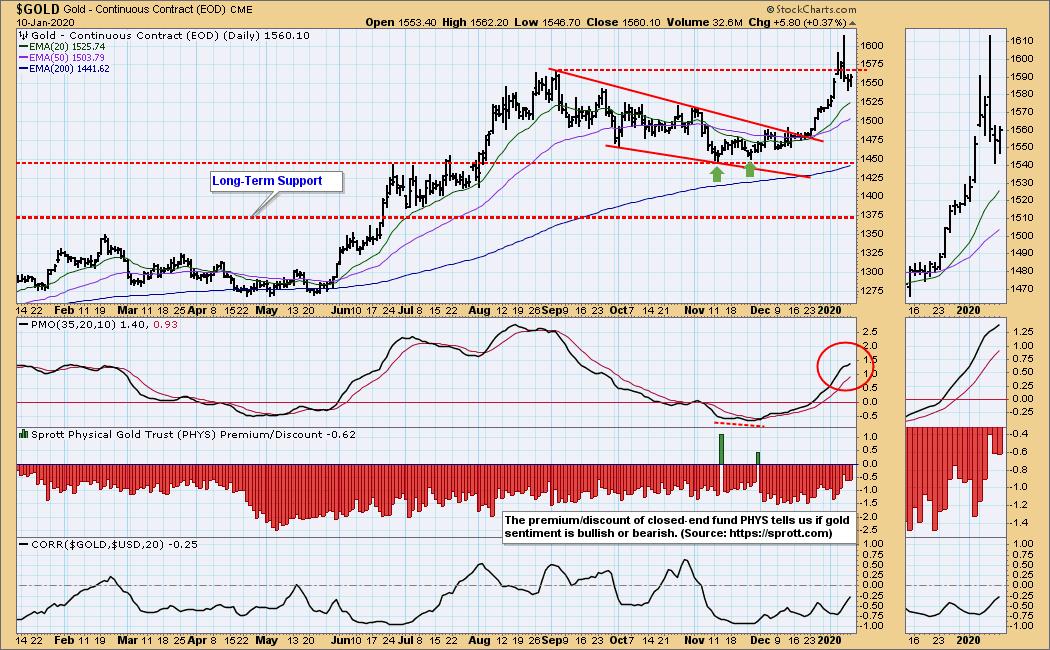
GOLD
IT Trend Model: BUY as of 12/26/2019
LT Trend Model: BUY as of 1/8/2019
GOLD Daily Chart: Gold was already on its way higher when the Iraq airstrike and aftermath hit the news. We saw maximum anxiety on Wednesday, resulting in a wide swing, but volatility has eased, and the advance may continue. Note that the line of resistance drawn across September's high still remains an obstacle. A move to 1617 would be a decisive breakout.
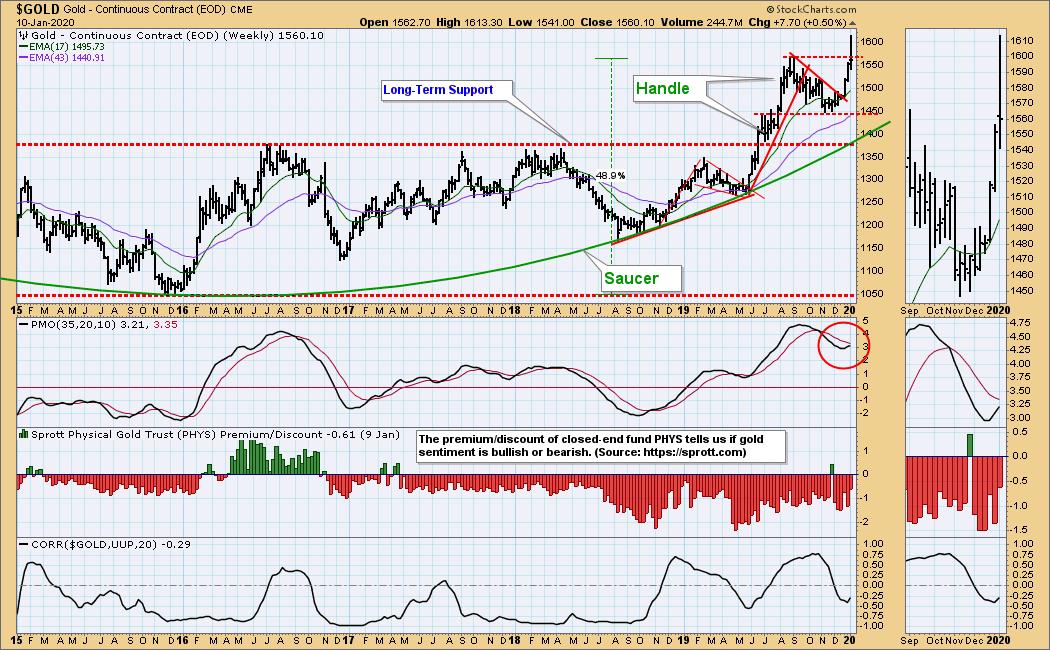
GOLD Weekly Chart: The weekly PMO is rising, so gold looks positive in this time frame.
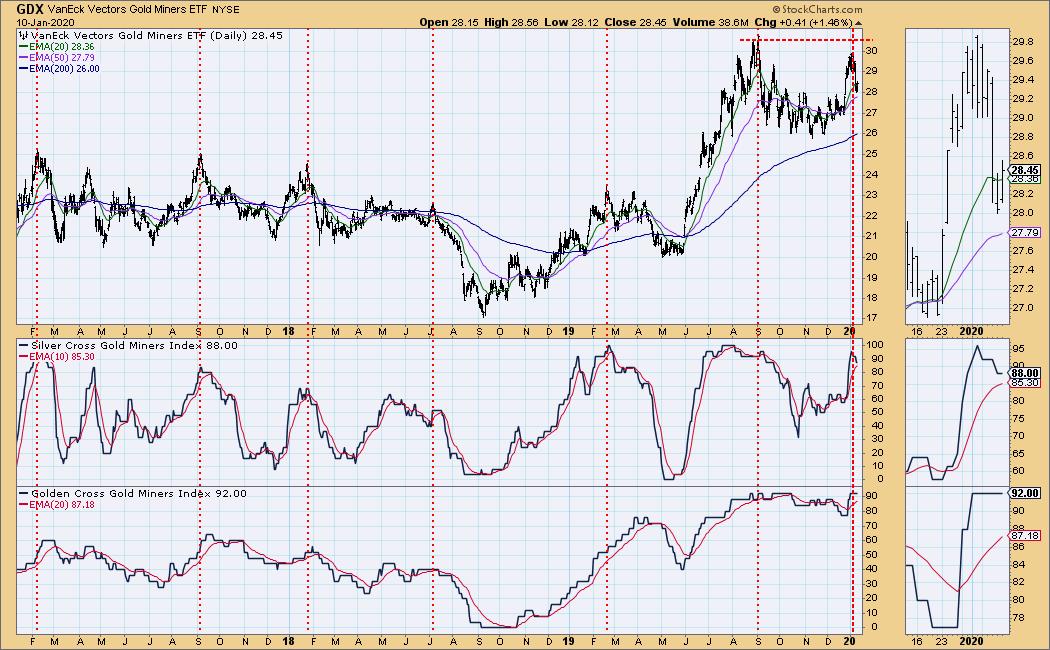
GOLD MINERS Golden and Silver Cross Indexes: Both of these indexes are near the top of their fixed range (0-100), and we note that the Silver Cross Index doesn't spend much time at extremes. Price is pulling back, but it may just be consolidating 2019's gains.
CRUDE OIL (USO)
IT Trend Model: BUY as of 11/6/2019
LT Trend Model: BUY as of 12/16/2019
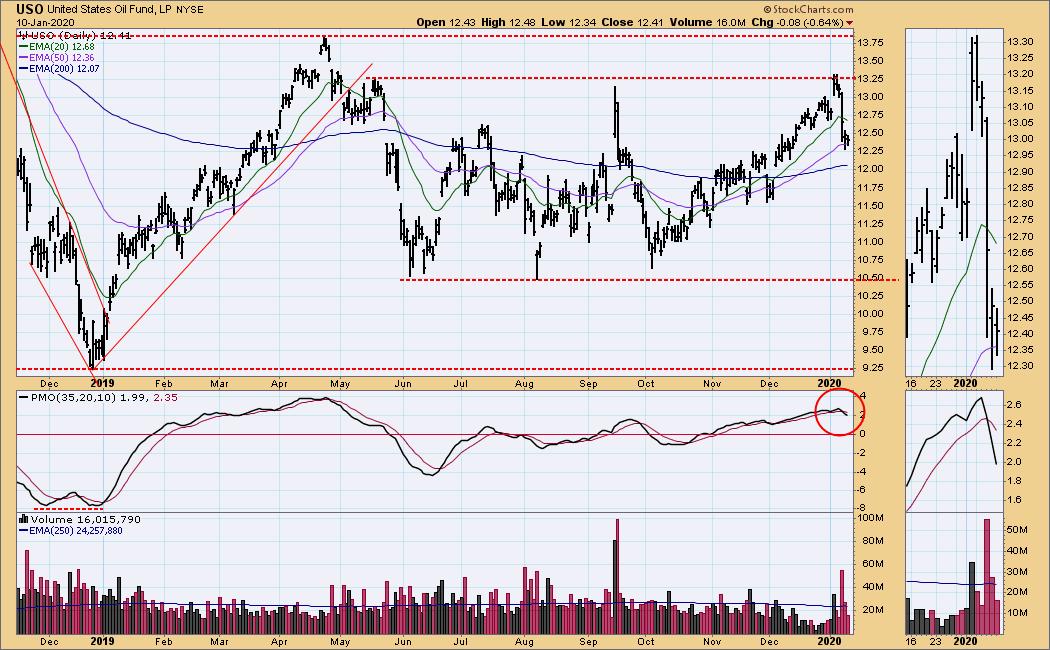
USO Daily Chart: Crude had edged higher on the airstrike news, but it fell back as the situation normalized. It is looking as if the top of the trading range will hold.
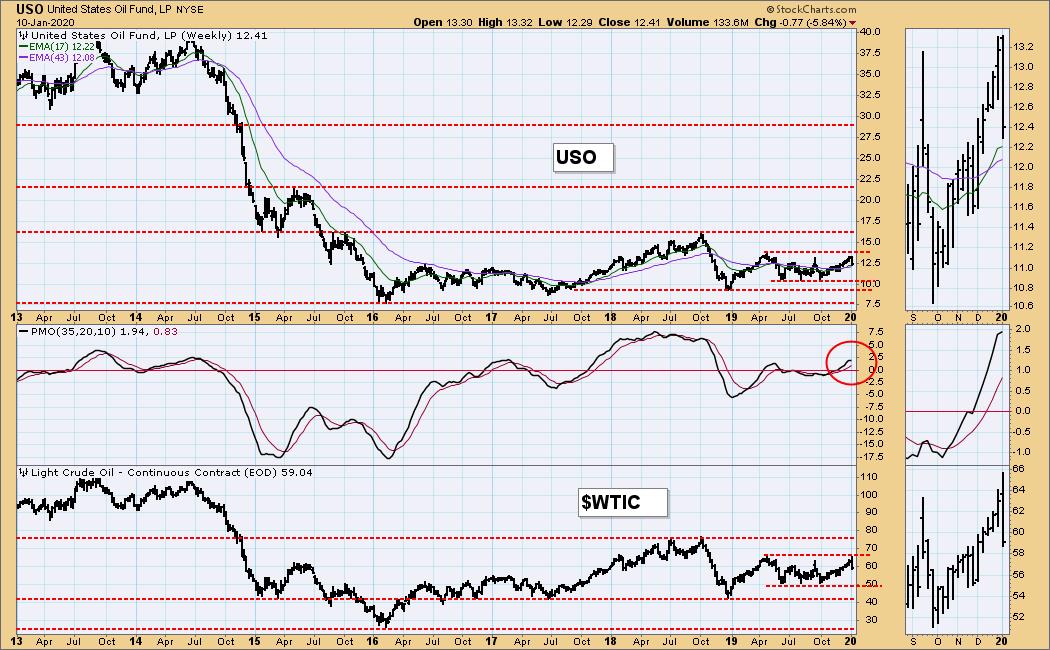
USO Weekly Chart: Crude is in a basing pattern (between 42 and 76) that may last several more years. Obviously, things can change in a heartbeat, but the range has been durable through some fairly unstable situations.
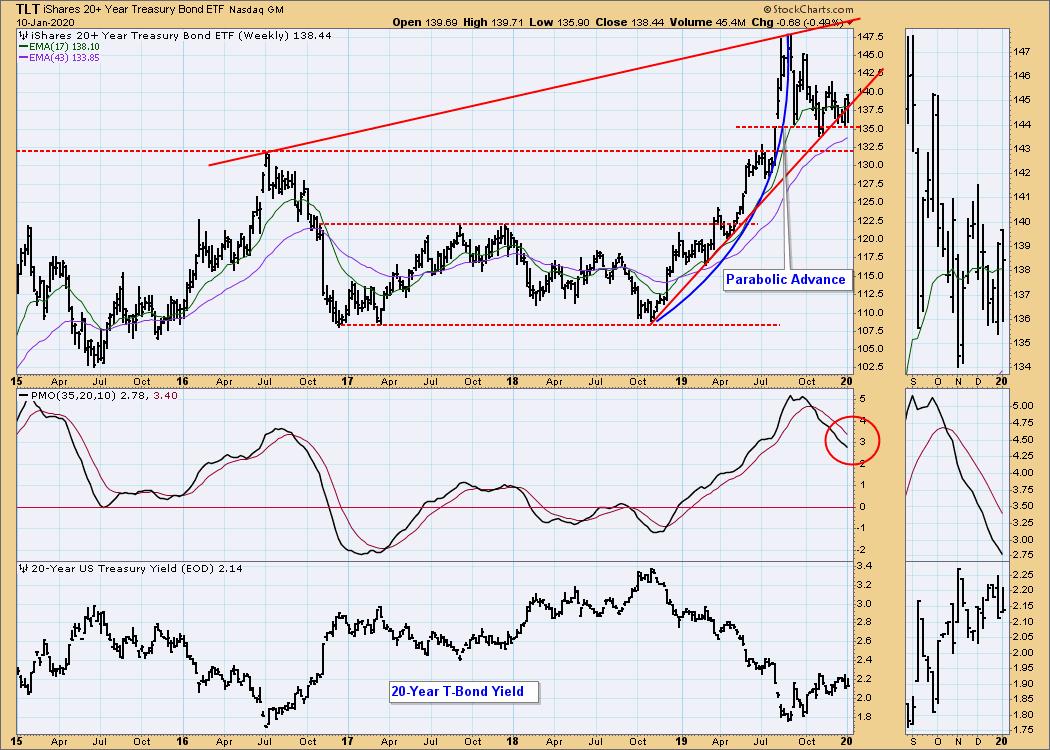
BONDS (TLT)
IT Trend Model: NEUTRAL as of 12/12/2019
LT Trend Model: BUY as of 1/2/2019
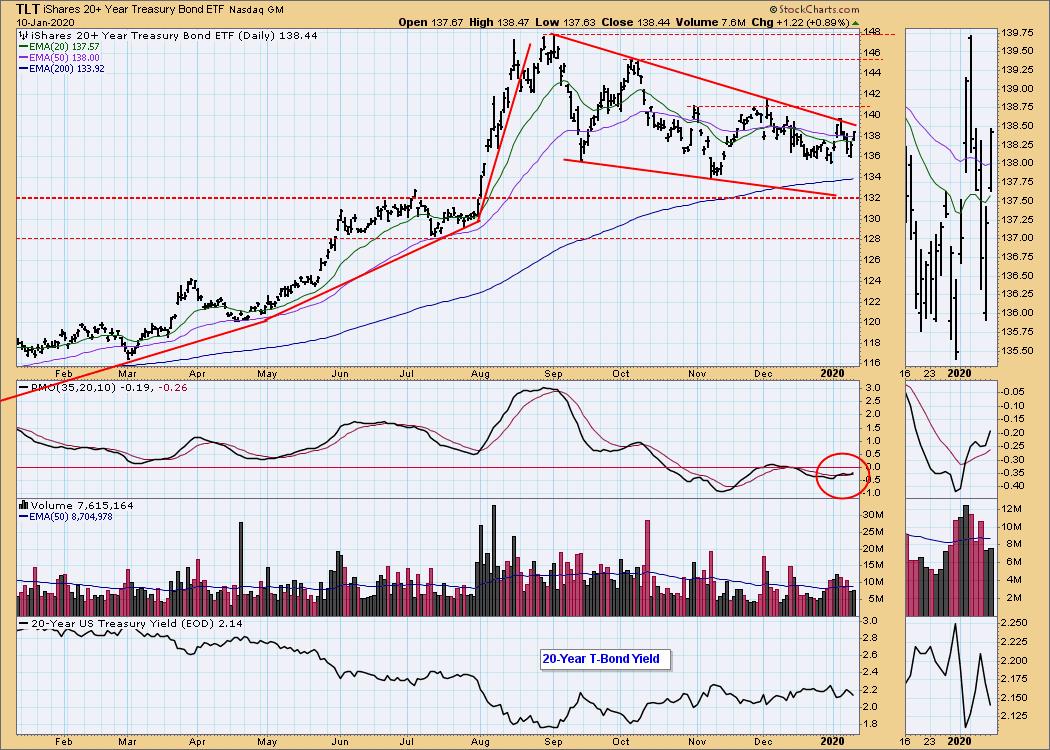
TLT Daily Chart: It appears that the falling wedge formation will be resolving upward (as technically expected) within a few weeks or sooner.
TLT Weekly Chart: A parabolic advance pulled price too far away from a rising trend line. When the parabolic broke, price returned to a less accelerated angle of ascent.
**Don't miss any of the DecisionPoint commentaries! Go to the "Notify Me" box toward the end of this blog page to be notified as soon as they are published.**
Technical Analysis is a windsock, not a crystal ball.
Happy Charting! - Carl
NOTE: The signal status reported herein is based upon mechanical trading model signals, specifically, the DecisionPoint Trend Model. They define the implied bias of the price index based upon moving average relationships, but they do not necessarily call for a specific action. They are information flags that should prompt chart review. Further, they do not call for continuous buying or selling during the life of the signal. For example, a BUY signal will probably (but not necessarily) return the best results if action is taken soon after the signal is generated. Additional opportunities for buying may be found as price zigzags higher, but the trader must look for optimum entry points. Conversely, exit points to preserve gains (or minimize losses) may be evident before the model mechanically closes the signal.
Helpful DecisionPoint Links:
DecisionPoint Alert Chart List
DecisionPoint Golden Cross/Silver Cross Index Chart List
DecisionPoint Sector Chart List
Price Momentum Oscillator (PMO)
Swenlin Trading Oscillators (STO-B and STO-V)