Everything you see on StockCharts is designed with one goal in mind: to help you succeed in the markets.
Our charting and analysis tools, portfolio management resources, and comprehensive data coverage deliver a complete package that can be uniquely tailored to fit any approach. That's why millions of investors around the globe have made StockCharts their trusted financial analysis platform for more than two decades.
From simple candlesticks to advanced technical visualizations, our award-winning charting tools help you see the markets clearly. Compare symbols over multiple timeframes, choose from dozens of powerful indicators, and customize your charts to suit your personal trading or investing style.
Whether you're looking for stocks making new highs or searching for complex setups that combine multiple technical indicators, our advanced market scanning tools give you the power find promising new trade targets or investment opportunities faster than ever before.
Stay ahead of the markets and on top of your portfolio with custom, automatic alerts for all of the symbols you're following. From simple price alerts to advanced combinations of specific technical and fundamental criteria, our custom alert features will help make sure you never miss a thing.
And that's just the tip of the iceberg. Our rich feature set provides comprehensive coverage for every step of your investing journey, from trading tools like Scheduled Scans to portfolio management resources like ChartList Reports.
Explore More Features
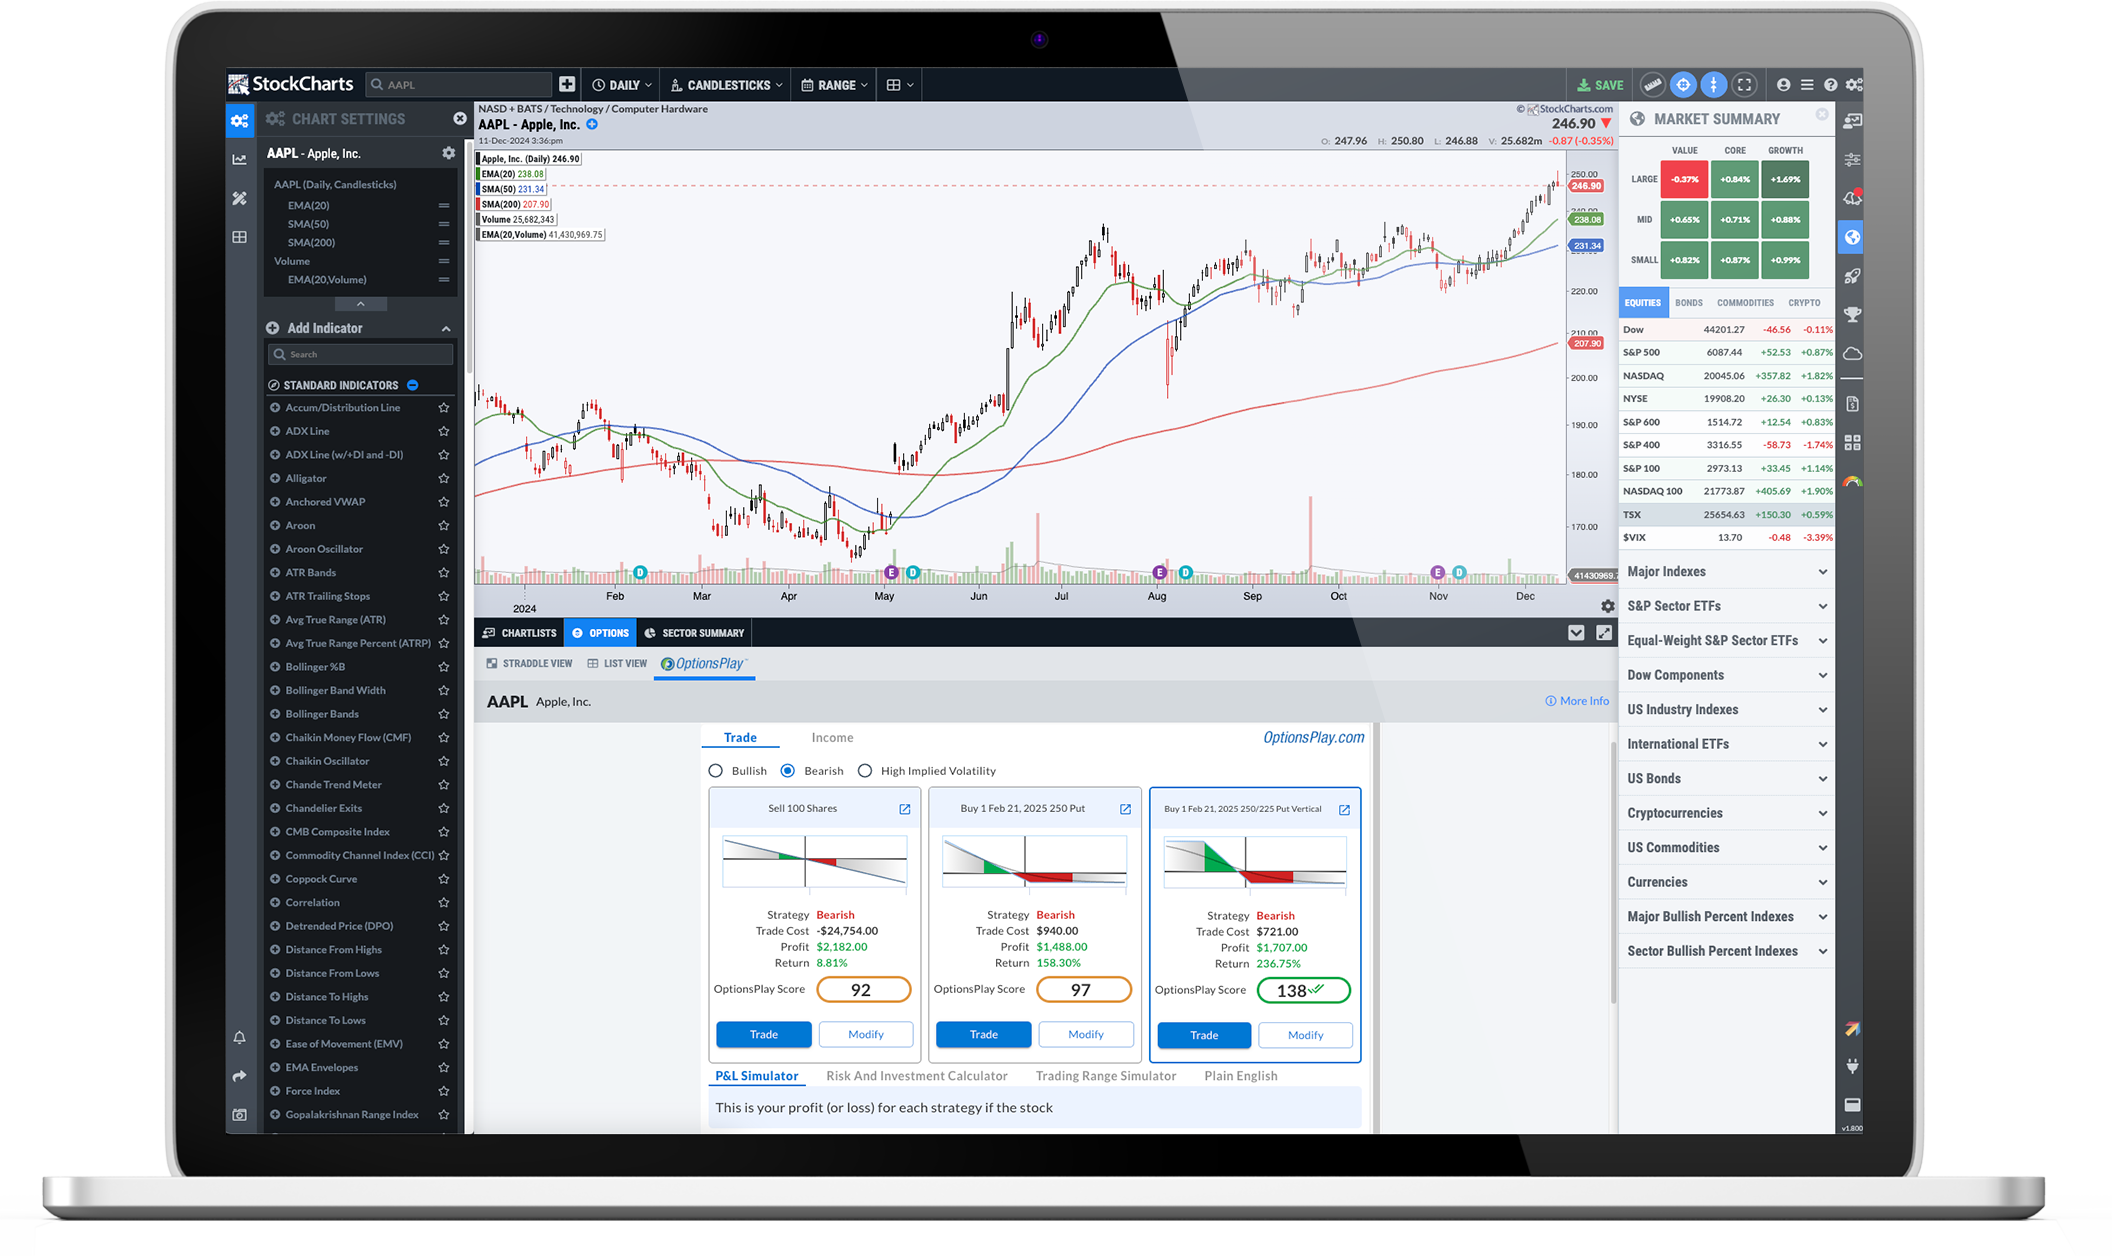
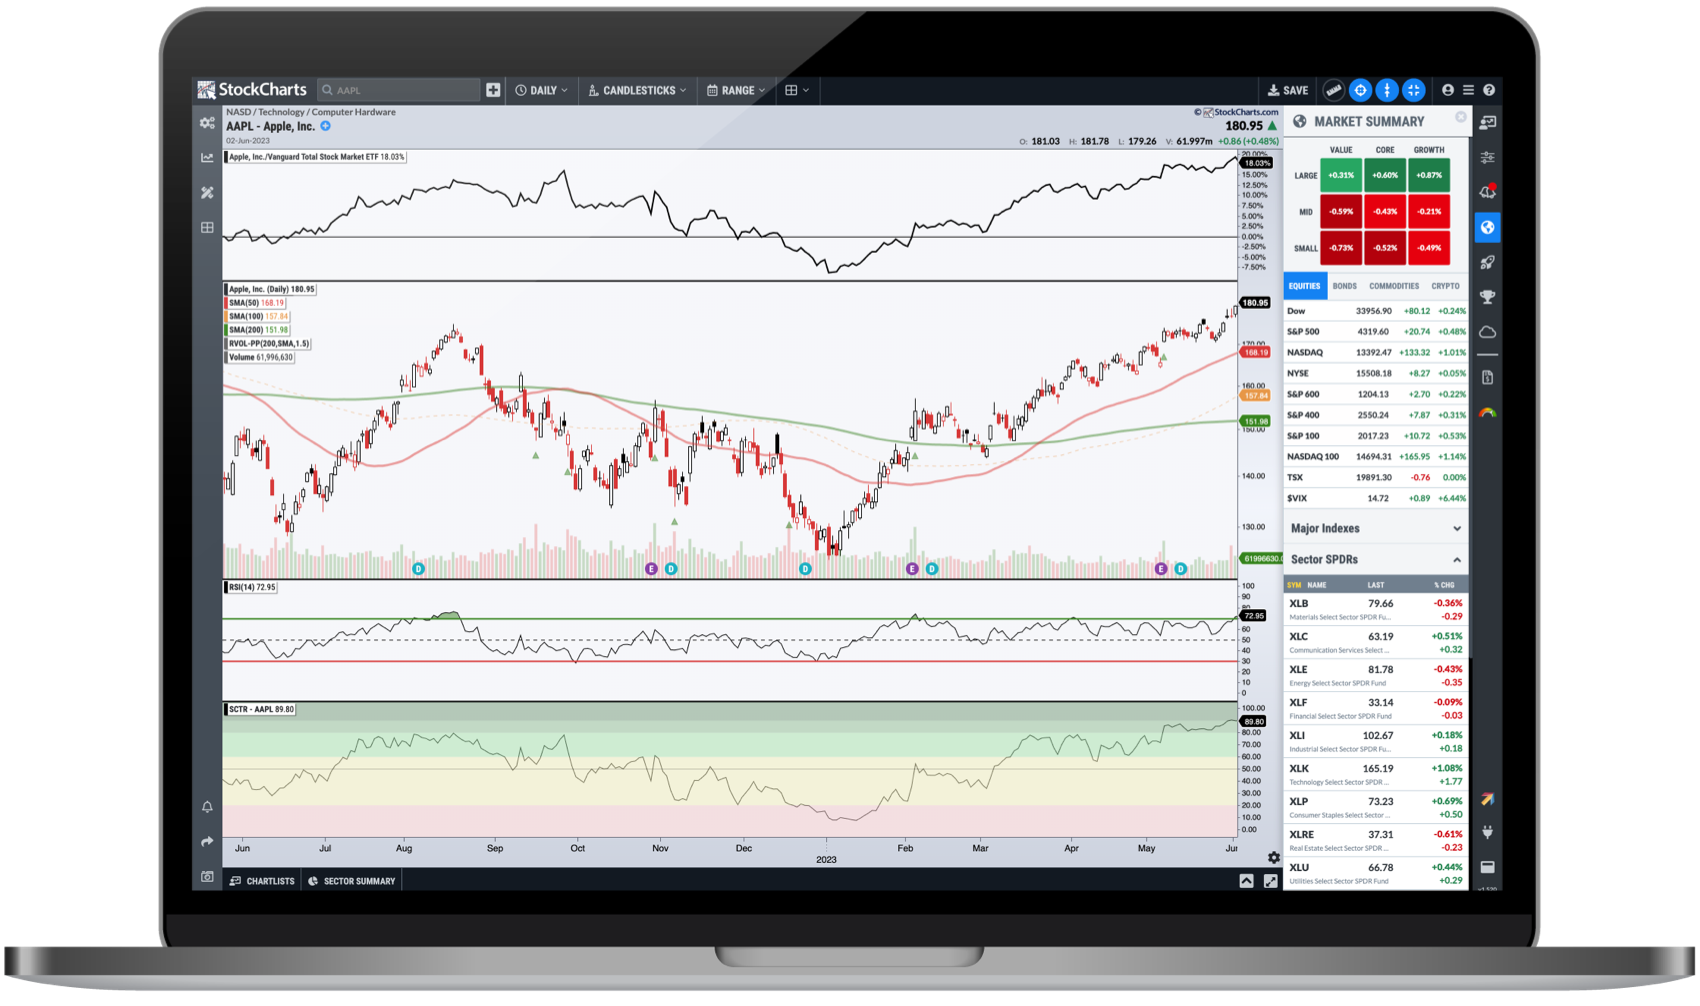
ACP is designed to redefine the way that you chart and analyze the financial markets, with more technical tools and capabilities than ever before.
Engage with the markets and your portfolio in entirely new ways with a highly-interactive charting experience that knows no bounds.
Every investor has different needs and ACP is designed to support them all, with a wide array of technical indicators and overlays, customizable multi-chart layouts, additional data views, and much more.
ACP brings you the web's most advanced technical charting platform, seamlessly integrated with the rest of the StockCharts feature set to create an unrivaled analysis and portfolio management toolkit.
With affordable pricing, flexible renewal options, and multiple service levels to choose from, it's easy to find the account that's just right for you. Plus, our hassle-free account management makes it simple to cancel at any time - no games, no tricks, no runaround. You deserve to stay focused on the charts without worrying about your bill.
You save $49.95 a year
core tools

You save $19.95 a year
$239.40 / year USD + 1 free month
most popular
You save $29.95 a year
$359.40 / year USD + 1 free month
Full-power charting
You save $49.95 a year
$599.40 / year USD + 1 free month
Returning to StockCharts? Click Here to rejoin with your old settings!

Upgrade your toolkit with our premium features now in less than 60 seconds.
Visit our Support Center or contact our support team for answers and assistance.
Support Center