

Today I modified the Diamond Scan to allow the PMO to rise only two days rather than three days. This opened up about 10 more stocks to view and, I have to say, it was easier to find diamonds in the rough using that technique. For those who love to scan, try using a "//" in front of a line of code to "comment it out." By reducing the requirements in your scan, it will allow you to view more results, and you may find them to be just as acceptable as the results from your more restrictive scan.
REMINDER: Tomorrow is "Reader Request Thursday"! Send me an email with your symbol requests and I will pick the five that look most interesting to me either on the buy side or the short side.
I love to get your feedback on DP commentary and, on Thursdays, I look at reader-requested symbols, so shoot me an email at erinh@stockcharts.com. I read every email I receive and try to answer them all! Your insight helps me to tailor my commentary to what my readers and viewers want to hear about.
Welcome to DecisionPoint Daily Diamonds, wherein I highlight five "diamonds in the rough." These are selected from the results of my DecisionPoint scans, which search for stocks that could benefit from the trend and condition of the market. Remember, these are not recommendations to buy or sell, but are the most interesting of the stocks that surfaced in my scans. My objective is to save you the work of the initial, tedious culling process, but you need to apply your own analysis to see if these stocks pique your interest as well. There are no guaranteed winners here!
Current Market Outlook:
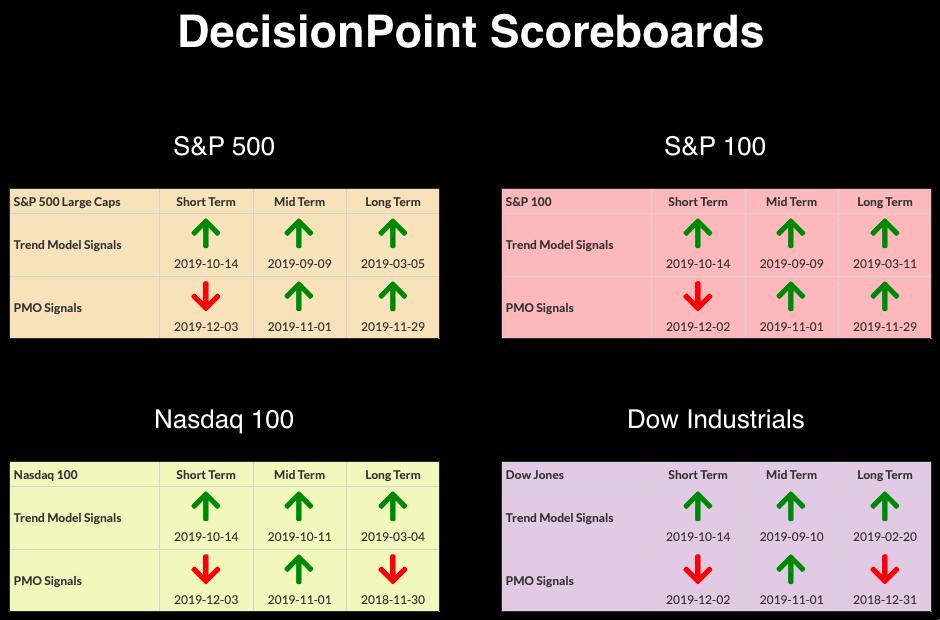
Market Trend: Currently, we have Trend Model BUY signals in all three timeframes on the DP Scoreboard Indexes.
Market Condition: The market is overbought and momentum is failing in the short term. Caution is warranted.
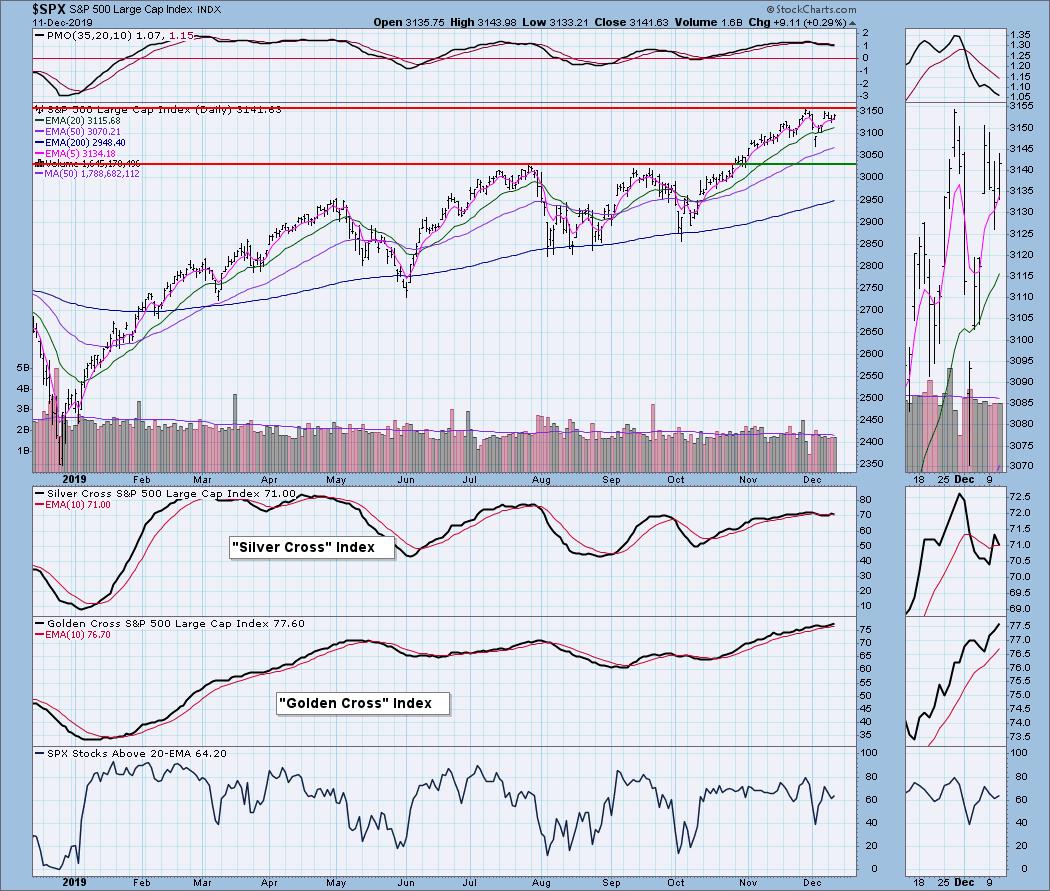
Market Environment: It is important to consider the odds for success. The Silver Cross Index measures the percentage of stocks on IT Trend Model BUY signals (20-EMA > 50-EMA), while the Golden Cross Index measures the percentage of stocks on LT Trend Model BUY signals (50-EMA > 200-EMA). Here are the current percentages on the Silver and Golden Cross Indexes:
Diamond Index:
- Diamond Scan Results: 18
- Diamond Dog Scan Results: 7
- Diamond Bull/Bear Ratio: 2.57
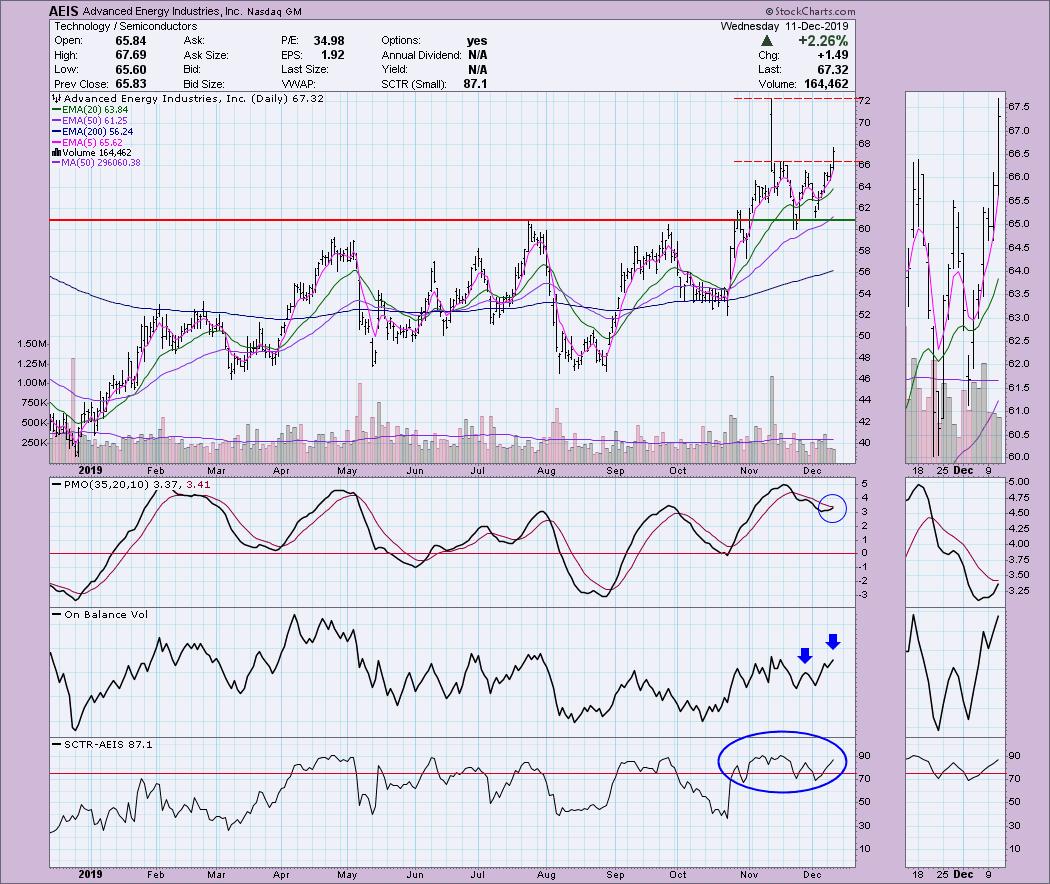
Advanced Energy Industries Inc (AEIS) - Earnings: 2/3 - 2/7/2020
It was a really nice breakout today for AEIS - maybe too good for an immediate entry. I might wait for a pullback toward that breakout area before entering. Upside potential based on the "pinocchio" bar from November. If it can reach that level in a day, it seems reasonable to think it could reach it in a few weeks. The PMO is turning up - notice that the OBV made a new high with today's breakout. SCTR is healthy.
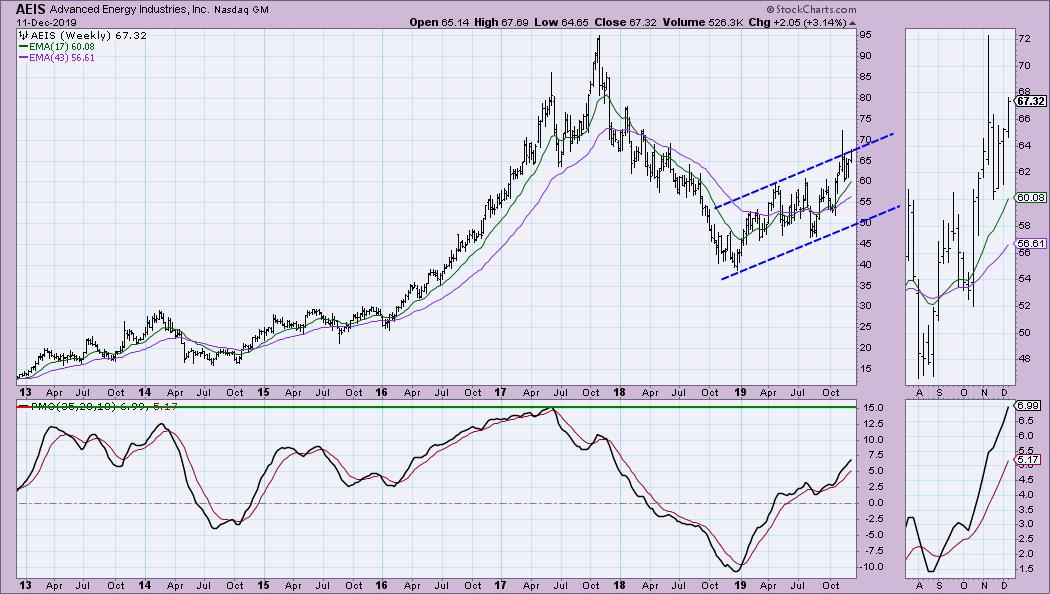
The pinocchio bar was a breakout from a rising trend channel. The PMO is rising nicely along with both the 17- and 43-week EMAs. My only concern is that a trip down to the bottom of this rising trend channel is a possibility in the intermediate-term.
Cognex Corp (CGNX) - Earnings: 2/12 - 2/17/2020
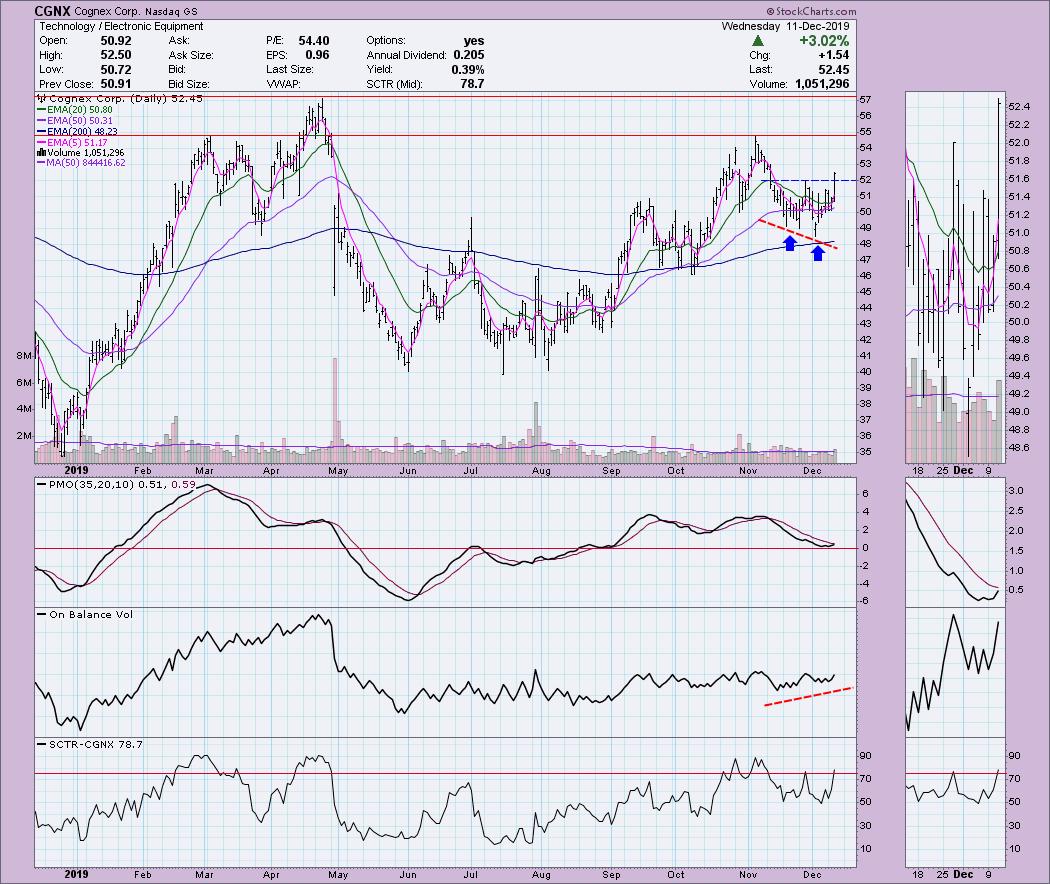
We have a double-bottom on CGNX that has executed with today's 3%+ rally. This is another one that you may want to watch for a bit of a pullback before entering. The PMO is rising and headed for a BUY signal. I also spied a sweet positive divergence between the OBV and price bottoms.
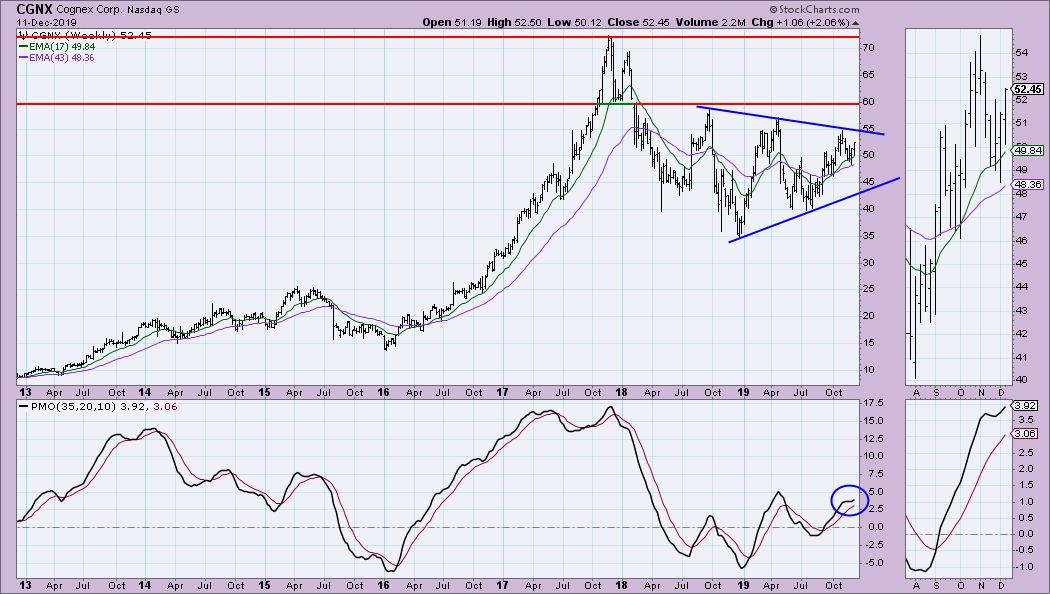
The rising PMO is what is most positive on the weekly chart. There is a large symmetrical triangle pattern. Price can break either way from these formations but, typically, they are continuation patterns, meaning the trend that preceded the pattern is the direction you should expect it to break. Unfortunately, that is a declining trend.
WW Grainger Inc (GWW) - Earnings: 1/30/2020
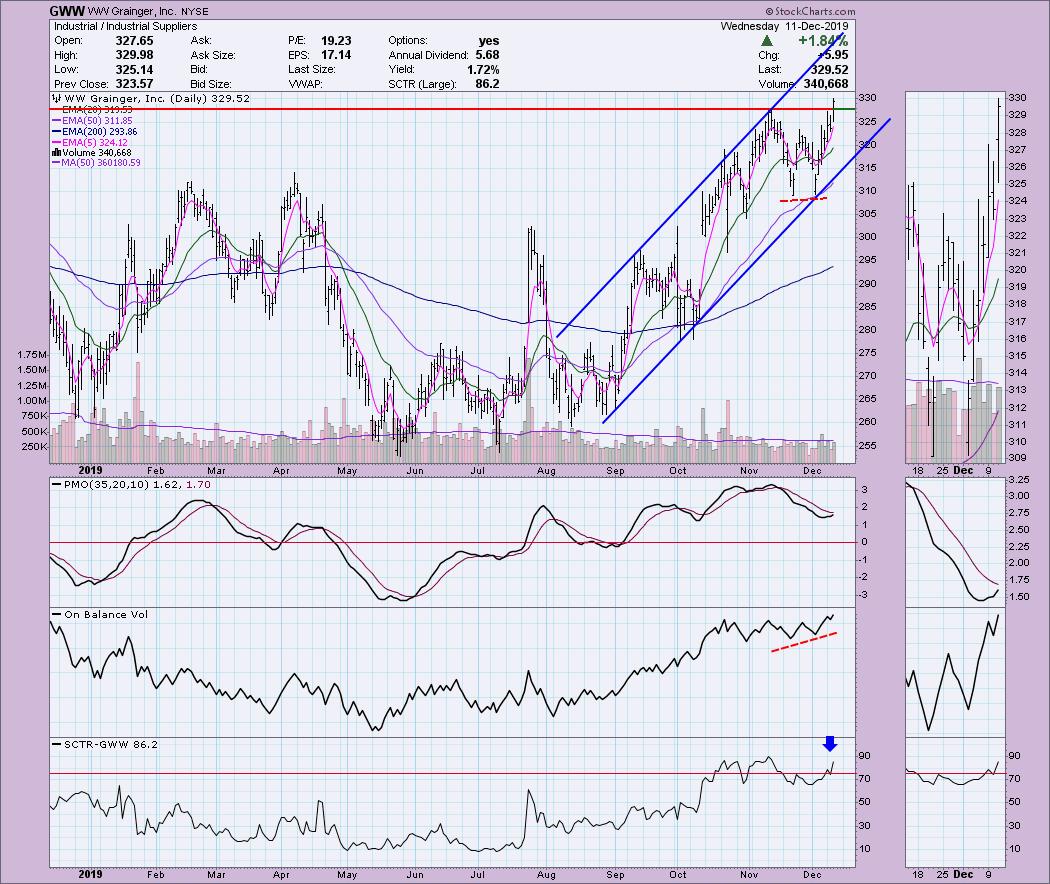
There is a rising trend channel on GWW and it appears that price is ready to go test the top of that channel. While the OBV isn't totally in a positive divergence with price bottoms, it is certainly confirming with rising bottoms that are steeper that the price lows. PMO is rising and isn't particularly overbought. The SCTR has just moved into the "hot zone" above 75.
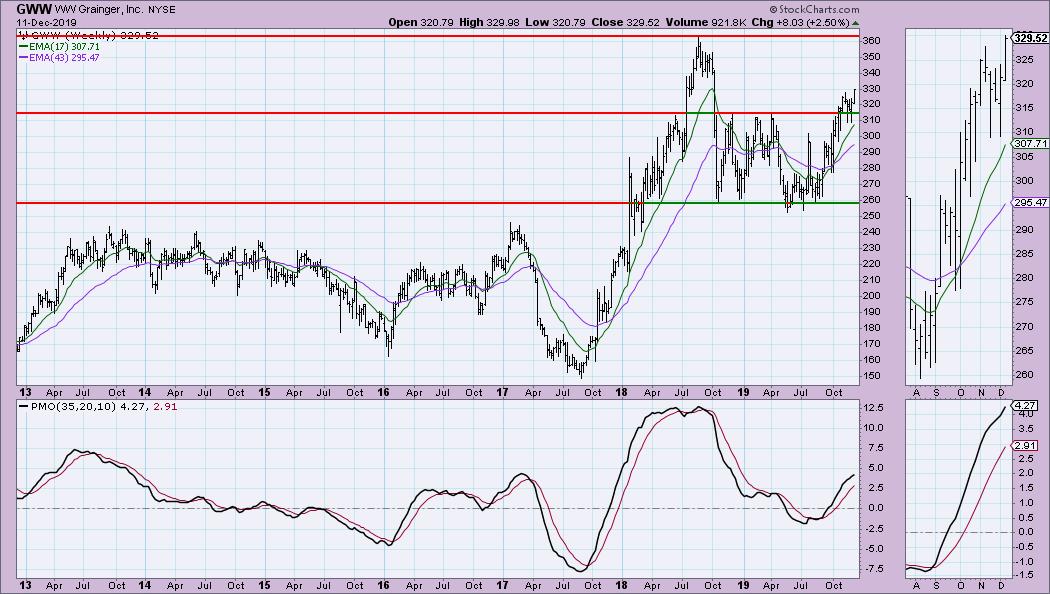
The weekly chart looks great. Nicely rising PMO is accompanied by a breakout from a very long-term trading channel. The only upside resistance I see is at the 2018 high. The PMO is also not overbought.
KB Home (KBH) - Earnings: 1/7 - 1/13/2020
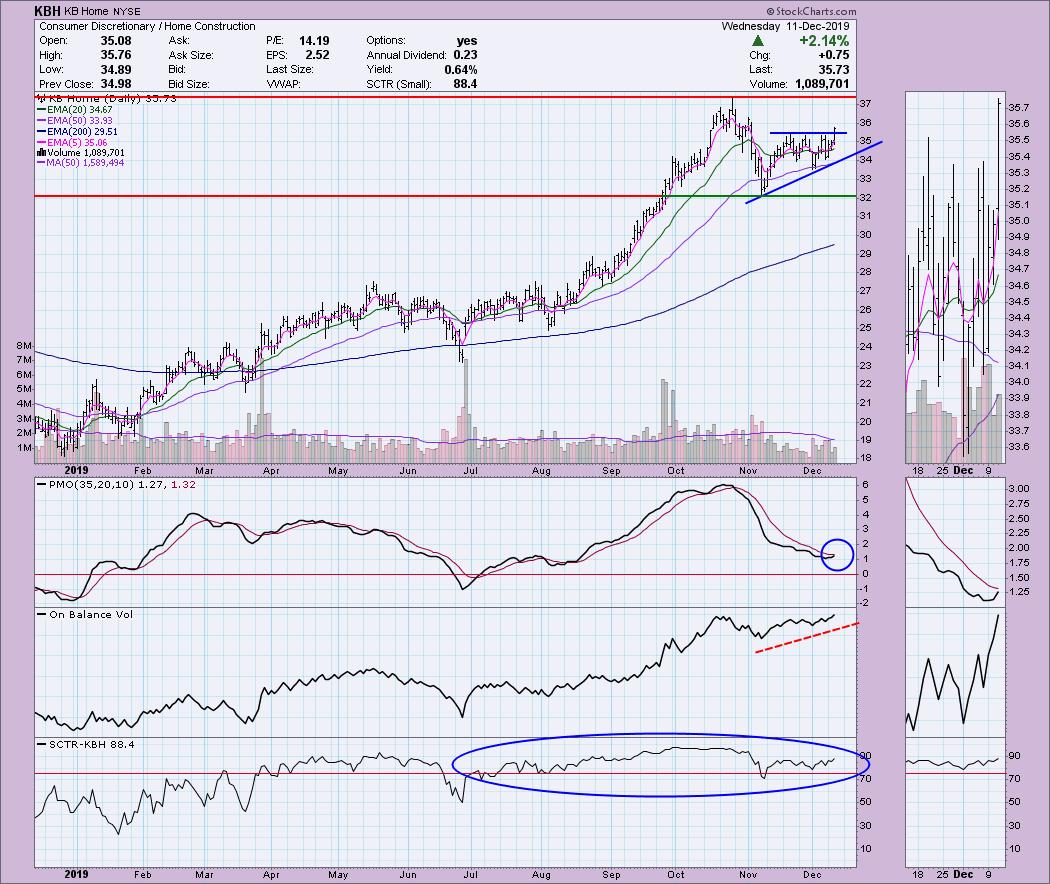
Today saw a breakout from a bullish ascending triangle. The PMO is nearing a BUY signal and the OBV is confirming the rising trend.
Overhead resistance is at the October high. KBH has been showing internal and relative strength as the SCTR has remained above 75 for the majority of the last six months.
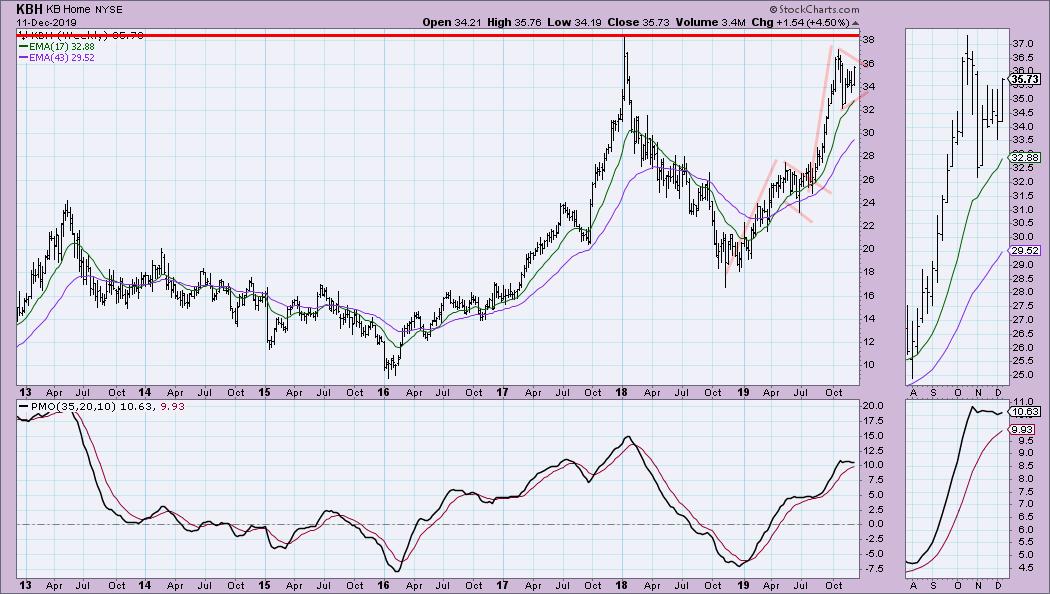
There is a possible bull flag on the weekly chart. I note that we saw a flag off the 2018 lows, and now we have another that looks like it may be executing. The PMO is flat, but is currently rising. Overhead resistance is clearly marked at the cardinal price top from early 2018.
PNC Financial Services Group Inc (PNC) - Earnings: 1/15/2020
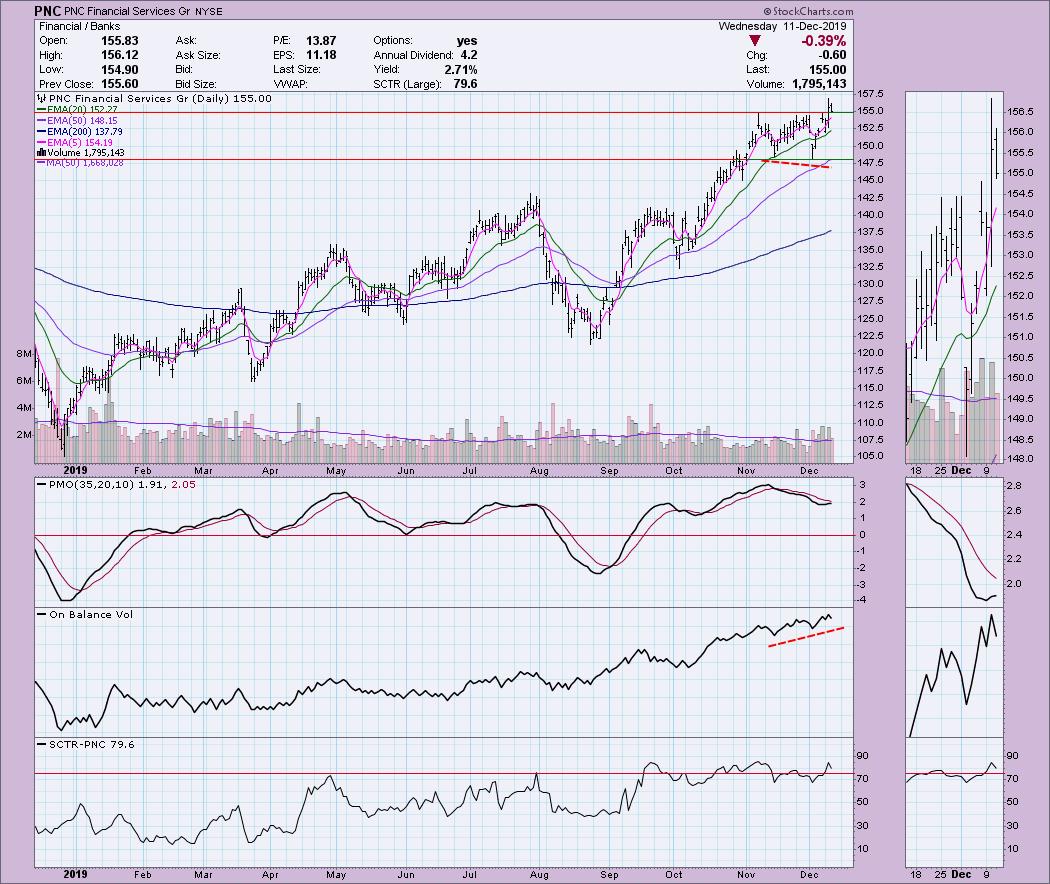
The PMO is little on the overbought side here, but the OBV positive divergence is clear and it has been rallying ever since. The breakout occurred yesterday and today we got the pullback, which is my preferred entry point.
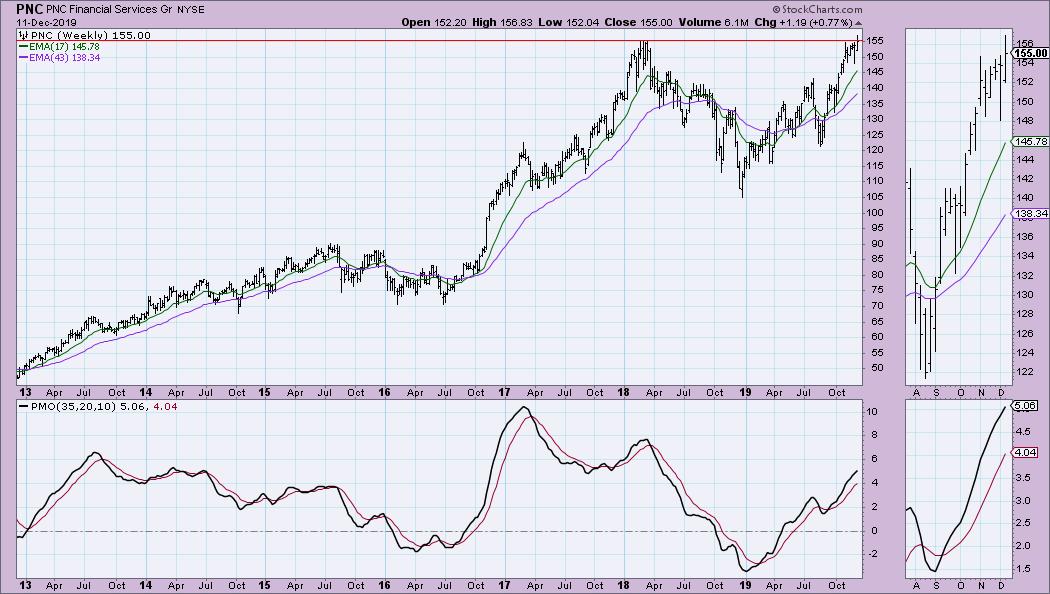
On a longer-term chart, we can see that today's breakout is significant when matched to the previous all-time high. The PMO is rising strongly and is not overbought.
Full Disclosure: I do not own any of the stocks presented and am not planning on adding any in the near future. Do know that my trading selections nearly all come from my scan results and diamonds - I'm just not ready for entries. I remain in 80% cash.
Market Vision 2020 - Sign Up for Details
I am so excited to participate in "Market Vision 2020", an online financial conference on Saturday, January 4, 2020 to kick off the new year. Make sure you're subscribed to the Market Vision 2020 newsletter in order to receive the latest updates on the event (and save a lot of money if you decide to attend!). *Click Here* to subscribe to the free newsletter. There will be lots of giveaways and free educational events for everyone who follows along – don't be left out!

Erin Swenlin will be presenting at the The MoneyShow Las Vegas on May 11-13, 2020! You'll have an opportunity to meet Erin and discuss the latest DecisionPoint news and Diamond Scans. The conference is free to attend or view online!
Watch the latest episode of DecisionPoint with Carl & Erin Swenlin LIVE on Mondays 5:00p EST or on the StockCharts TV YouTube channel here!
Technical Analysis is a windsock, not a crystal ball.
Happy Charting!
- Erin
erinh@stockcharts.com
NOTE: The stocks reported herein are from mechanical trading model scans that are based upon moving average relationships, momentum and volume. DecisionPoint analysis is then applied to get five selections from the scans. The selections given should prompt readers to do a chart review using their own analysis process. This letter is not a call for a specific action to buy, sell or short any of the stocks provided. There are NO sure things or guaranteed returns on the daily selection of "diamonds in the rough."
Helpful DecisionPoint Links:
DecisionPoint Shared ChartList and DecisionPoint Chart Gallery
Price Momentum Oscillator (PMO)
Swenlin Trading Oscillators (STO-B and STO-V)
**Don't miss DecisionPoint Commentary! Add your email below to be notified of new updates"**