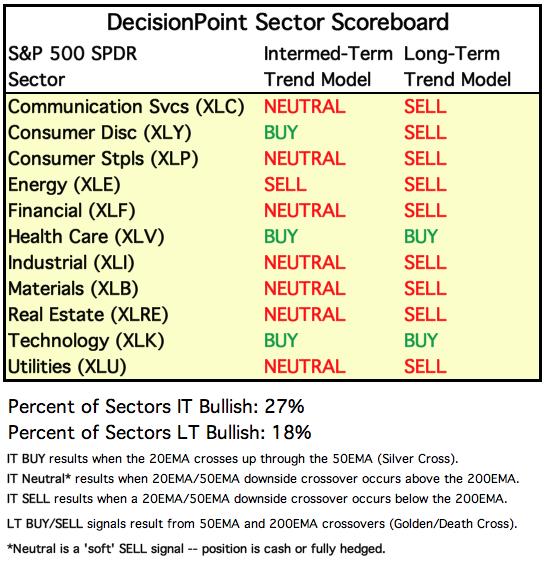
The Swenlin Trading Oscillators (STOs) have been very helpful in deciphering short-term tops and bottoms. This is why it is troubling to see them topping today. On the bullish front, Consumer Discretionary (XLY) logged a new IT Trend Model BUY signal on today's "Silver Cross" of the 20/50-EMAs. This group has been gaining relative strength with many coronavirus sensitive stocks within (stay-at-home shopping a big one). The indicators are fairly positive for the sector, but we do see that %stocks above their 20/50-EMAs is turning over and the BPI has a negative divergence with price tops. On the positive side, the OBV is confirming. Like the major market indices, we have a bearish rising wedge.

Live Trading Room - Tuesdays/Thursdays
I'm teaming up with Mary Ellen McGonagle (MEMInvestmentResearch.com) to do regular "LIVE Trading Room" sessions for FREE at 11:00a EST. We've had excellent reviews on our new LIVE Trading Rooms so far and plan on continuing them Tuesdays/Thursdays 11:00a EST. They will ALWAYS be free to DecisionPoint subscribers. They currently are free to all, so tell your colleagues to sign up for our free email list on DecisionPoint.com to be notified!
Here is the linkfor tomorrow's (4/30) live trading room.

TODAY'S Broad Market Action:

Past WEEK Results:
Top 10 from ETF Tracker:

Bottom 10 from ETF Tracker:

On Friday, the DecisionPoint Alert Weekly Wrap presents an assessment of the trend and condition of the stock market (S&P 500), the U.S. Dollar, Gold, Crude Oil, and Bonds. Monday through Thursday the DecisionPoint Alert daily report is abbreviated and covers changes for the day.
Watch the latest episode of DecisionPoint on StockCharts TV's YouTube channel here!
SECTORS
SIGNALS:
Each S&P 500 Index component stock is assigned to one, and only one, of 11 major sectors. This is a snapshot of the Intermediate-Term (Silver Cross) and Long-Term (Golden Cross) Trend Model signal status for those sectors.

TODAY'S RESULTS:

One WEEK Results:
STOCKS
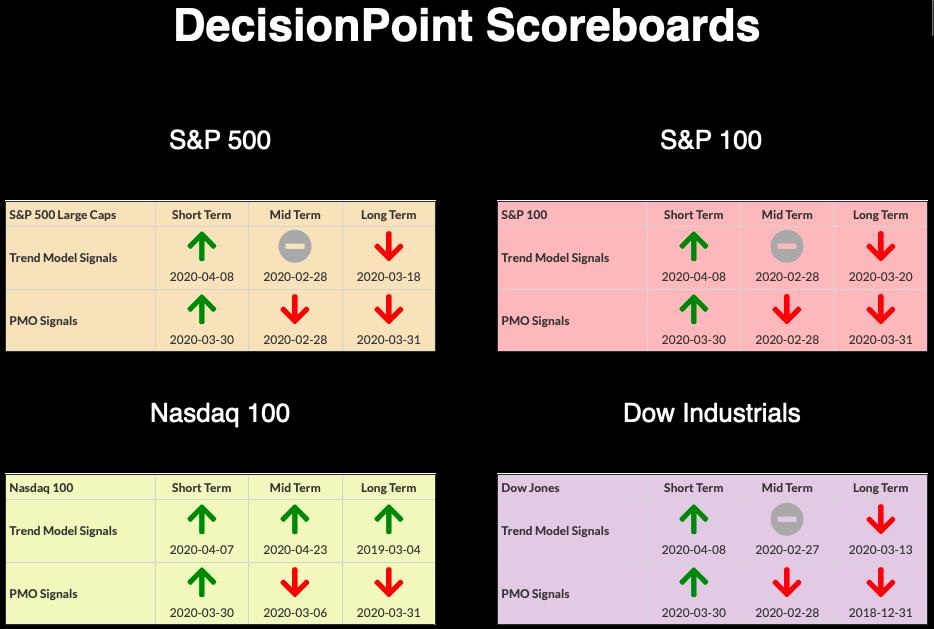
IT Trend Model: NEUTRAL as of 2/28/2020
LT Trend Model: SELL as of 3/19/2020
SPY Daily Chart: Volume tapered off slightly on today's decline, but it was still quite elevated. We do have a rising PMO that has entered positive territory, but there are problems. The rising wedge is getting old, but is still valid at this point. There is a negative divergence with the OBV. The VIX is also an issue; it is beginning to trend lower after touching the upper Bollinger Band on the inverted scale.

Climactic Market Indicators: Today we saw negative climactic readings. Combine these with the VIX and I have to say we are looking at a selling initiation. We should expect lower prices going into tomorrow.

Short-Term Market Indicators: The ST trend is UP and the market condition is OVERBOUGHT based upon the Swenlin Trading Oscillator (STO) readings. The STOs topped today and that generally is the main ingredient in the recipe for a short-term decline. How much of a decline? I believe worst case is 270 level on the SPY.

Intermediate-Term Market Indicators: The Silver Cross Index (% of SPX stocks 20EMA > 50EMA) and the Golden Cross Index (percent of SPX stocks 50EMA > 200EMA) are both rising. The BPI topped just like the STOs, only the BPI set a lower top which sets up a negative divergence with price tops.

The IT trend is UP and the market condition is NEUTRAL based upon the ITBM and ITVM. The intermediate term still looks good with the indicators continuing to rise in positive territory.

CONCLUSION: The ST is UP and IT trend is also UP. Market condition based on ST indicators is overbought and based on IT indicators is NEUTRAL. My biggest worry are the Swenlin Trading Oscillators which have topped. Add to that the likely selling initiation on our climactic indicators and the short term is looking shaky. The intermediate-term indicators still look bullish, so I'm looking for a decline that at worst might bring us down to the 270 level on the SPY.
(Not a Diamonds subscriber? Add it to your DP Alert subscription and get a discount! Contact support@decisionpoint.com for your limited time coupon code!)
DOLLAR (UUP)
IT Trend Model: BUY as of 3/12/2020
LT Trend Model: BUY as of 5/25/2018
UUP Daily Chart: Today the rising bottoms trendline that forms the bottom of the symmetrical triangle was broken. It wasn't a decisive breakdown (3%+ move from a breakout point constitutes "decisive"), but we do have that double-top looming large. If price breaks down through the confirmation line at $26.75, we could be looking at a prospective downside target at $26.00.

GOLD
IT Trend Model: BUY as of 12/26/2019
LT Trend Model: BUY as of 1/8/2019
GOLD Daily Chart: Gold continue to slide today, nearly reaching the confirmation line. The PMO has triggered a SELL signal. I would look for the confirmation line to at least be tested.

GOLD MINERS Golden and Silver Cross Indexes: Yesterday's comments still apply: "The flag formation executed with a breakaway gap, followed by a continuation gap. I suspect Miners are taking a pause to digest those moves. The indicators are looking healthy. The BPI is overbought, but it can stay that way for weeks. Miners look good."

CRUDE OIL (USO)
IT Trend Model: Neutral as of 1/27/2020
LT Trend Model: SELL as of 2/3/2020
USO Daily Chart: USO spared itself from becoming a penny stock by doing a 1:8 reverse split yesterday. At this point, I wouldn't touch Oil right now. The PMO may be turning up, but we see how that turned out earlier this month. I read some interesting commentary from Jared Dillian of the Mauldin Economics newsletter, "The 10th Man". You might find it enlightening:
"There was open speculation last week about whether the United States Oil Fund (USO) would fail amid all the drama in the expiring May futures contract.
Luckily for USO, it didn't own any of those May contracts, having already rolled to June. But the Chicago Mercantile Exchange, where a lot of these contracts get traded, and the clearing firms took a hard look at the situation.
They decided it would be really bad if June oil futures went negative.
So the managers of USO rolled their June contracts into the deferred months. Then, lo and behold, June oil futures staged an impressive rally, with the contango flattening... and USO missing out on returns.
Still, USO did what it had to do—it had to truncate the very real risk that WTI would go negative again, which would likely blow up the fund."

BONDS (TLT)
IT Trend Model: BUY as of 1/22/2020
LT Trend Model: BUY as of 1/2/2019
TLT Daily Chart: Price lost support at the 20-EMA which tells me we likely will test the confirmation line of the double-top. Volume is increasing on this decline and the PMO is falling.

Have you subscribed the DecisionPoint Diamonds yet? DP does the work for you by providing handpicked stocks/ETFs from exclusive DP scans! Add it with a discount! Contact support@decisionpoint.com for more information!
Technical Analysis is a windsock, not a crystal ball.
Happy Charting! - Erin
Email: erin@decisionpoint.com
Erin Swenlin will be presenting at the The MoneyShow Las Vegas August 16 - 20 at Bally's/Paris Resort! You'll have an opportunity to meet Erin and discuss the latest DecisionPoint news and Diamond Scans. Claim your FREE pass here! You can watch online with this pass too!! There will be online events held in May and when I have more information I'll let you know.
NOTE: The signal status reported herein is based upon mechanical trading model signals, specifically, the DecisionPoint Trend Model. They define the implied bias of the price index based upon moving average relationships, but they do not necessarily call for a specific action. They are information flags that should prompt chart review. Further, they do not call for continuous buying or selling during the life of the signal. For example, a BUY signal will probably (but not necessarily) return the best results if action is taken soon after the signal is generated. Additional opportunities for buying may be found as price zigzags higher, but the trader must look for optimum entry points. Conversely, exit points to preserve gains (or minimize losses) may be evident before the model mechanically closes the signal.
Helpful DecisionPoint Links (Can Be Found on DecisionPoint.com Links Page):
DecisionPoint Shared ChartList and DecisionPoint Chart Gallery
Price Momentum Oscillator (PMO)
Swenlin Trading Oscillators (STO-B and STO-V)
