
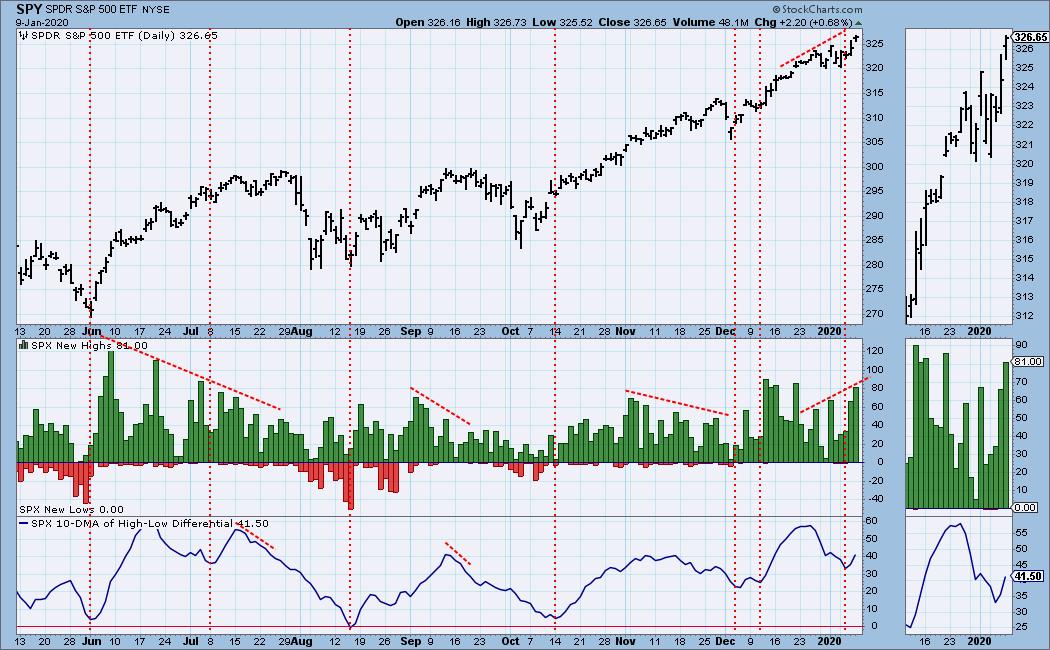
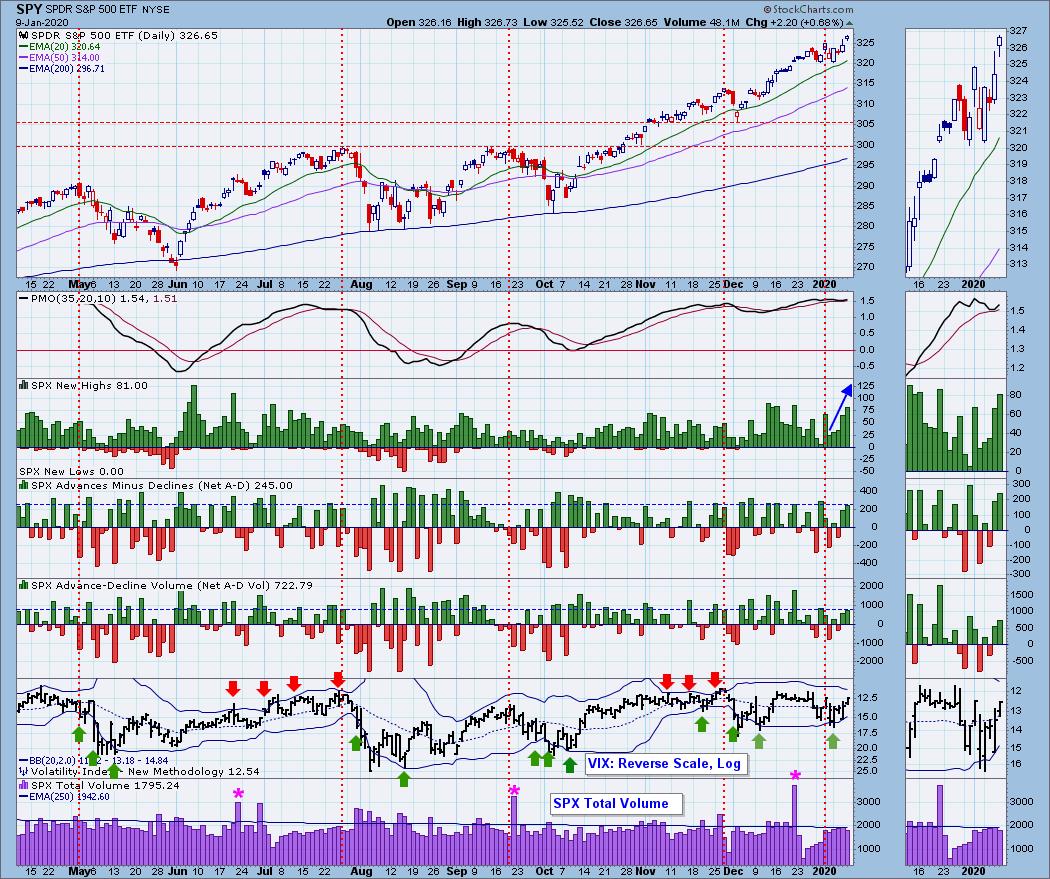
One of my favorite indicators is the 10-DMA of the High-Low Differential that is on our ST New Highs/New Lows chart. This chart is available to all members in the "DecisionPoint Alert ChartList" with annotations. New Highs continued to expand for the fourth day in a row. I noticed that we have a defined bottom on the H-L Differential. These indicator bottoms are generally right on the money. Tops on this indicator are fairly good determinants of a downturn on the way. We've watched negative divergences in play before, but with today's reading, I'm seeing a confirmation as readings are rising.
The DecisionPoint Alert Weekly Wrap presents an end-of-week assessment of the trend and condition of the stock market (S&P 500), the U.S. Dollar, Gold, Crude Oil, and Bonds. Monday through Thursday the DecisionPoint Alert daily report is abbreviated and covers changes for the day.
Watch the latest episode of DecisionPoint on StockCharts TV's YouTube channel here!
SECTORS
SIGNALS:
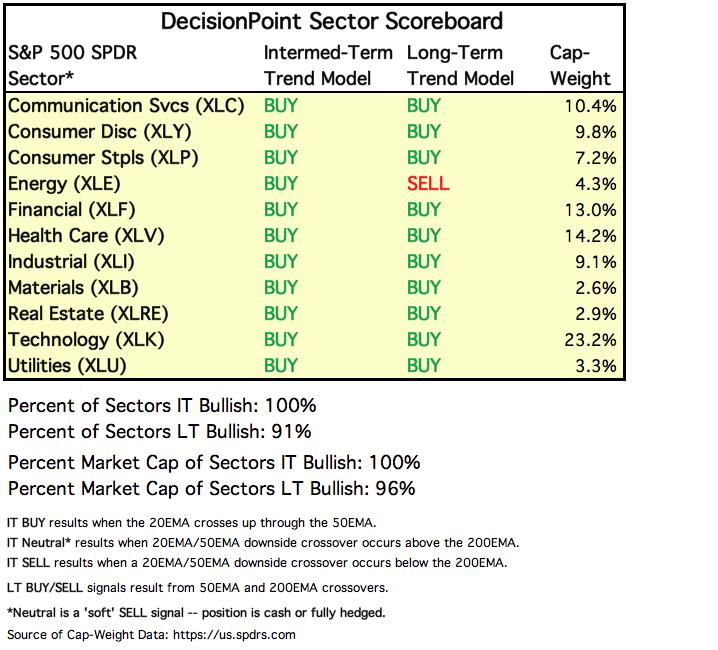
Each S&P 500 Index component stock is assigned to one, and only one, of 11 major sectors. This is a snapshot of the Intermediate-Term (Silver Cross) and Long-Term (Golden Cross) Trend Model signal status for those sectors.
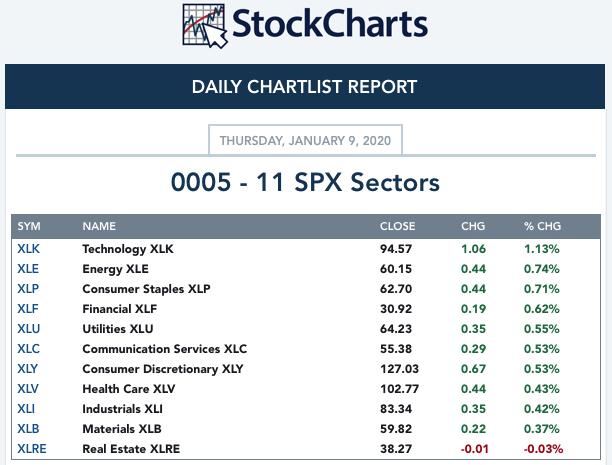
TODAY'S RESULTS:
STOCKS
IT Trend Model: BUY as of 9/6/2019
LT Trend Model: BUY as of 2/26/2019
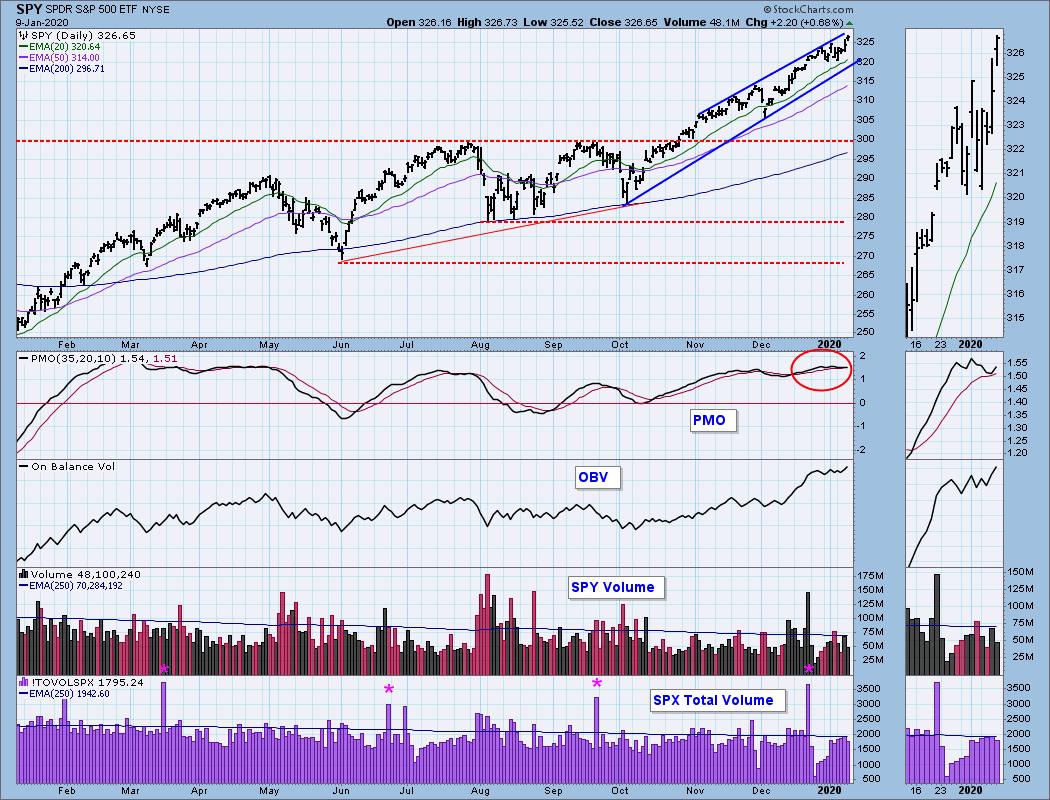
SPY Daily Chart: The bearish rising wedge could turn into a rising trend channel if the market moves a bit higher. The PMO is continuing to rise after bottoming above its signal line (which I always find to be especially bulish). It is somewhat overbought, but we've certainly seen readings just above +2. The OBV made a new high and is confirming the new all-time high. Volume dropped off today on the SPY, but was about even on the SPX.
Climactic Market Indicators: New Highs are rising as I noted in my opening and are reaching heights that suggest short-term strength and a rally continuation. Breadth readings weren't climactic, but they are positive. The VIX has gotten above the moving average on the inverted scale which also suggests short-term strength.
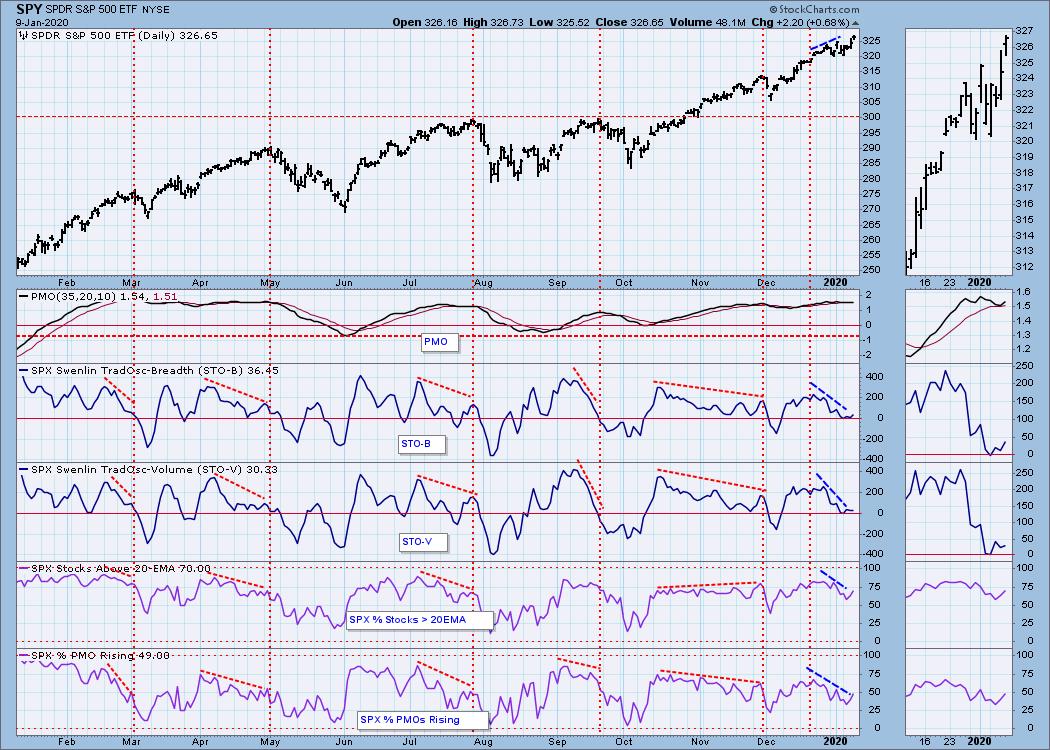
Short-Term Market Indicators: The STOs are breaking out of their declining trends. Oscillation above the zero line is bullish and suggests internal strength. I'm relieved to see the %stocks above their 20/50-EMAs is improving. This tells me that we could be seeing the beginning of broader participation.
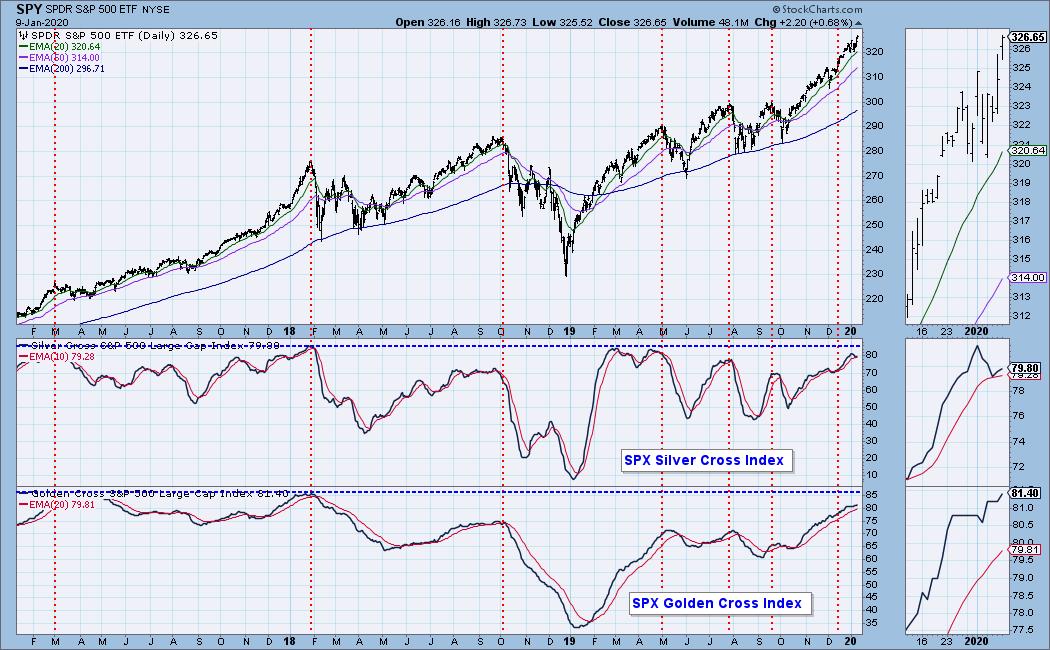
Intermediate-Term Market Indicators: Both the SCI and GCI have turned up and remain in the healthy > 75% zone.
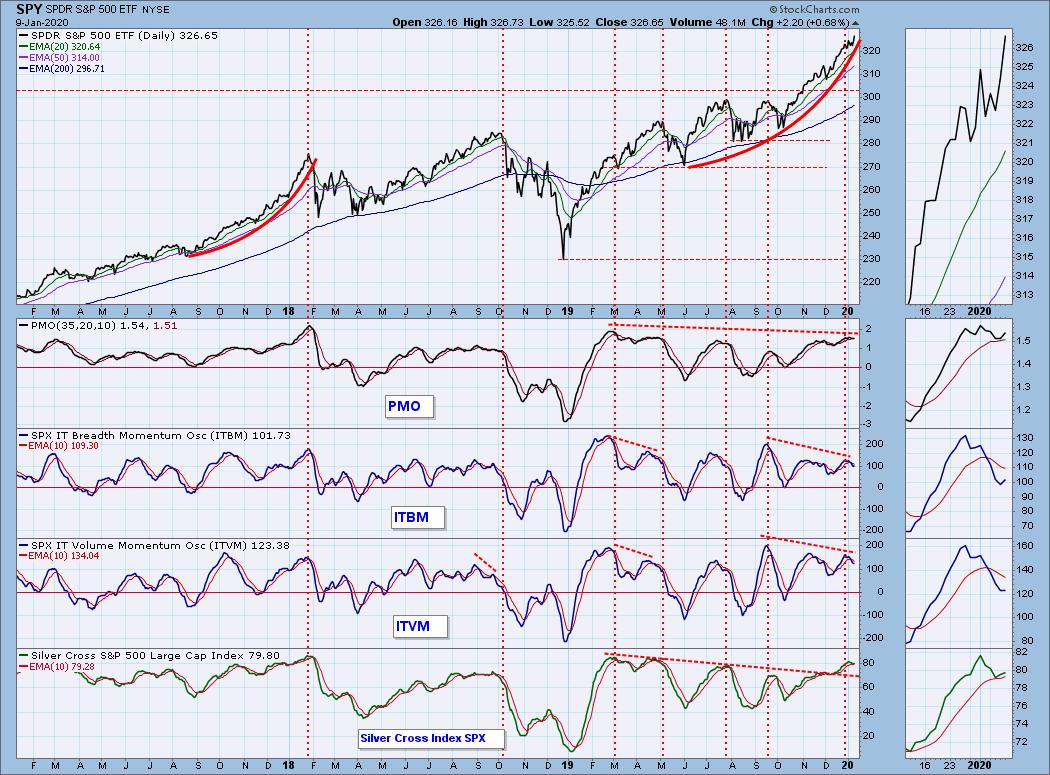
The ITBM/ITVM are still bearish, but they are beginning to bottom. They aren't overbought and could handle more upside movement in the market before reaching extremes.
CONCLUSION: I talked to my friend and fellow analyst, Mary Ellen McGonagle (MEM Investment Research) about the drop off at the end of the close yesterday and she told me it had to do with more missiles and not a crisis of confidence. She remains very bullish. Today's market action, along with the reversal in many of our indicators has me more bullish. Full disclosure, I did end up adding some new positions today (all of them selected from previous DP Diamonds Reports, yesterday's in particular) as I saw the continuation of yesterday's market action and our indicators looking more bullish.
DOLLAR (UUP)
IT Trend Model: NEUTRAL as of 12/11/2019
LT Trend Model: BUY as of 5/25/2018
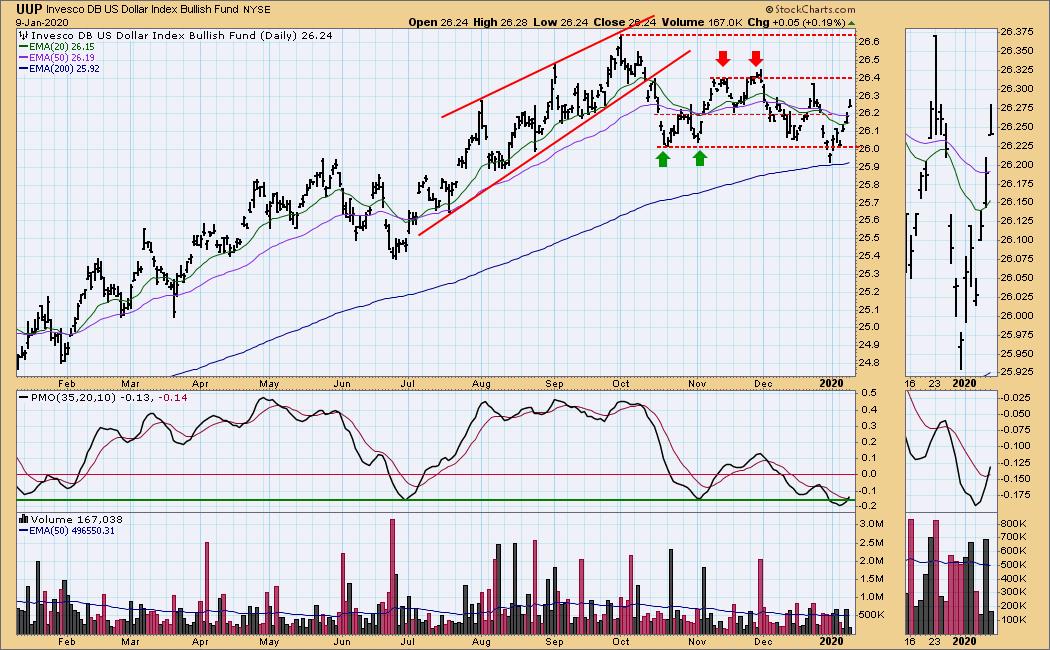
UUP Daily Chart: The Dollar was up today and a new PMO BUY signal was triggered. Today's OHLC bar is a shooting star on a candlestick chart. You do not want to see those happen in a resistance area. We still have more upside before it hits overhead resistance and the PMO is quite positive. I'm still looking for a test at $26.40. Just be aware we could be looking at a short-term top like the one in December that hit right after a PMO BUY signal. Short-term I still like the Dollar.
GOLD
IT Trend Model: BUY as of 12/26/2019
LT Trend Model: BUY as of 1/8/2019
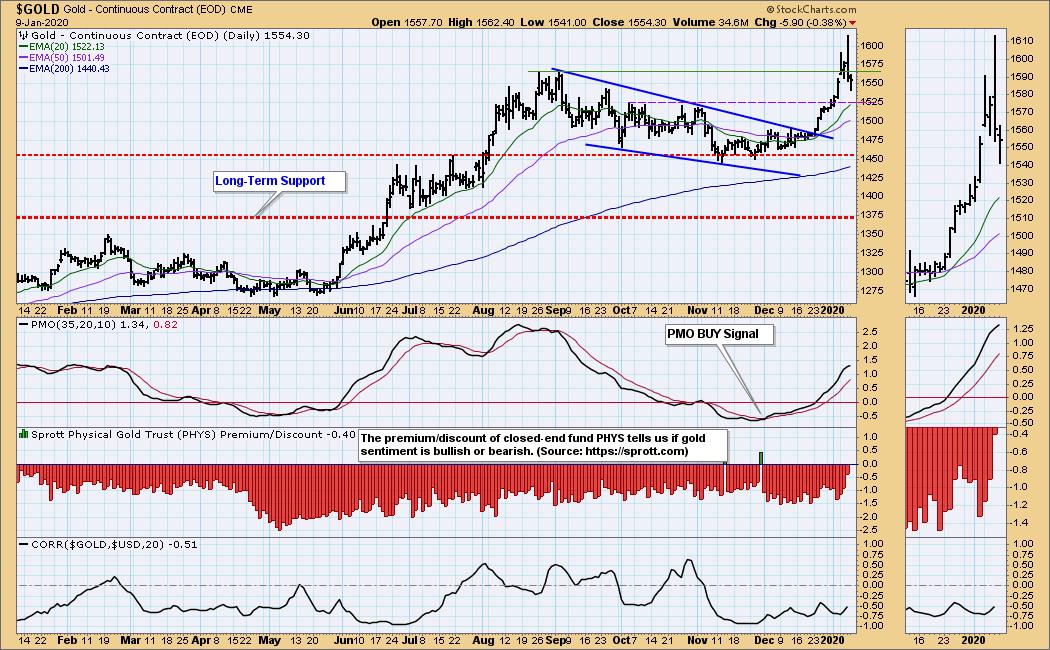
GOLD Daily Chart: With a positive outlook on the Dollar, I suspect Gold will continue with this pullback. However, it is nearing support at the October highs. That's the area I would begin to look for another resurgence. The PMO just looks too good. We will likely see it flatten and possibly top if price declines further. The BUY signal came in oversold territory. It was a clean crossover and despite rising steadily, it isn't overbought yet.
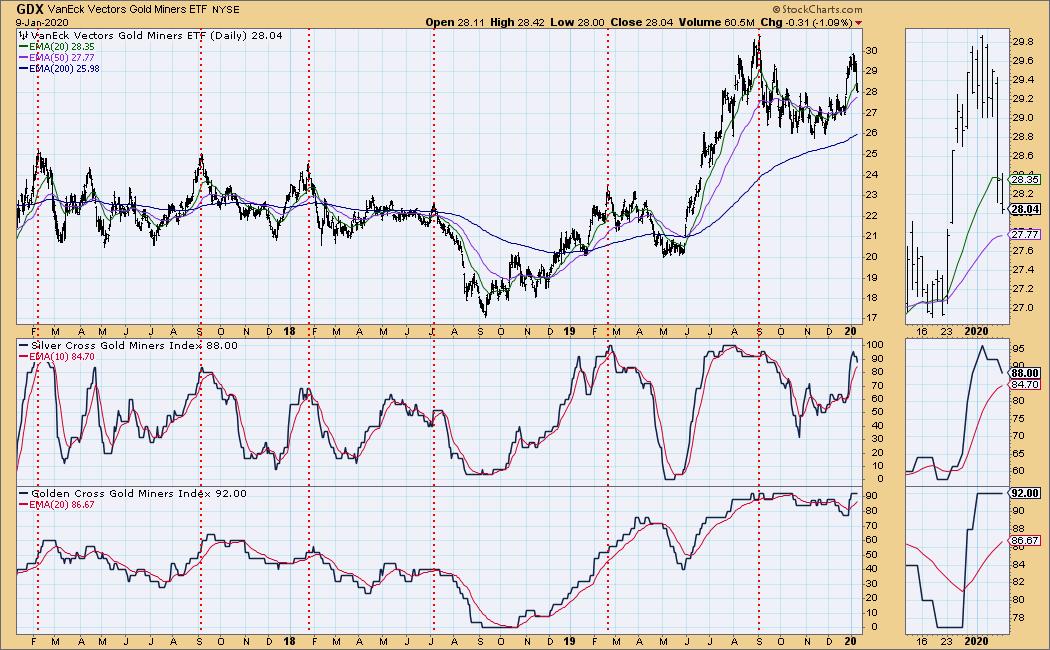
GOLD MINERS Golden and Silver Cross Indexes: We're seeing some deterioration on the SCI, but with readings at 88 and 92, I would say the Gold Miners are still okay. They are subject to fluctuations in Gold, but not necessarily driven by them. They needed a pullback after the race to the top at the end of 2019.
CRUDE OIL (USO)
IT Trend Model: BUY as of 11/6/2019
LT Trend Model: BUY as of 12/16/2019
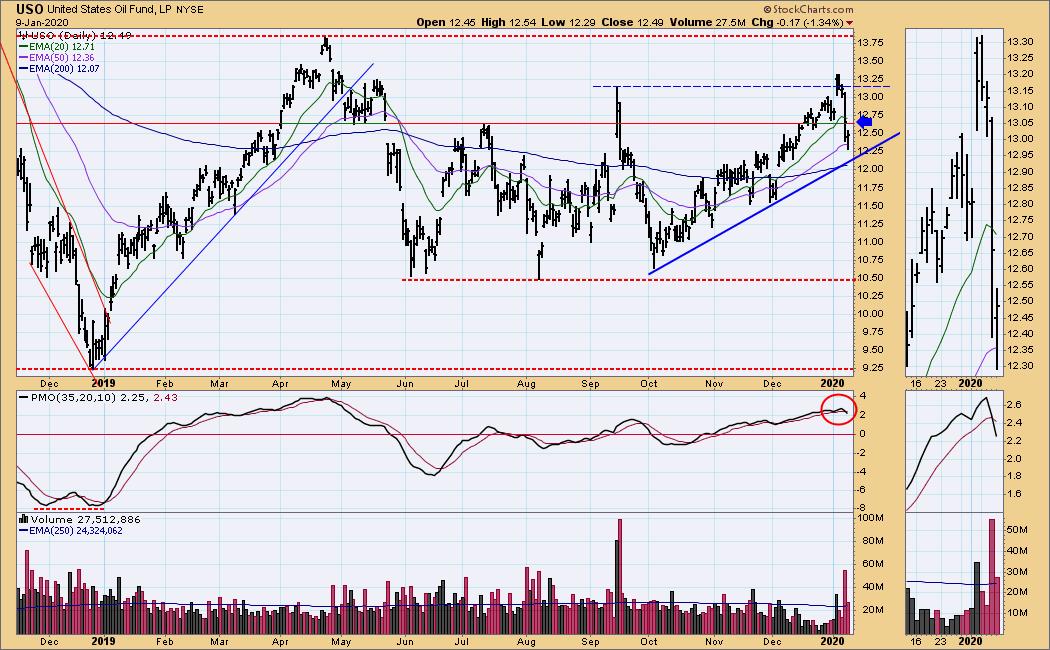
USO Daily Chart: Oil prices are still falling. Price lows nearly tested the current rising trend. The PMO is overbought and sinking with a SELL signal triggering today. It looks like the top of the trading zone has been hit and price is now ready to test the bottom of the range. I suspect the rising bottoms trendline will be broken.
BONDS (TLT)
IT Trend Model: NEUTRAL as of 12/12/2019
LT Trend Model: BUY as of 1/2/2019
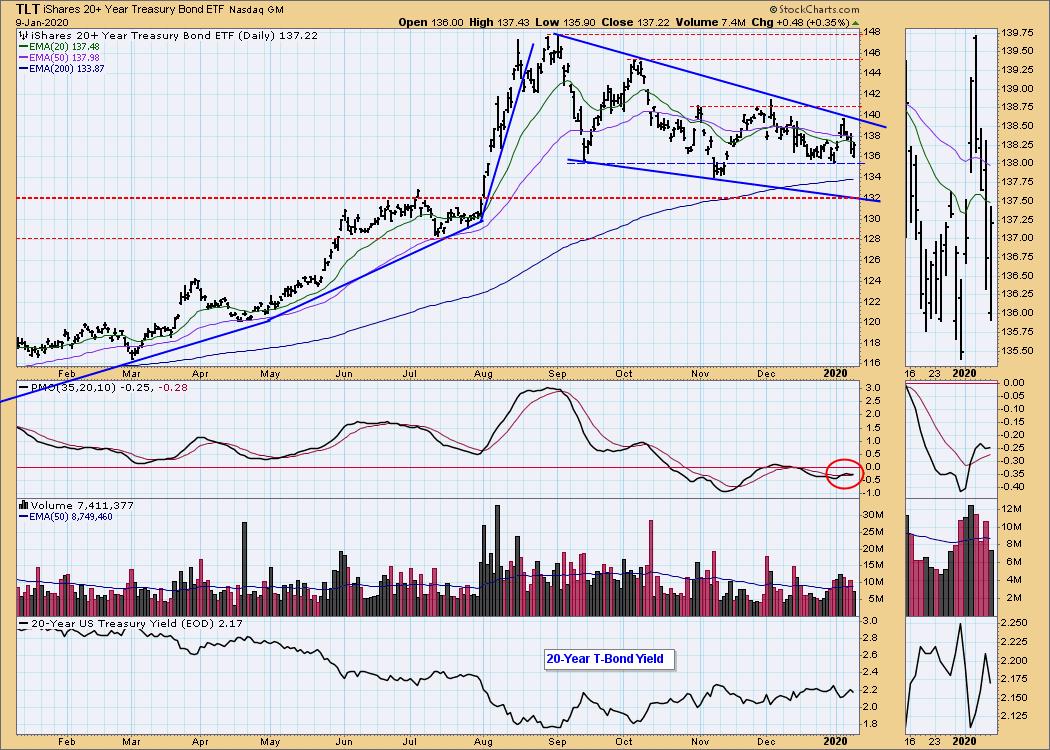
TLT Daily Chart: Bonds rebounded today and the PMO is attempting a move back up. We could be looking at a support level at $135.50 and price could take another crack at executing the bullish falling wedge. I have been eyeing that wedge for weeks, but today the support line within caught my eye. The PMO and the bullish chart pattern keep telling us that price will breakout. I'll be interested in seeing how TLT responds to the $135.50 support line in the coming days.
**Don't miss any of the DecisionPoint commentaries! Go to the "Notify Me" box toward the end of this blog page to be notified as soon as they are published.**
Technical Analysis is a windsock, not a crystal ball.
Happy Charting! - Erin
Email: erinh@stockcharts.com

Erin Swenlin will be presenting at the The MoneyShow Las Vegas May 11-13, 2020! You'll have an opportunity to meet Erin and discuss the latest DecisionPoint news and Diamond Scans. The conference is free to attend or view online!
NOTE: The signal status reported herein is based upon mechanical trading model signals, specifically, the DecisionPoint Trend Model. They define the implied bias of the price index based upon moving average relationships, but they do not necessarily call for a specific action. They are information flags that should prompt chart review. Further, they do not call for continuous buying or selling during the life of the signal. For example, a BUY signal will probably (but not necessarily) return the best results if action is taken soon after the signal is generated. Additional opportunities for buying may be found as price zigzags higher, but the trader must look for optimum entry points. Conversely, exit points to preserve gains (or minimize losses) may be evident before the model mechanically closes the signal.
Helpful DecisionPoint Links (Can Be Found on DecisionPoint.com Links Page):
DecisionPoint Shared ChartList and DecisionPoint Chart Gallery
Price Momentum Oscillator (PMO)
Swenlin Trading Oscillators (STO-B and STO-V)