

We've got an interesting mix of "diamonds" today. I'm not particularly clever with my titles, but today's does give away that Weight Watchers (WW), Campbell's (CPB) and Home Depot (HD) are on today's list. I also have Dominion Energy (D) and Avalara (AVLR), a software company. I really had to comb through my results today, looking at well over 120 charts to find my favorites. These names look good in the short and intermediate terms.
I love to get your feedback on DP commentary, so shoot me an email at erinh@stockcharts.com. I read every one of them and try to answer them all! Your insight helps me to tailor my commentary to what my readers and viewers want to hear about.
Welcome to "DecisionPoint Daily Diamonds," a newsletter in which I highlight five "diamonds in the rough" taken from the results of one of my DecisionPoint scans. Remember, these are not recommendations to buy or sell, but simply stocks that I found interesting. The objective is to save you the work of the initial, tedious culling process, but you need to apply your own analysis to see if these stocks pique your interest as well. There are no guaranteed winners here!
Current Market Outlook:
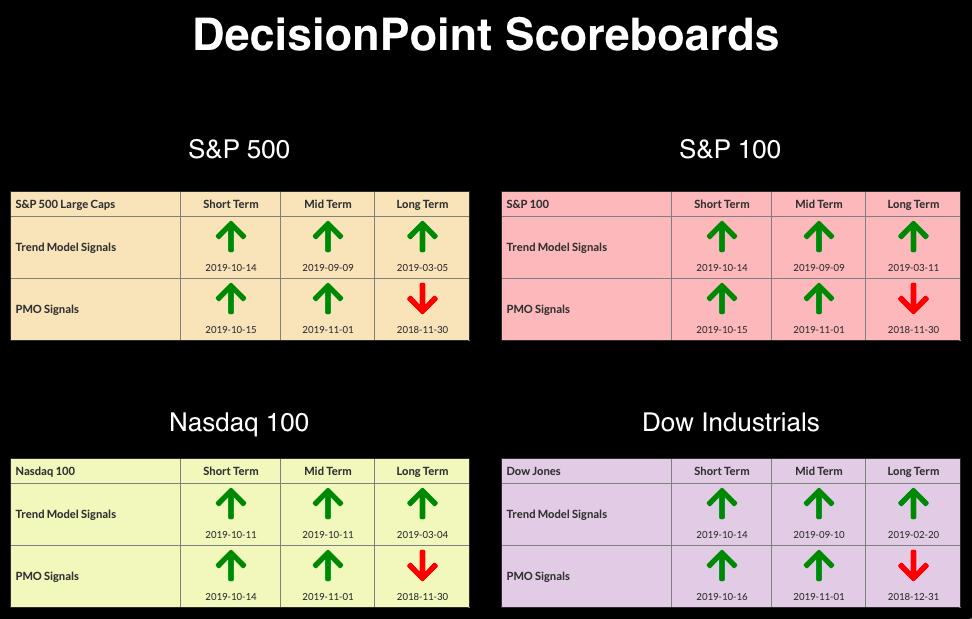
Market Trend: Currently, we have Trend Model BUY signals in all three timeframes on the DP Scoreboard Indexes.
Market Condition: The market is overbought, with Price Momentum Oscillator (PMO) BUY signals on the DP Scoreboards. Remember, overbought conditions can persist in a bull market.
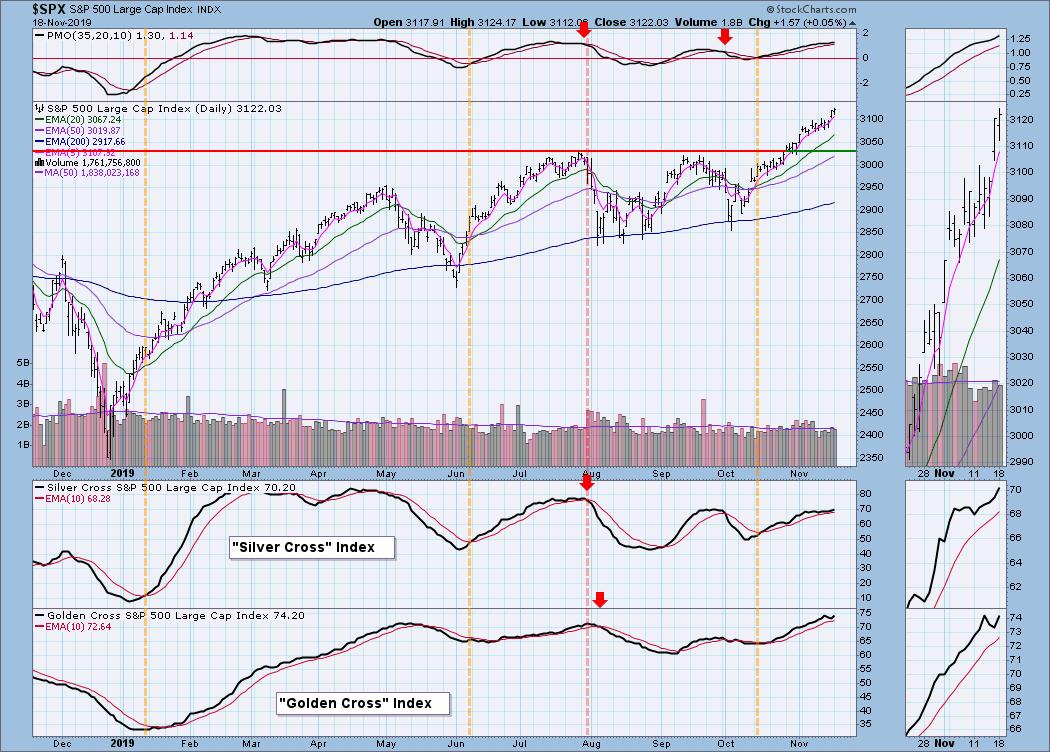
Market Environment: It is important to consider the odds for success. The Silver Cross Index measures the percentage of stocks on IT Trend Model BUY signals (20-EMA > 50-EMA), while the Golden Cross Index measures the percentage of stocks on LT Trend Model BUY signals (50-EMA > 200-EMA). Here are the current percentages on the Silver and Golden Cross Indexes:
Diamond Index:
- Diamond Scan Results: 11
- Diamond Dog Scan Results: 14
- Diamond Bull/Bear Ratio: 0.78
Avalara Inc (AVLR) - Earnings: 11/25/2019
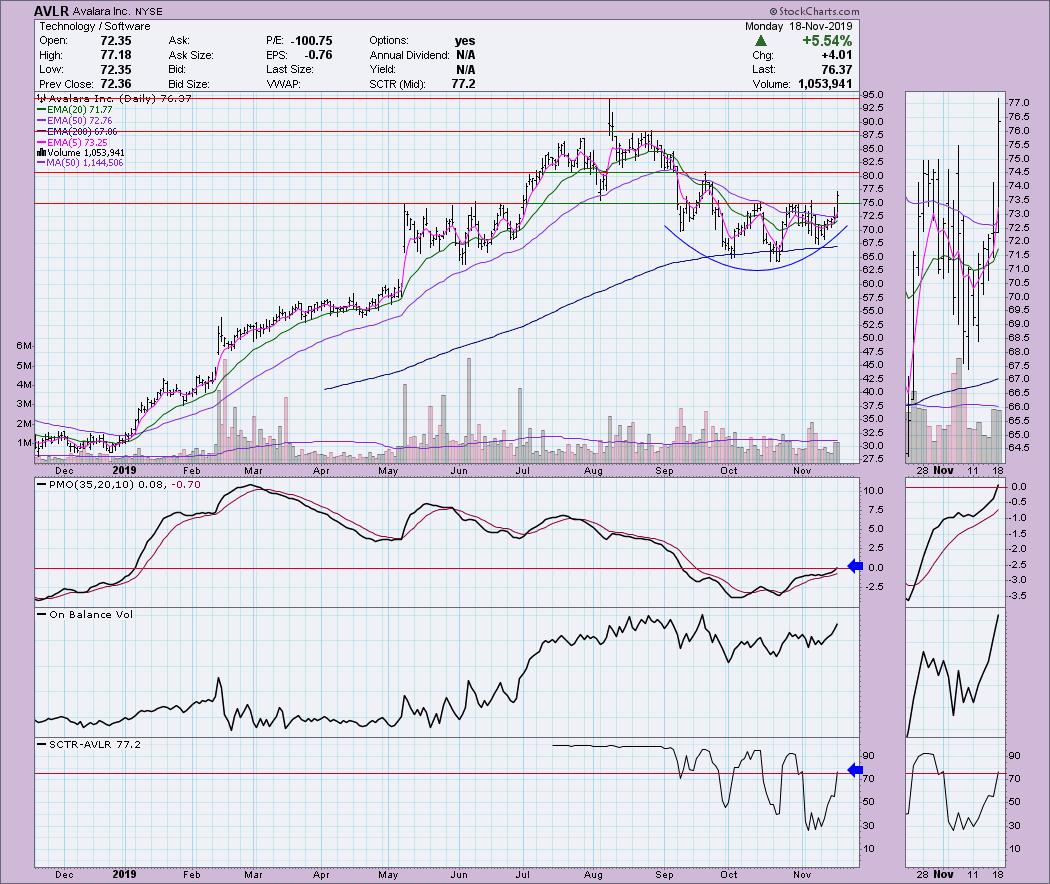
This one reports next week. The price chart is looking good, with a cup forming and now a breakout. There was a particularly big move to the upside today and the positive volume is coming in. The OBV is breaking out above previous tops, just like price. The PMO has now turned positive and continues to rise. The first hurdle will be around $80, but I expect it to test the August high based on the bullishness of this chart. It was up over 5.5% today, so maybe add this one to your watchlist for next week after earnings if you prefer not to take the earnings report risk.
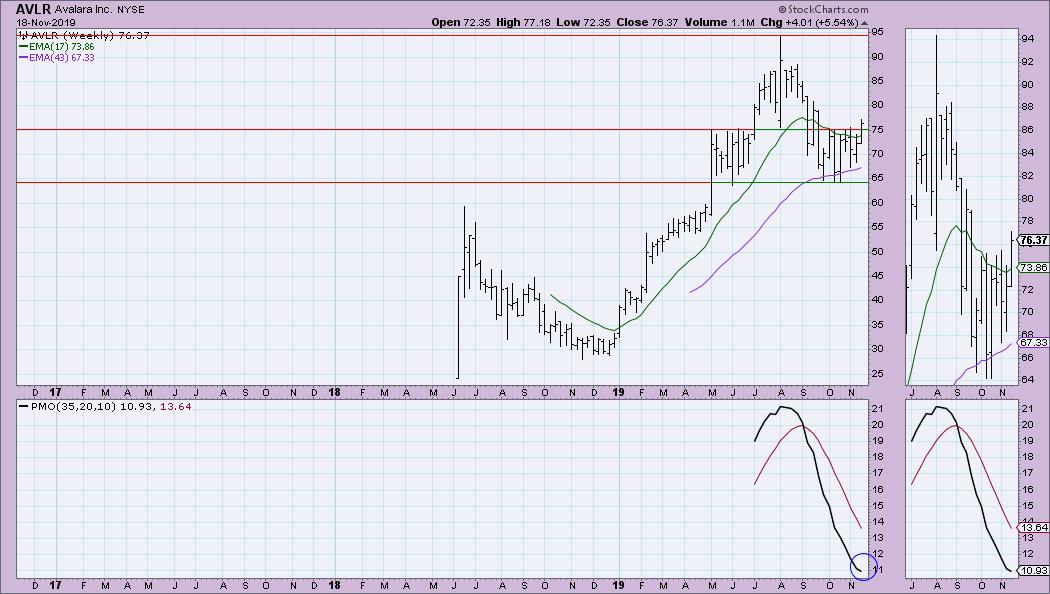
There isn't much data on the weekly chart, but I think it does tell us the importance of this week's breakout. The PMO is beginning to decelerate somewhat.
Campbell Soup Co (CPB) - Earnings: 1/14/2020
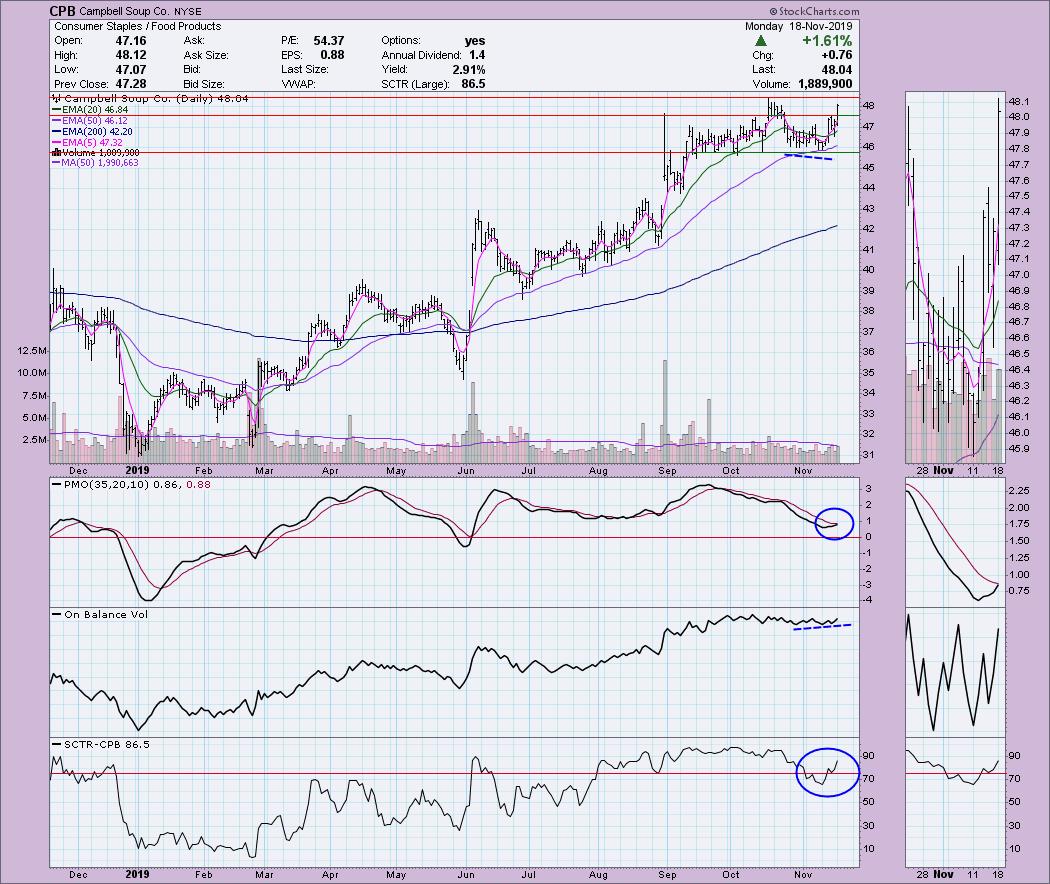
Today was a big move to the upside that moved above the August spike. There is still the October top to get past as far as overhead resistance goes. Notice that, before this last rally, we had a positive divergence with OBV lows. The SCTR is now above 75, which suggests internal and relative strength.
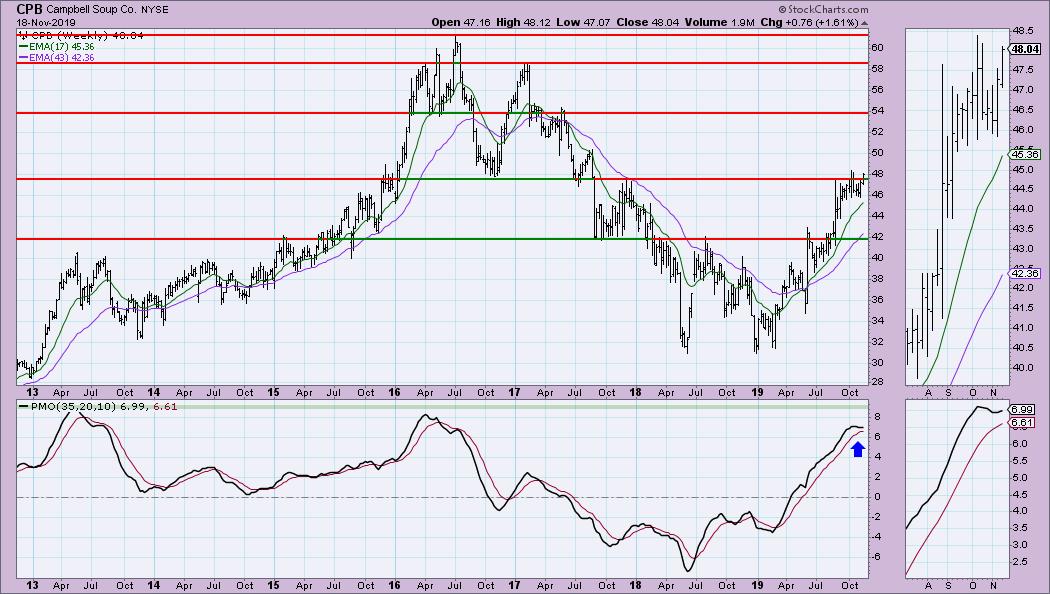
While the weekly PMO is somewhat overbought, it is bottoming above its signal line, which I always find to be particularly bullish. We've seen much higher readings back in 2013, so there is room for the PMO to stretch higher. I've marked the areas where I would be looking for strong overhead resistance.
Dominion Energy Inc (D) - Earnings: 1/30 - 2/3/2020
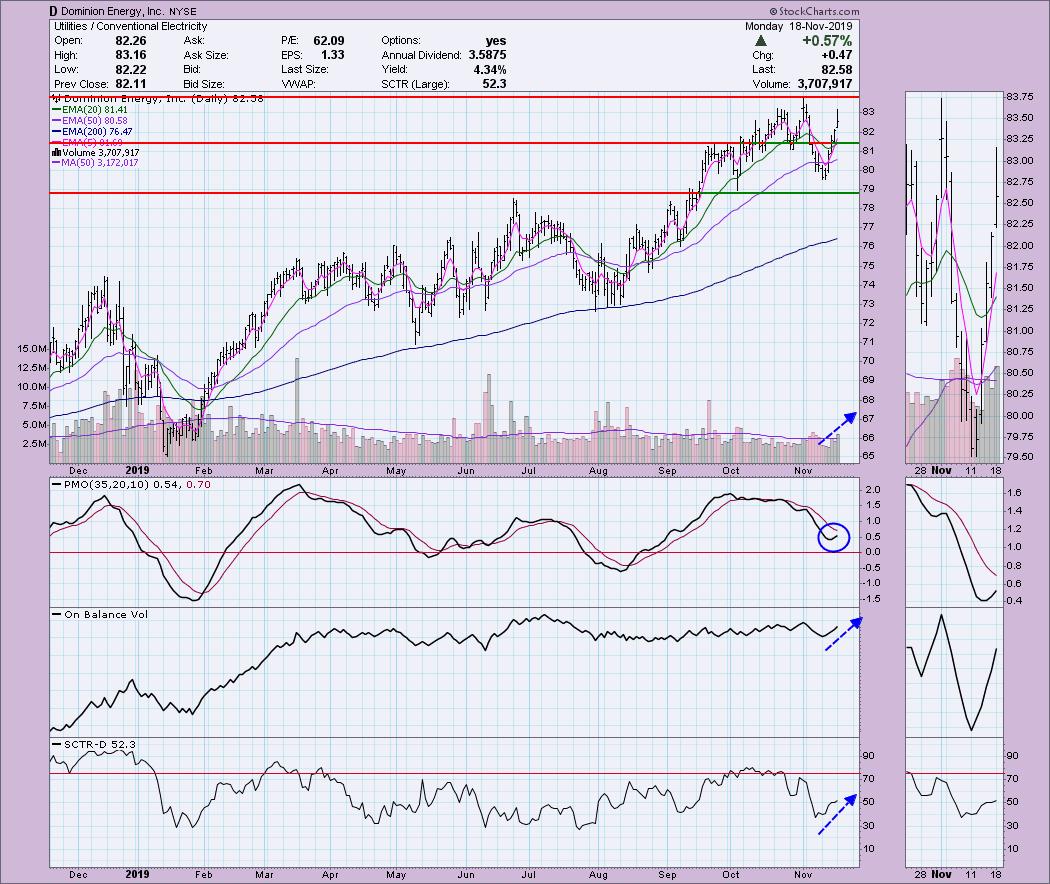
Big gap up and breakout for Dominion Energy. It hasn't overcome the November top, which could pose a problem, but the volume pattern, the PMO turning up above the zero line and rising OBV and SCTR tell me it should be able to pop above that resistance.
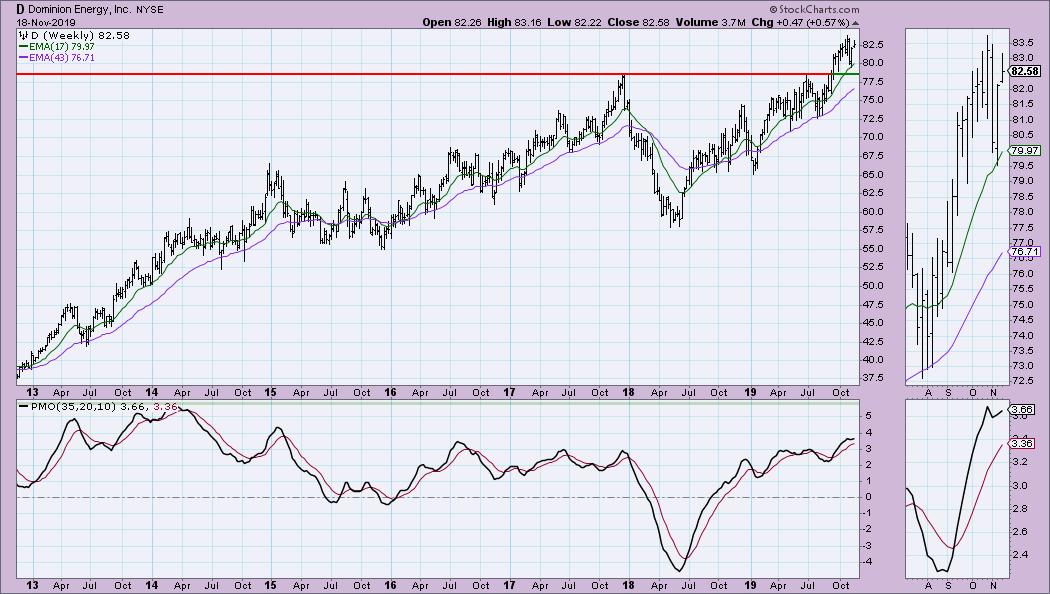
The PMO looks somewhat overbought, but we have certainly seen higher readings. We have a PMO bottom above the signal line.
Home Depot Inc (HD) - Earnings: 11/19/2019
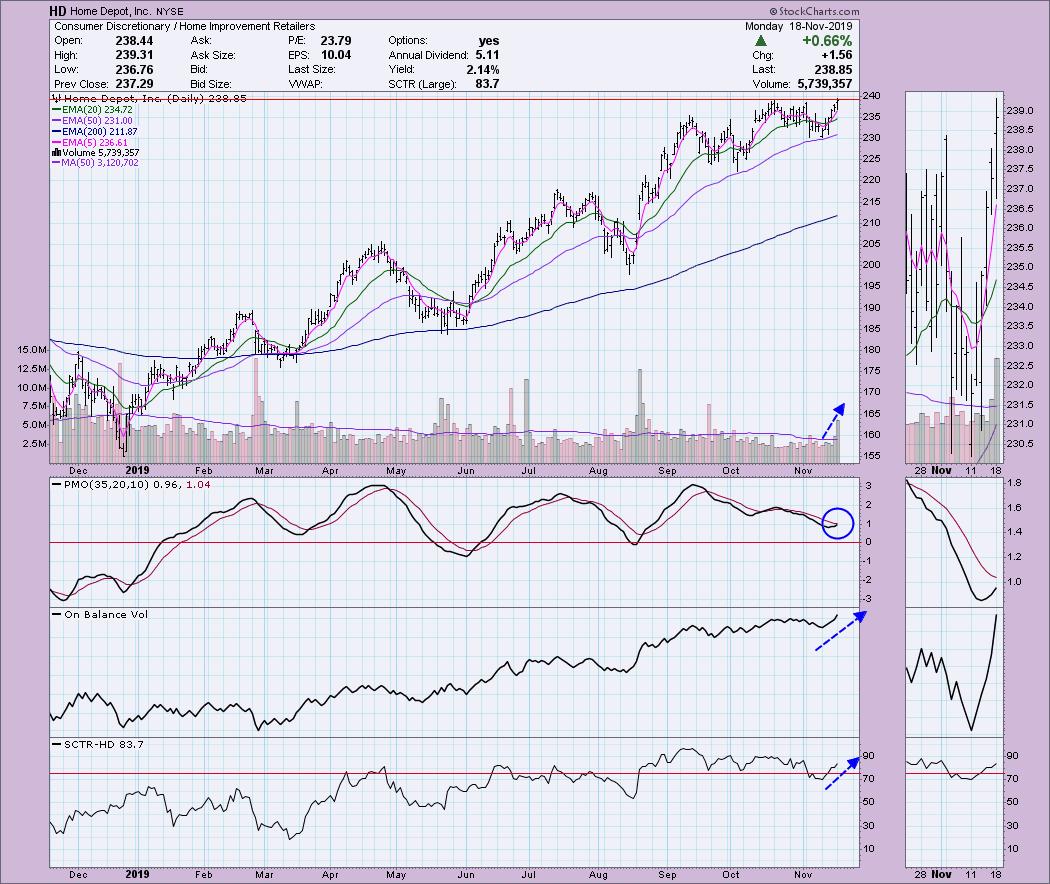
The price chart looks pretty good. HD broke out above the previous November high today and managed to move above the October high intraday. They do report earnings tomorrow, so you'll likely want to wait on this or find a good intraday entry. If they weren't reporting earnings tomorrow, I would like HD even more, but the bullish signs are still there: Rising volume, rising PMO nearing a BUY signal, OBV breaking out and SCTR in the hot zone.
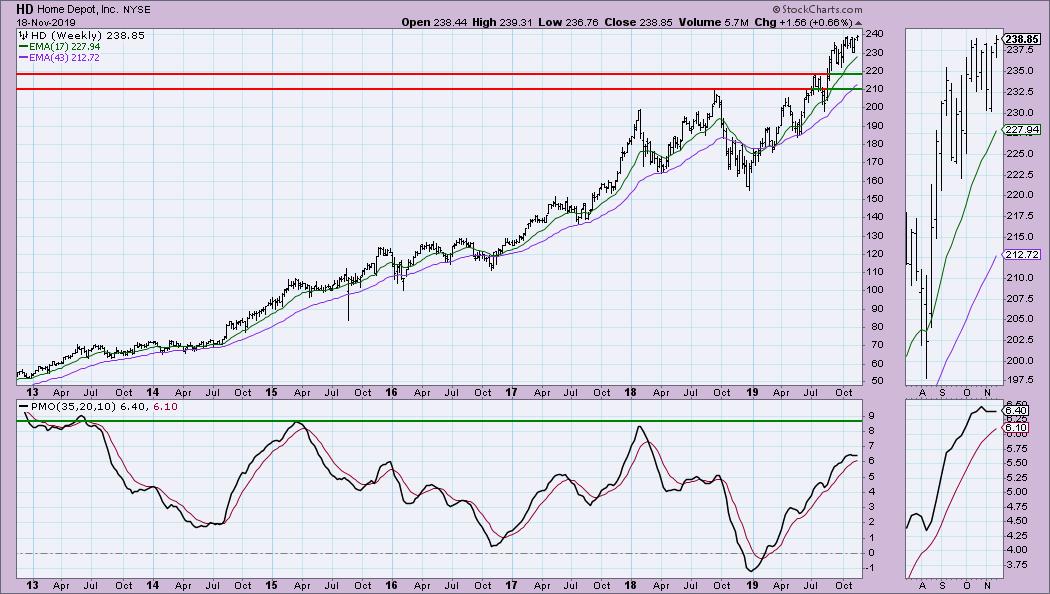
The weekly PMO has decelerated and is ready to start rising again. It is only somewhat overbought.
Weight Watchers Intl Inc (WW) - Earnings: 11/5/2019
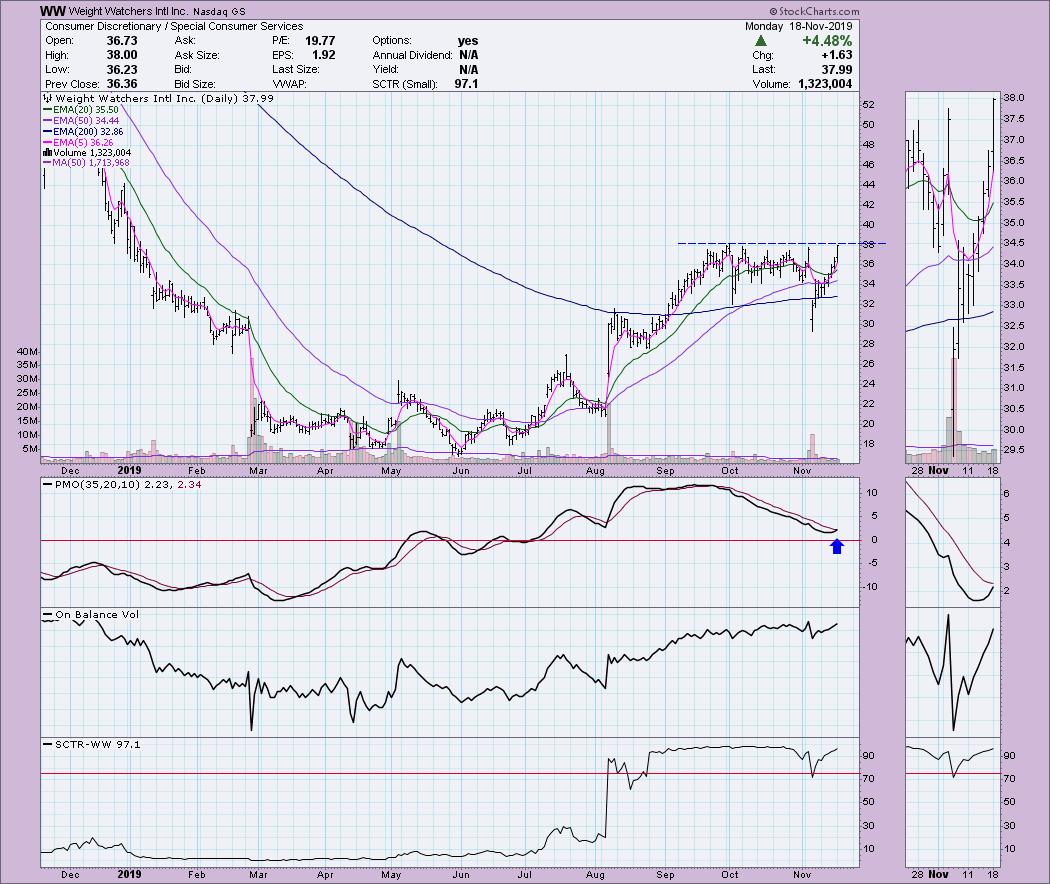
I'm fairly certain this one was a "diamond" recently, but I think it is worth repeating. The PMO rounded up just above the zero line and is about to give us a PMO crossover BUY signal. It hasn't quite broken out, but it did close near the high for the day, which is positive. It was a nearly 4.5% move to the upside today, so, if you enter, I'd give it a "wait and see" on the open. It could get a nice pullback to the 20-EMA, which would be a better entry.
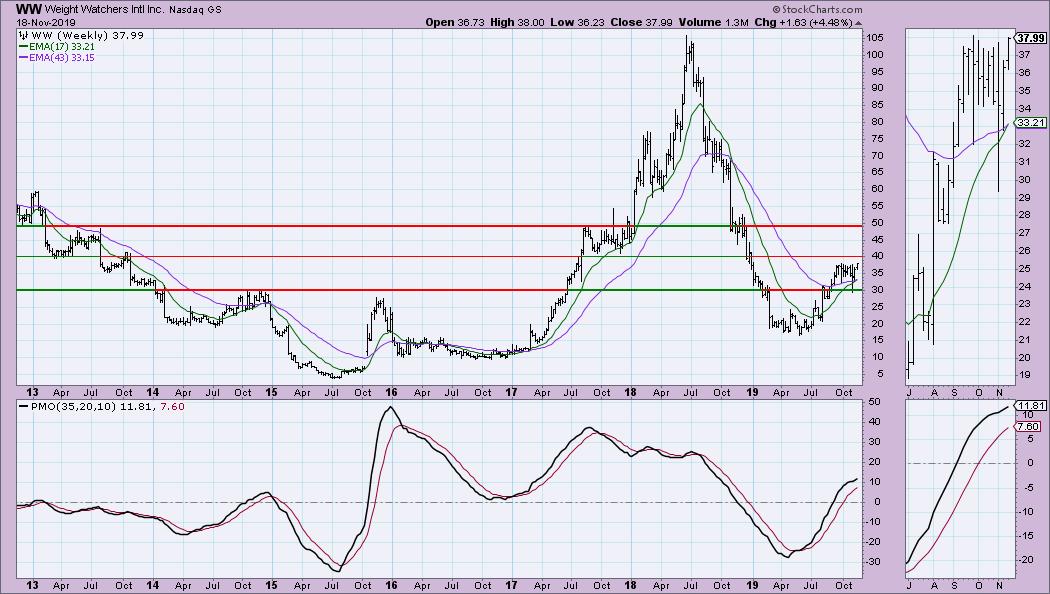
The weekly PMO looks great. Despite the consolidation or pause, the PMO continued to move higher and never really turned down. It is not overbought and could certainly move higher. $40 could pose difficult resistance, given it matches up with previous support back in 2013 and 2017. My upside target is still $50 or more.
Full Disclosure: I do not own any of the stocks above and I'm not planning on adding any at this time. While I can't guarantee that I won't add any, I can say that 99% of my investments come from my scans, so I am showing you my actual candidates. I'm currently about 80% in cash.

Erin Swenlin will be presenting at the The MoneyShow Las Vegas May 11-13, 2020! You'll have an opportunity to meet Erin and discuss the latest DecisionPoint news and Diamond Scans. The conference is free to attend or view online!
Watch the latest episode of DecisionPoint with Carl & Erin Swenlin LIVE on Mondays 5:00p EST or on the StockCharts TV YouTube channel here!
Technical Analysis is a windsock, not a crystal ball.
Happy Charting!
- Erin
erinh@stockcharts.com
NOTE: The stocks reported herein are from mechanical trading model scans that are based upon moving average relationships, momentum and volume. DecisionPoint analysis is then applied to get five selections from the scans. The selections given should prompt readers to do a chart review using their own analysis process. This letter is not a call for a specific action to buy, sell or short any of the stocks provided. There are NO sure things or guaranteed returns on the daily selection of "diamonds in the rough."
Helpful DecisionPoint Links:
DecisionPoint Shared ChartList and DecisionPoint Chart Gallery
Price Momentum Oscillator (PMO)
Swenlin Trading Oscillators (STO-B and STO-V)
**Don't miss DecisionPoint Commentary! Add your email below to be notified of new updates"**