
 I've seen this happen a few times. Today, I ran my Diamond PMO Scan and received 30 results that were ALL Bond ETFs. Rather than put those in, I decided, given the market environment, that I would give you some shorting opportunities. There were plenty to choose from as the Diamond Dog Scan produced 115 results today. I don't necessarily short the market, but, after doing my DP Alert Mid-Week and reviewing both the Swenlin Trading Oscillators (STOs) and ITBM/ITVM, I suspect there will be more downside to swallow after a short-term reaction bounce. I present these for you to review. Something to consider: the Gold and Silver Cross Indexes just had negative crossovers, which often seem to precede market corrections or pullbacks. The chart is in this week's DP Alert Mid-Week.
Welcome to "DecisionPoint Daily Diamonds", a newsletter in which we highlight five "diamonds in the rough" taken from the results of one of my DecisionPoint scans. Remember, these are not recommendations to buy or sell, but simply stocks that I found interesting. The objective is to save you the work of the initial, tedious culling process, but you need to apply your own analysis and to see if these stocks pique your interest. There are no guaranteed winners here.
Current Market Outlook:
Market Trend: DP Trend Models are on BUY signals for the SPX.
Market Condition: The market lost support. DecisionPoint Scoreboards (NDX, Dow, OEX and SPX) show Neutral and SELL signals in the short term. We may be oversold, but I believe prices could move lower.
Market Environment: It is important to consider the "odds" for success. Here are the current percentages on the Silver and Golden Cross Indexes, which began to rise again after today's action:
- Silver Cross: 62.20% SPX ITTM Buy Signals (down -7% from Monday)
- Golden Cross: 65.2% SPX LTTM Buy Signals (down -1.2% from Monday)
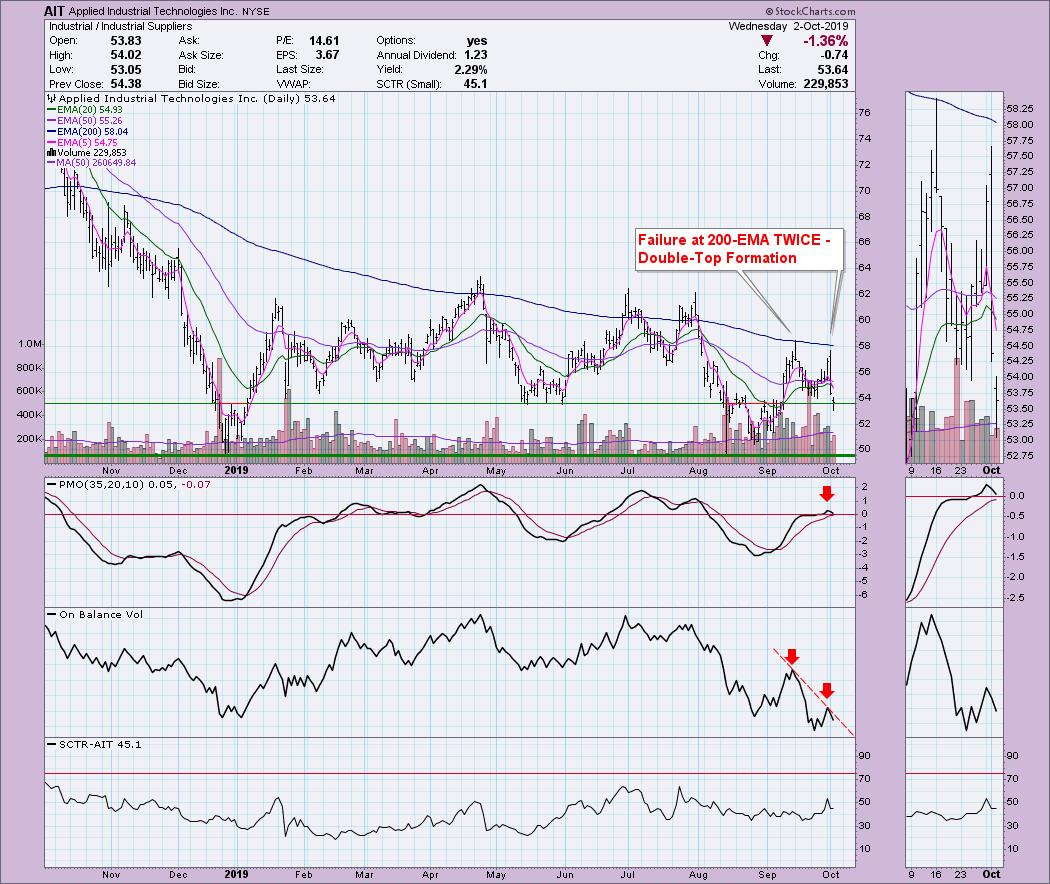
Applied Industrial Technologies Inc (AIT) - Earnings: 10/29 - 11/4/2019
When I look for shorts, I want the next level of support to be very far away if possible. This one doesn't quite fit that bill, but we see two failures to cross above the 200-EMA. The last three major tops all at least managed to make a move above that important EMA. We also have a double-top that executed with today's drop. The expectation of the pattern is around the December low (height of pattern subtracted from breakdown point). Note also that the PMO is topping only slightly above zero. We also have a negative divergence with the OBV tops and price tops.
Berry Plastics Group Inc (BERY) - Earnings: 11/13 - 11/18/2019
Please note that this is a weekly chart. The daily chart didn't give us any view of the next support levels or how important the short-term breakdown below $38 is. This one is pretty ugly (oxymoron, ha!). This breakdown is serious, having broken below significant support along the 2015 tops. Now it isn't a "decisive" breakdown, but it sure appears we will see a continuation of this move. The weekly PMO has been as high as +10, so -10 is oversold. BERY's PMO is -5.80, so we could certainly see it move lower.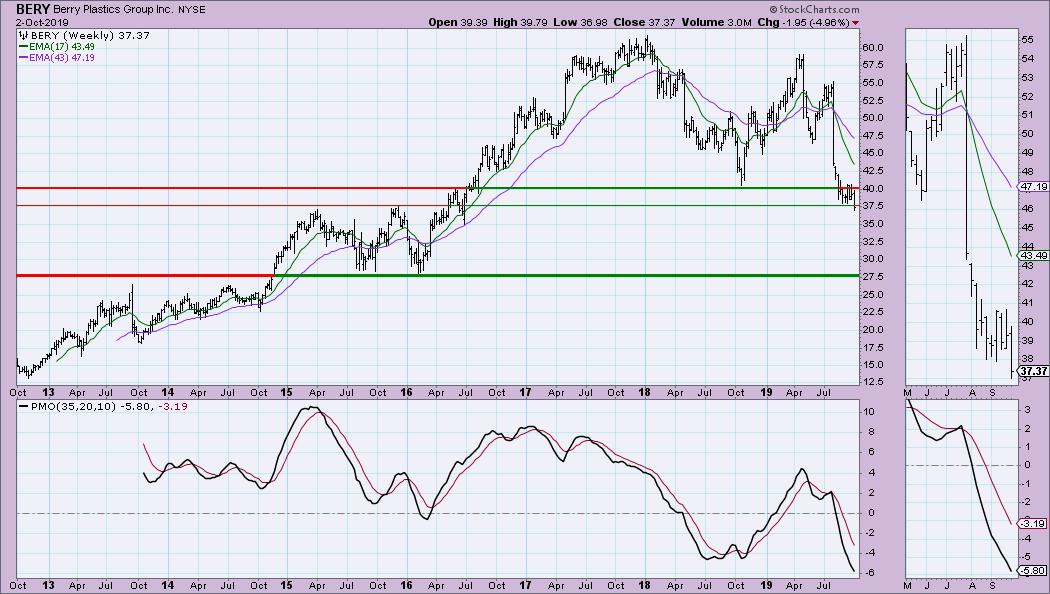
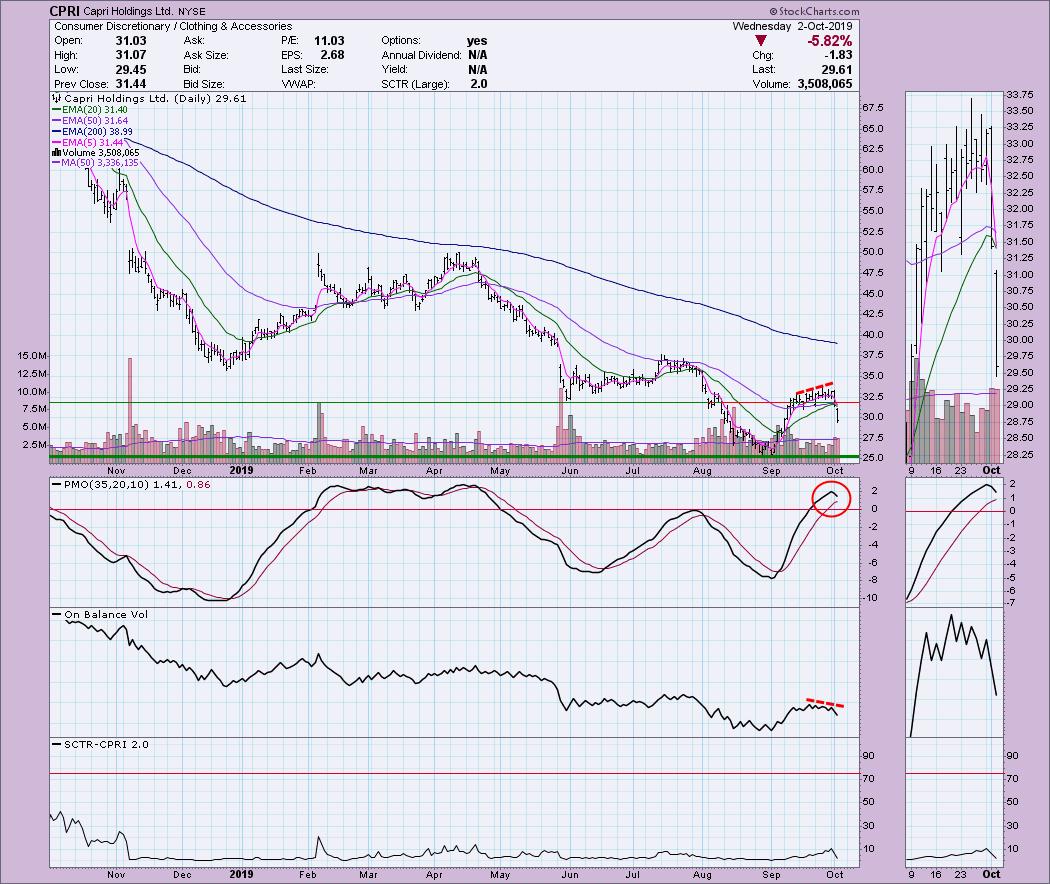
Capri Holdings Ltd (CPRI) - Earnings: 11/5 - 11/11/2019
This one took a serious hit to the downside today, but I think it will fall further (maybe after a small bounce or pause). The PMO has peaked, while the OBV has been in a negative divergence with price most of September. Support arrives all the way down at $25.
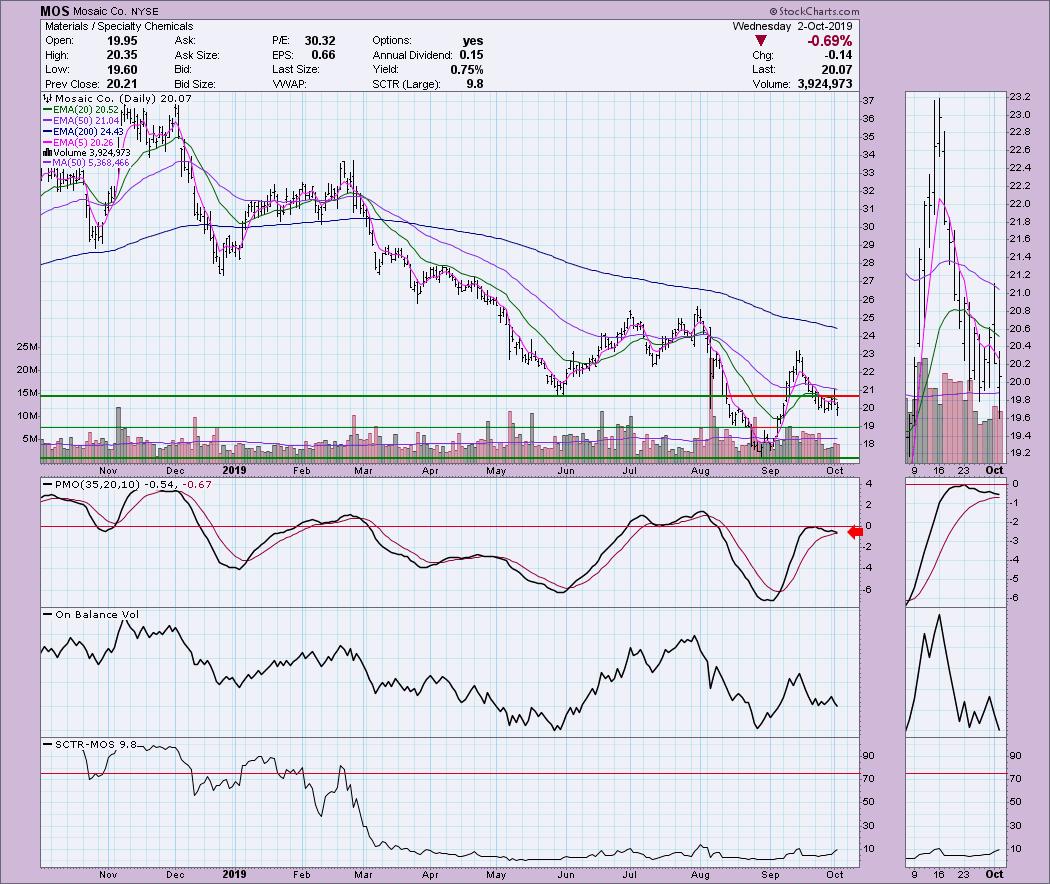
Mosaic Co (MOS) - Earnings: 11/4/2019
The PMO is just about ready to have a negative crossover after topping below the zero line, which is especially bearish. The only thing I'm not thrilled with is that interim support could be found around $19 at that small bottom from August. More likely we should see a drop to nearly $17. This sector has been struggling for some time and I don't see it improving any time soon unless it is Gold-related.
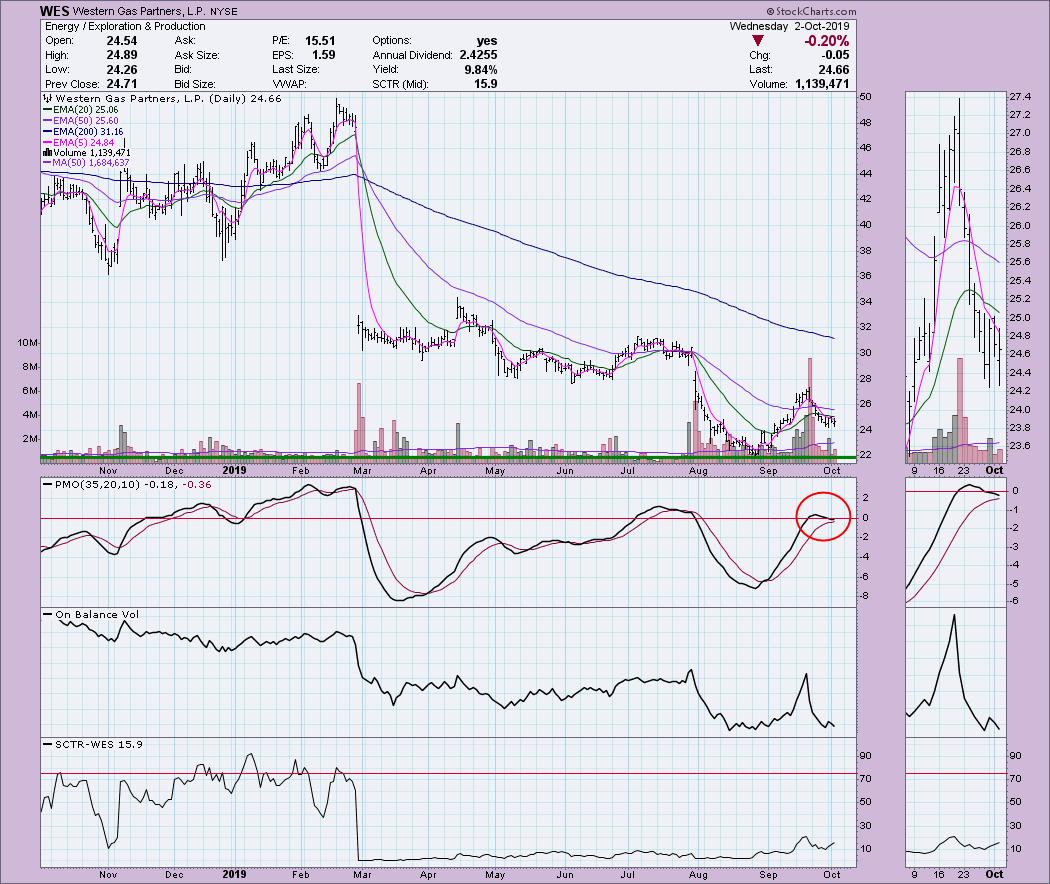
Western Gas Partners (WES) - Earnings: 10/28 - 11/1/2019
A drop above $2 seems imminent for WES. I don't see any near-term support until $22. The PMO has turned over just above the zero line and is lined up for a negative crossover SELL signal. The OBV hasn't turned up except on the lone up day on Monday. Volume has been high and negative for over a week and a half.
Full Disclosure: I do not own any of the stocks above and I am not planning on shorting any of them at this time. I'm currently about 60% in cash.
Watch the latest episode of DecisionPoint with Carl & Erin Swenlin LIVE on Mondays 5:00p EST or on the StockCharts TV YouTube channel here!
Technical Analysis is a windsock, not a crystal ball.
Happy Charting!
- Erin
erinh@stockcharts.com
NOTE: The stocks reported herein are from mechanical trading model scans that are based upon moving average relationships, momentum and volume. DecisionPoint analysis is then applied to get five selections from the scans. The selections given should prompt readers to do a chart review using their own analysis process. This letter is not a call for a specific action to buy, sell or short any of the stocks provided. There are NO sure things or guaranteed returns on the daily selection of "diamonds in the rough."
Helpful DecisionPoint Links:
DecisionPoint Shared ChartList and DecisionPoint Chart Gallery
Price Momentum Oscillator (PMO)
Swenlin Trading Oscillators (STO-B and STO-V)
**Don't miss DecisionPoint Commentary! Add your email below to be notified of new updates"**