

I have decided to add my own (not yet charted) Diamond Index section as part of the Market Outlook section below. Basically, I will list the number of results that the Diamond Scan (formerly my General PMO Scan) returns, as well as the inverse Diamond Dog Scan. I then calculate a "bull/bear" ratio of the two. It could turn out to be an interesting new indicator, but for now I'm just collecting the data so that I can chart it when I have enough history. Today's Diamonds came mostly from the defensive sectors of Consumer Staples and REITs.
Welcome to "DecisionPoint Daily Diamonds", a newsletter in which we highlight five "diamonds in the rough" taken from the results of one of my DecisionPoint scans. Remember, these are not recommendations to buy or sell, but simply stocks that I found interesting. The objective is to save you the work of the initial, tedious culling process, but you need to apply your own analysis and to see if these stocks pique your interest. There are no guaranteed winners here.
Current Market Outlook:
Market Trend: Currently have Short-Term Trend Model Neutral signals for the DP Scoreboard Indexes. The NDX triggered an IT Trend Model Neutral signal today when the 20-EMA dropped below the 50-EMA.
Market Condition: Weak internals with Price Momentum Oscillator SELL Signals on DP Scoreboard Indexes.
Market Environment: It is important to consider the "odds" for success. Here are the current percentages on the Silver and Golden Cross Indexes:
- Silver Cross: 52.2% SPX ITTM Buy Signals (20-EMA > 50-EMA)
- Golden Cross: 65.0% SPX LTTM Buy Signals (50-EMA > 200-EMA)
Diamond Index:
- Diamond Scan Results: 21
- Diamond Dog Scan Results: 20
- Diamond Ratio: 1.05
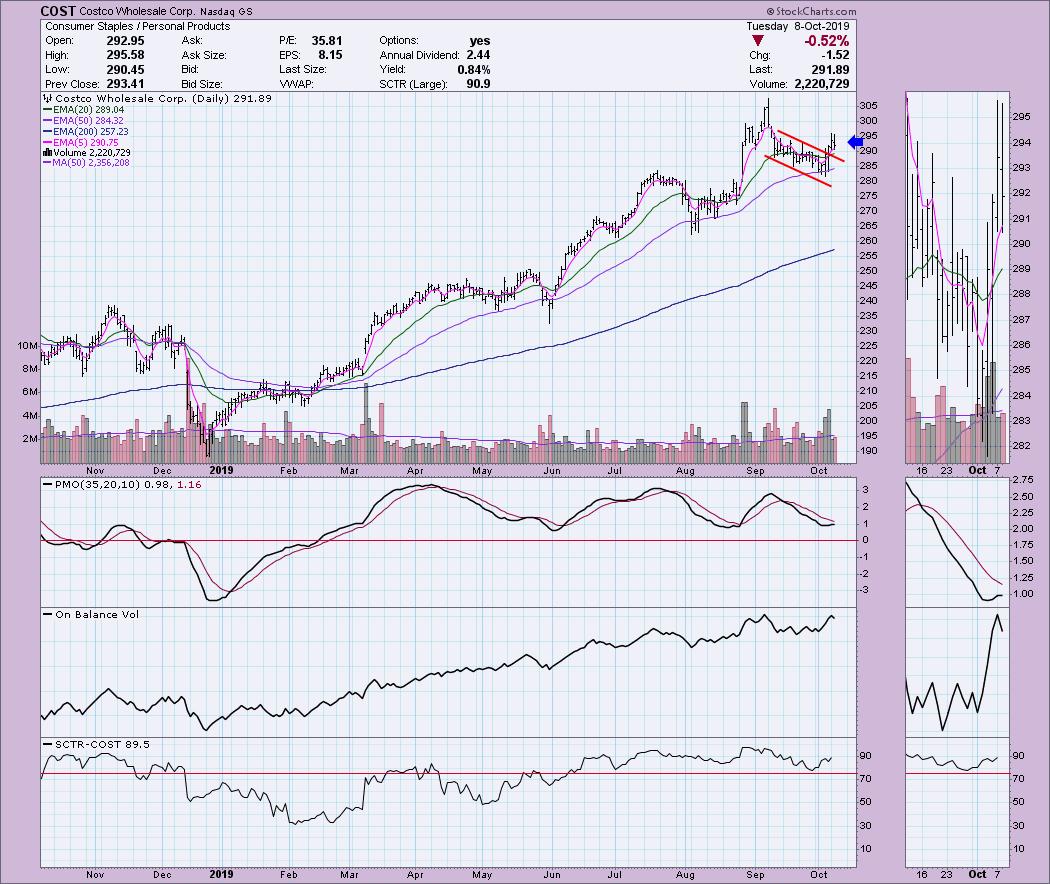
Costco Wholesale Corp (COST) - Earnings: 12/11 - 12/16/19
This is a pretty solid company in a defensive area of the market. COST broke out of a declining trend channel and put itself back above the 20-EMA. Today, it pulled back to the breakout area and should be ready to move upward from there. The PMO, upon closer inspection in the thumbnail, is a little bit suspect as it is flattening, but, with the price closing right about where it did on Friday, it makes sense that we'd see this. Everything else looks positive.
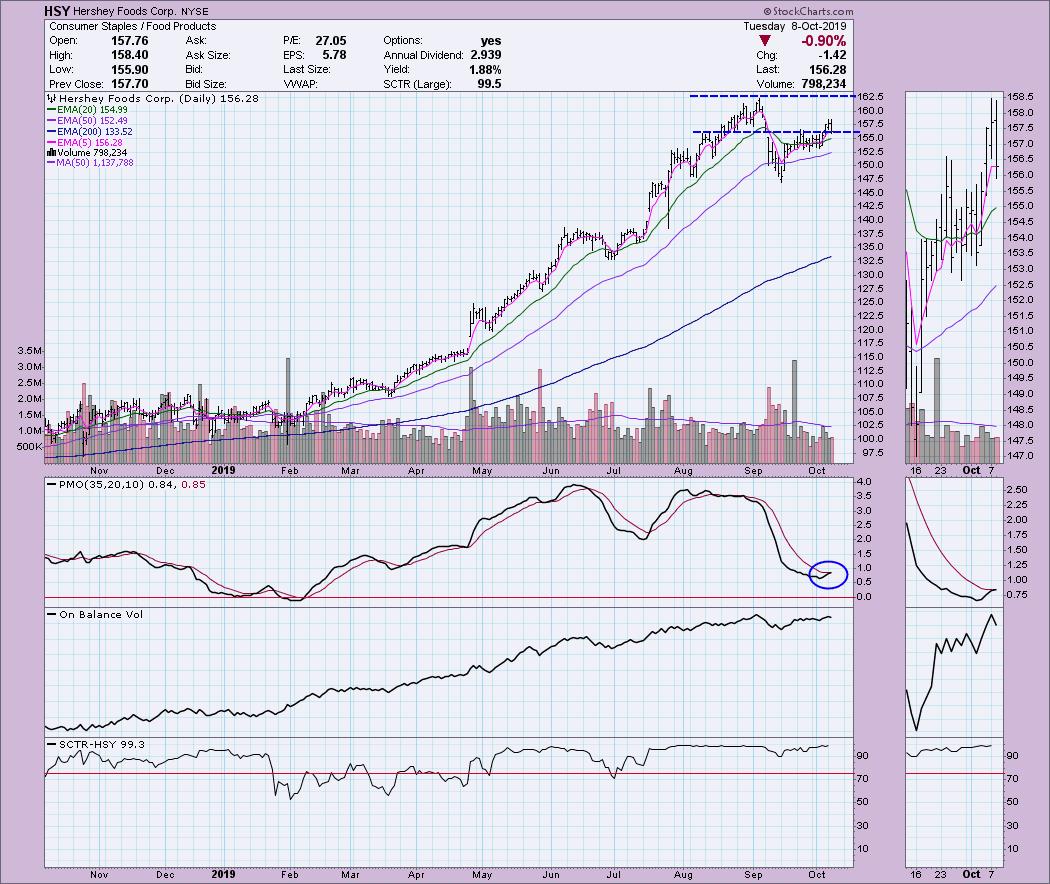
Hershey Foods Corp (HSY) - Earnings: 10/24/2019
I have to say I always get a chuckle when I see that chocolate and beer/alcohol are in the consumer staples sector. Admittedly, they are an "inelastic" budget item for me! HSY broke out above its 20-EMA and, from there, proceeded to break above previous resistance at the early August top and beginning of September gap. With this rally, it has closed that gap, so the expectation would be to move higher and test the September top. The PMO is about to trigger a BUY signal.
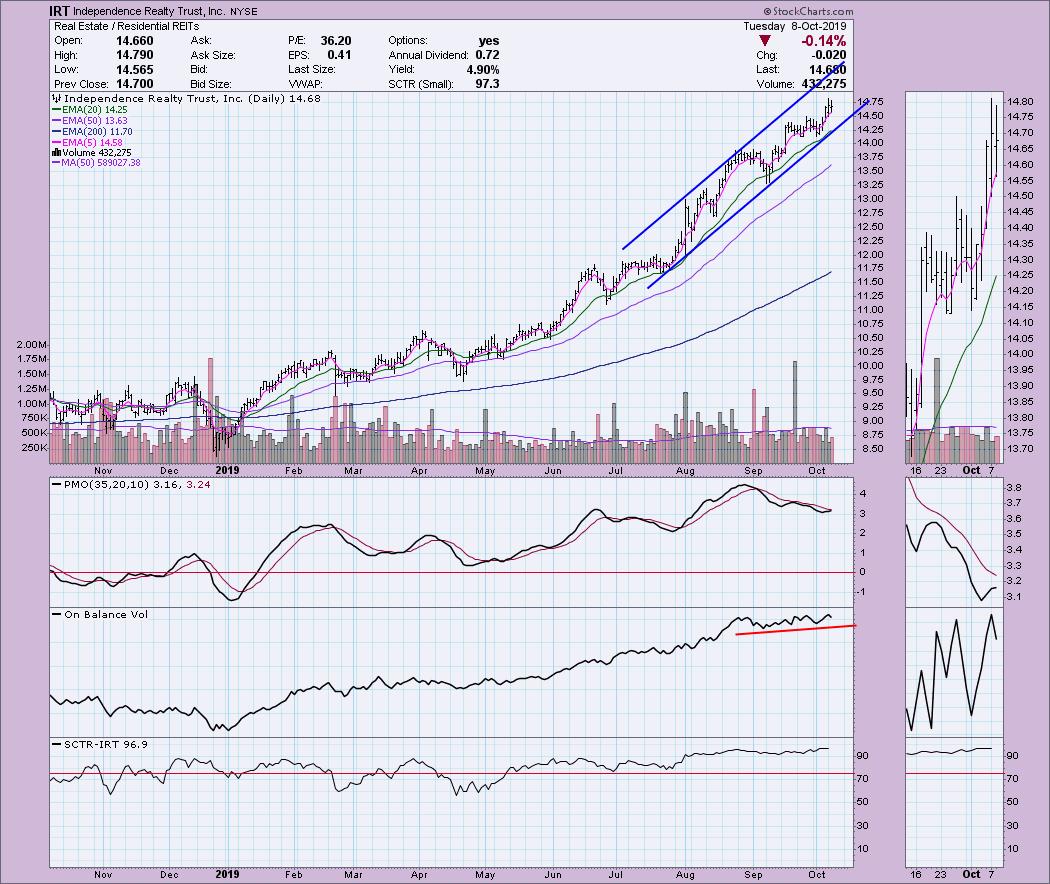
Independence Realty Trust (IRT) - Earnings: 10/30/2019
This one has been a high flyer for some time, but I suspect it can move higher still within this strong rising trend channel. Don't be concerned about the declining lows on the PMO. When you have steady acceleration, the PMO will flatten and even move lower. It is somewhat overbought still, but I like that the OBV continues to show rising bottoms. It pulled back slightly today and may need to test the bottom of the rising trend channel before moving higher.
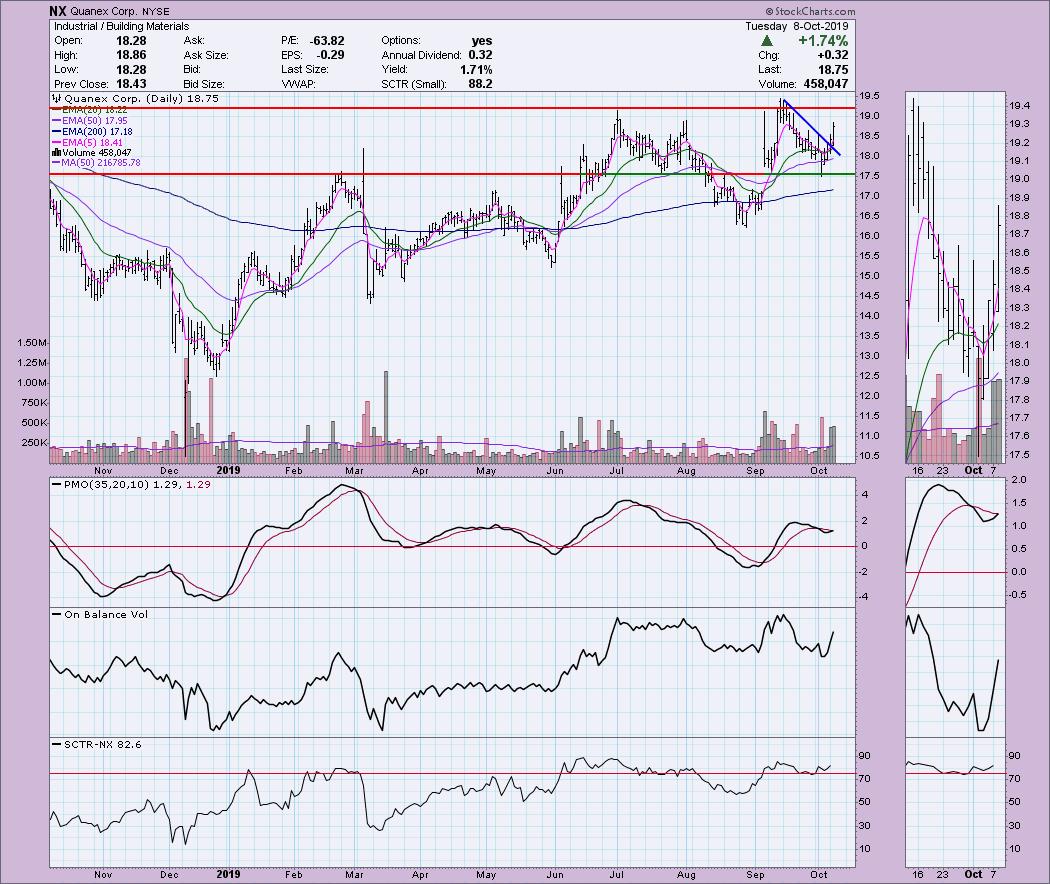
Quanex Corp (NX) - Earnings: 12/9 - 12/13/2019
Very strong breakout move today on NX. This one likely will pull back a bit before moving higher. I'd wait for that and avoid chasing. On Friday, it broke out above the 20-EMA and hasn't really pulled back since. The PMO is about to trigger a BUY signal; note the volume that came in the last four trading days, which is impressive. The SCTR is still strong and a move to test September's top seems reasonable.
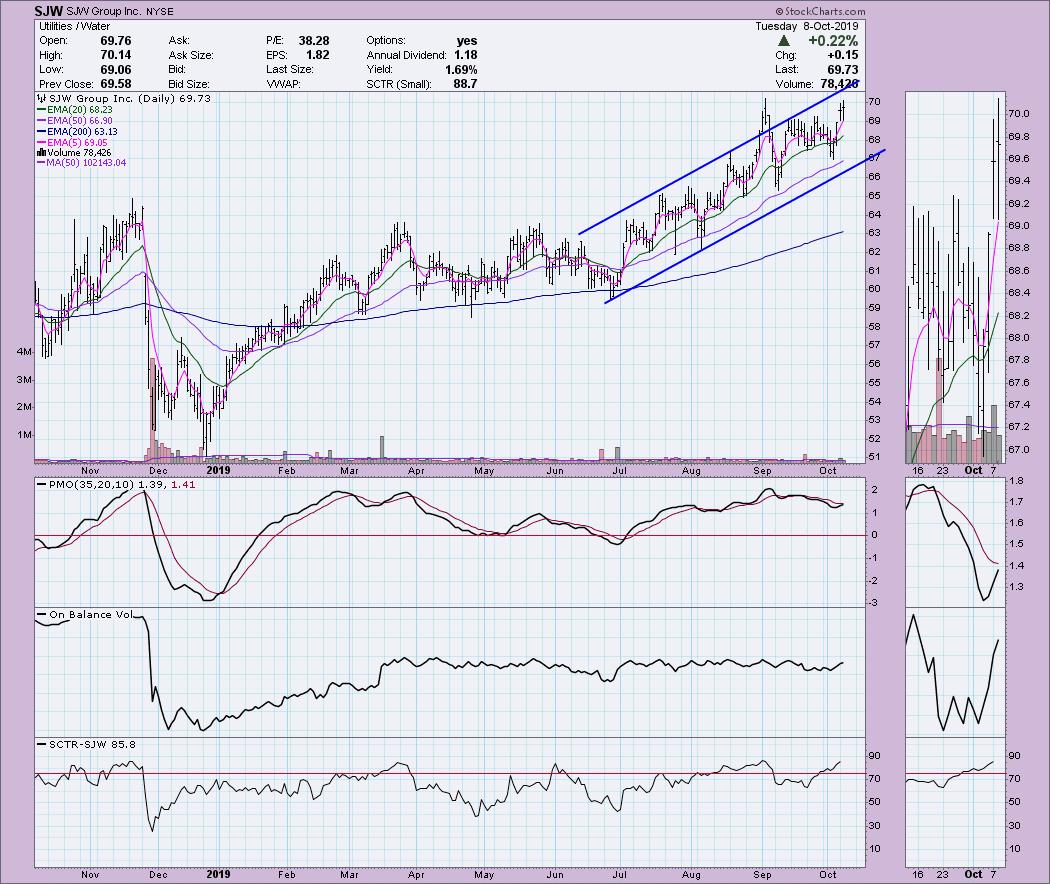
SJW Group Inc (SJW) - Earnings: 10/22 - 10/28/2019
The break above $69 is what prompted me to add this one to the list. It is in a strong rising trend channel in the defensive Utilities sector. Here is another example of a flattening PMO and even pullback as price acceleration steadied. I would be cautious of a test of the bottom of this rising trend channel. The volume on this recent break above $69 is healthy as well.
Full Disclosure: I do not own any of the stocks above and I am not planning on purchasing these or any additional stocks at this time. I'm currently about 60% in cash and watching my stops closely.
Watch the latest episode of DecisionPoint with Carl & Erin Swenlin LIVE on Mondays 5:00p EST or on the StockCharts TV YouTube channel here!
Technical Analysis is a windsock, not a crystal ball.
Happy Charting!
- Erin
erinh@stockcharts.com
NOTE: The stocks reported herein are from mechanical trading model scans that are based upon moving average relationships, momentum and volume. DecisionPoint analysis is then applied to get five selections from the scans. The selections given should prompt readers to do a chart review using their own analysis process. This letter is not a call for a specific action to buy, sell or short any of the stocks provided. There are NO sure things or guaranteed returns on the daily selection of "diamonds in the rough."
Helpful DecisionPoint Links:
DecisionPoint Shared ChartList and DecisionPoint Chart Gallery
Price Momentum Oscillator (PMO)
Swenlin Trading Oscillators (STO-B and STO-V)
**Don't miss DecisionPoint Commentary! Add your email below to be notified of new updates"**